Summary
Calcitonin gene-related peptide (CGRP) is a widely expressed neuropeptide that plays a major role in sensory neurotransmission. The CGRP receptor is a heterodimer of the calcitonin receptor-like receptor (CLR) class B G-protein-coupled receptor and the type 1 transmembrane domain protein, receptor activity modifying protein (RAMP) 1. Herein, we report the 3.3 Å structure of the human CGRP receptor in complex with CGRP and the Gs-protein heterotrimer determined by Volta phase plate cryo-electron microscopy. The RAMP transmembrane domain sits at the interface between transmembrane domains 3, 4 and 5 of CLR, and stabilises CLR extracellular loop 2. RAMP1 makes only limited direct interaction with CGRP, consistent with allosteric modulation of CLR as its key function. Molecular dynamics simulations indicate that RAMP1 provides stability to the receptor complex, particularly the location of the CLR extracellular domain. The work provides novel insight into the control of G-protein-coupled receptor function.
CGRP is a physiologically important sensory neuropeptide whose roles include modulation of metabolism, inflammatory response and blood pressure, as well as auditory nerve development and function1–4. It is a potent vasodilator that is released during neurogenic inflammation and contributes to the pathology of migraine. A first-in-class drug targeting the CGRP receptor was recently approved for treatment of this condition, and many other therapeutics are under development aimed at reducing CGRP activity5. In contrast, CGRP is protective in models of inflammatory bowel disease, and hypertension, and is a critical neuropeptide for development and modulation of auditory responses1–4.
Receptor activity-modifying proteins (RAMPs), are essential accessory proteins for presentation of the class B calcitonin-like receptor (CLR) to the cell surface, and integral components of the phenotypically ascribed CGRP and adrenomedullin (AM) receptors, whereby CLR/RAMP1 engenders a selective response to CGRP, and CLR/RAMP2 or CLR/RAMP3, selective AM responses6. RAMPs are also partners for the calcitonin receptor (CTR), although not required for cell surface trafficking; they generate distinct amylin receptor (AMY) phenotypes1. Considerable cross talk between calcitonin-family peptides and receptors occurs, although current work has largely been restricted to how RAMPs impact cAMP signaling1. The three RAMPs each contain an ~100 amino acid, structured, N-terminal extracellular domain (ECD), a single TM domain and a short intracellular C-terminus. There is evidence that RAMPs co-evolved with GPCRs7; supporting this, we and others have shown that they can partner with numerous GPCRs, from all major subclasses, and are not exclusively partners for CLR and CTR8–11.
Existing structures of heteromeric complexes of the isolated ECDs of RAMPs and CLR bound to C-terminal peptide fragments12,13 have provided important but limited data on how RAMPs and CLR interact, and are unable to explain peptide selectivity. Thus, structures of full-length, active CGRP and AM receptor complexes are required.
Recent advances in cryo-electron microscopy (cryo-EM) have allowed full-length, class B GPCR, peptide agonist-bound structures to be elucidated in complex with their canonical Gs-protein heterotrimers14–16. These studies revealed class-specific, conserved, global conformational changes linked to receptor activation, and unexpected divergence in the modes of peptide binding, even within the same receptor14–18. In the current work, we have used Volta phase plate (VPP) cryo-EM to determine the structure of the human CGRP receptor complex, bound to its endogenous peptide agonist and canonical transducer at a global resolution of 3.3 Å. This structure provides novel insights into how RAMPs interact with GPCRs and modulate their activity.
Structure determination
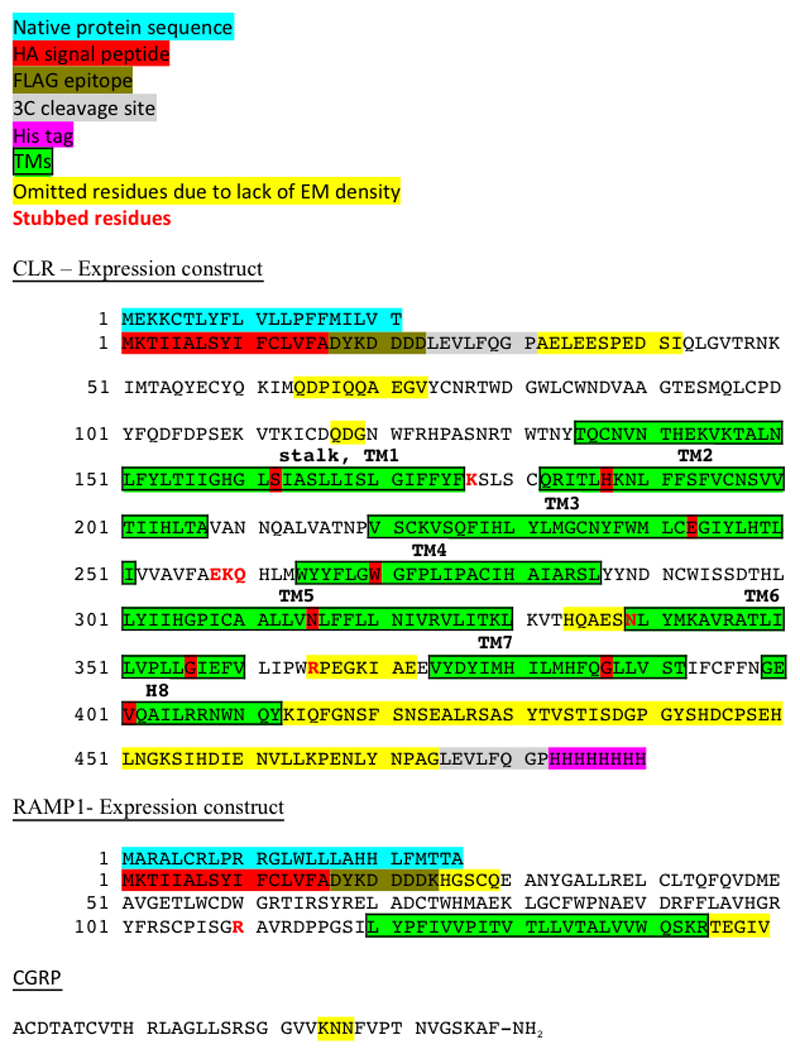
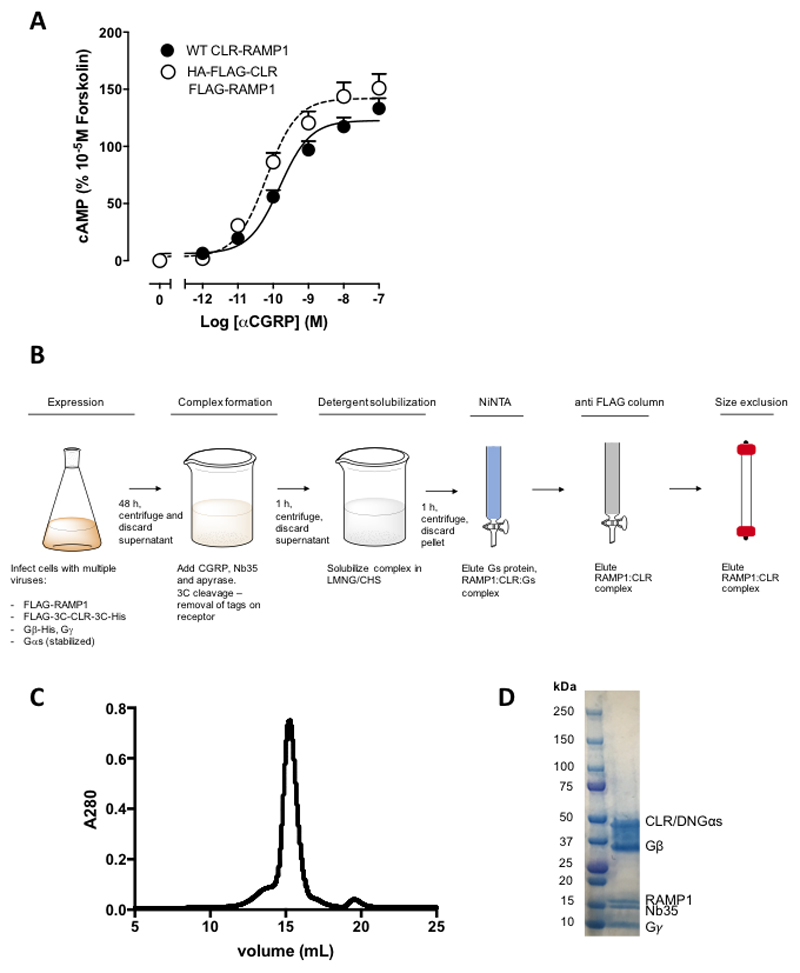
The CLR was modified to replace the native signal peptide with that of hemagglutinin (HA), and the addition of affinity tags bracketed by 3C cleavage sites at the N- and C-terminus (FLAG and His, respectively) (Ext. Data Figure 1). RAMP1 was modified with a HA signal peptide, followed by a FLAG epitope (Ext. Data Figure 1). These modifications did not alter receptor pharmacology (Ext. Data Figure 2A).
To form an active, G protein-coupled complex, CLR and RAMP1 were co-expressed with Gαs, His-Gβ1, and Gγ2 in Tni insect cells and stimulated with 10 μM CGRP. A stabilised Gαs15 was used together with camelid antibody Nb3514–16 enabling formation of a complex with improved stability19. The complex was treated with 3C enzyme to remove tags from CLR, solubilised in LMNG/cholesteryl hemisuccinate and then purified by sequential nickel and anti-FLAG columns, to ensure only RAMP1 bound complexes were present, and then further purified by SEC to yield a monodisperse complex that contained all components (Ext. Data Figure 2B, 2C).
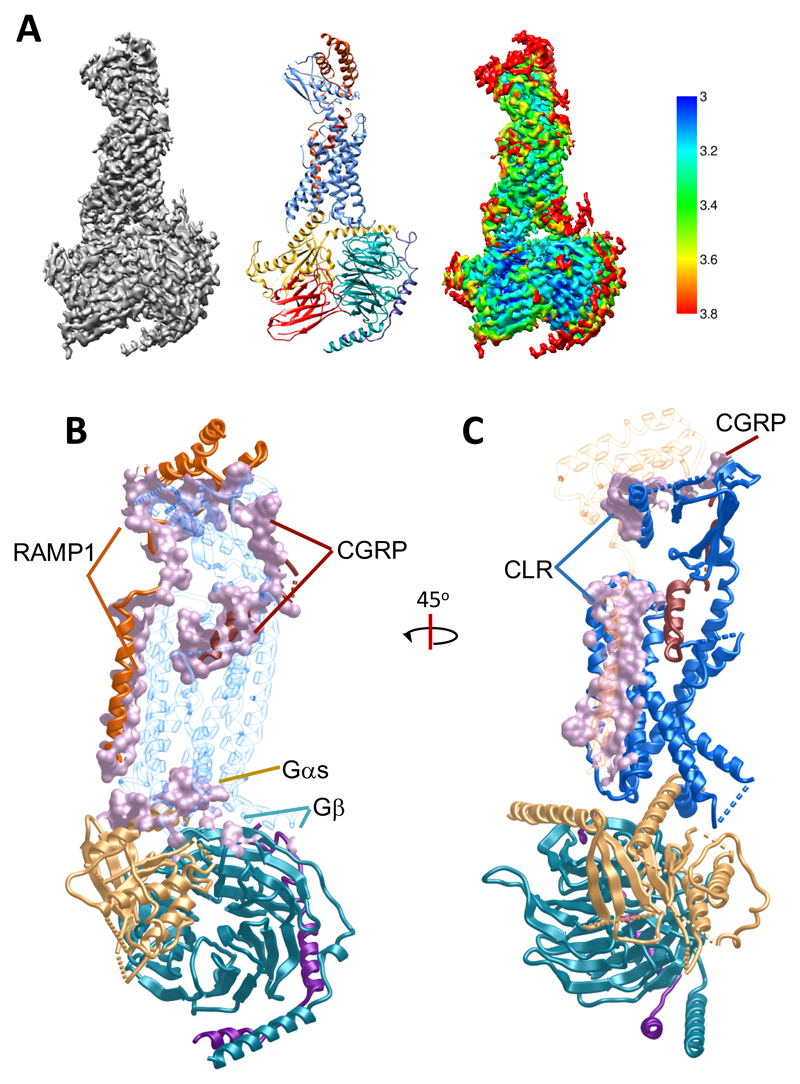
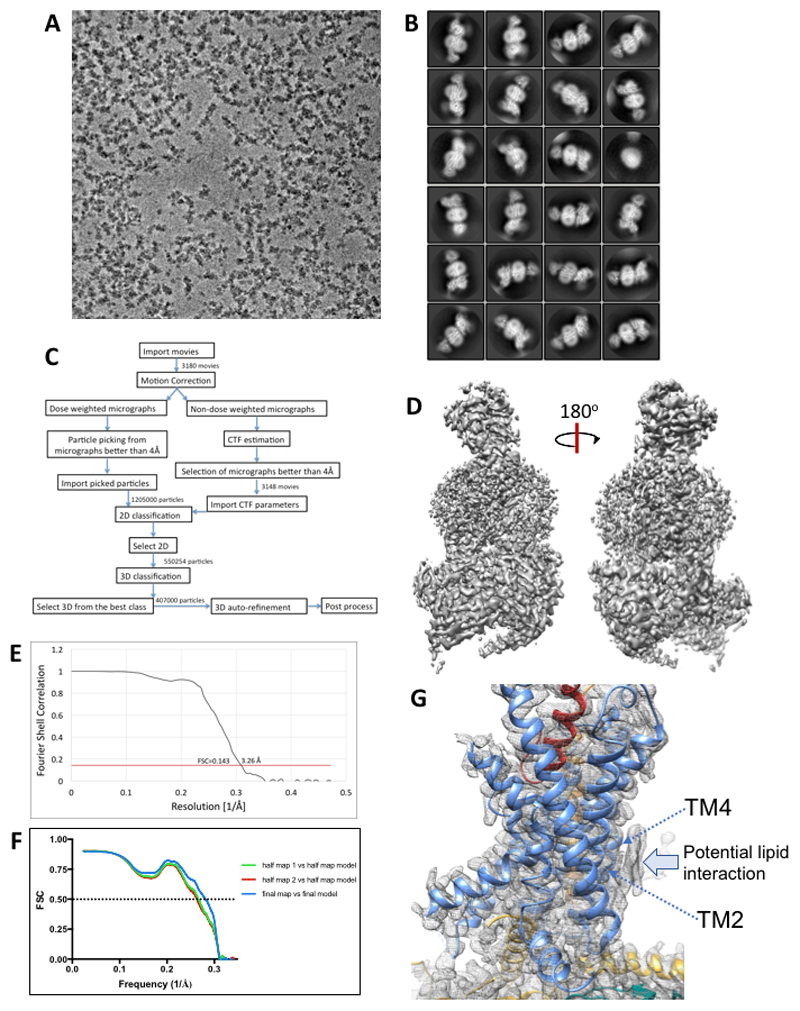
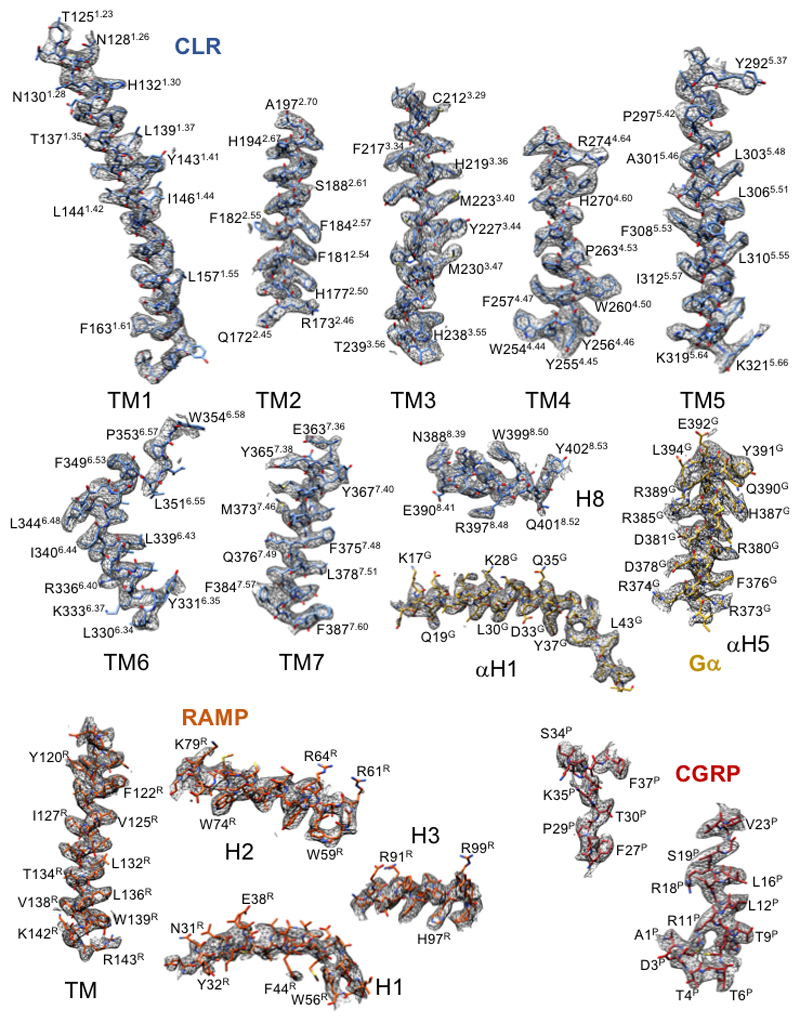
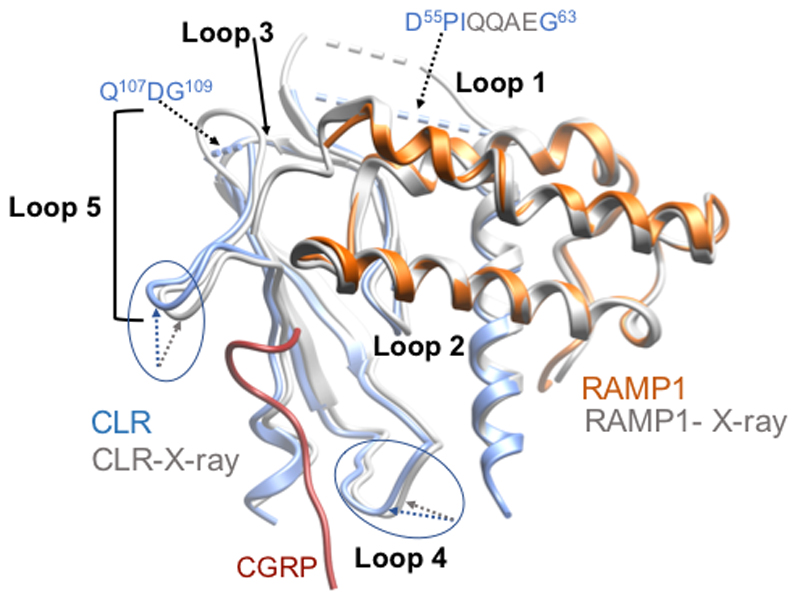
Vitrified complexes were imaged using a Titan Krios microscope equipped with a VPP20,21. Following imaging (Ext. Data Figure 3A) and initial 2D classification (Ext. Data Figure 3B), 3D classification yielded a final map at a resolution of 3.3 Å reconstructed from 407,000 particle projections (Figure 1A; Ext. Data Figures 3C-3E; Supp. Information Table 1). The cryo-EM density map exhibited well-resolved side chains, allowing confident rotamer placements for most amino acids within the peptide, receptor and RAMP TM domains and the G-protein (Ext. Data Figure 4). The RAMP and CLR ECDs had lower overall resolution, with discontinuous density for CLR ECD loop 1 and loop 5 (Figure 1A; Ext. Data Figure 1; Ext. Data Figure 5). Nonetheless, there was a strong correlation between the ECD EM density and the individual ECDs of either CLR or RAMP1 in deposited X-ray structure (PDB: 4RWG12). As such, these were rigid body fitted into the ECD density, with side chain adjustment where this was supported by density in the EM map. While individual ECDs from the X-ray structures had close approximation to the EM map, there were distinctions in the relative positioning of the CLR and RAMP1 ECDs in the two structures (Ext. Data Figure 5) that likely arise from anchoring constraints of the transmembrane domains (TMs) in the full-length structure. Continuous density was observed for the RAMP1 ECD and TM, including the unstructured linker domain, but not for the short C-terminal tail (T144REGIV148R (superscript R refers to residues within RAMP1)), indicating that this is mobile in the active receptor complex (Figure 1). There was robust density for most of the TM core and loops of CLR, excepting segments of ECL3 and ICL3 (Figure 1; Ext. Data Figure 4). Additional density was observed adjacent to the base of TMs 2 and 4 that may represent lipid interaction with CLR (Ext. Data Figure 3G). There was a relatively short helix 8 (H8), with no density for the CLR C-terminus beyond Y4028.53 (receptor residues in superscript are defined using the class B numbering system22,14), while the far N-terminus of the ECD was also lacking density (Figure 1; Ext. Data Figure 1), indicating that these regions are also mobile. The CGRP peptide N-terminus (A1P-V23P (P in superscript refers to peptide residues)) that binds within the receptor core, was well defined in the map, while the majority of side chains in the peptide C-terminus (F27P-F37P) that interact exclusively with receptor ECDs, were also supported by density (Ext. Data Figure 4). Similar to salmon calcitonin (sCT) in the Gs-coupled CTR14 (Figure 4), there is a large kink in the peptide to enable interaction across the two receptor domains, with the CGRP linker (K24P-N26P) poorly resolved in the map. Within the receptor core, side chains that had limited density were stubbed in the model (Ext. Data Figure 1). There was well resolved density for the G-protein heterotrimer across the receptor interface and between subunits. The α-helical domain of the α-subunit was only present in a small number of the 2D class averages and was masked out during map refinement. In general, the regions of lower resolution or lacking density were segments of the complex that exhibited higher mobility in MD simulations of the full complex (Ext. Data Figure 6, Supp. Information Videos 1, 2).
Figure 1. The CGRP–CLR–RAMP1–Gs cryo-EM structure reveals molecular details of the RAMP-receptor interface.
A, Left, 3.3 Å cryo-EM density map of the CGRP–CLR–RAMP1–Gs complex; the detergent micelle has been masked out for clarity. Middle, structure in ribbon representation after refinement in the cryo-EM map; CGRP, dark red; CLR, blue; RAMP1, dark orange; Gαs-Ras domain, gold; Gβ-subunit, cyan; Gγ-subunit, dark purple; Nb35, red. Right, cryo-EM density map coloured by local resolution (Å). B-C, CGRP receptor complex (ribbon representation coloured according to A), illustrating the extent of CLR interactions with other proteins in the complex (B), or the extent of RAMP1 interactions with other proteins in the complex (C), shown in mauve coloured surface representation. CGRP and RAMP1 form extensive contacts with CLR, with 61.5% and 23% of their surface buried, respectively.
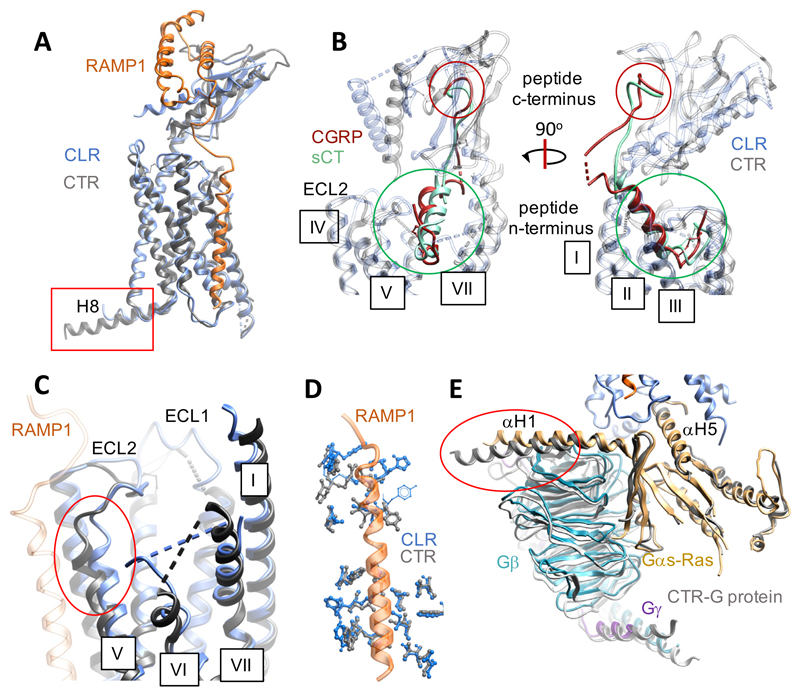
Figure 4. The CTR and CGRP receptor complexes display similar backbone conformations but have distinct conformations of the Gαs-Ras domain.
A, Alignment of the CLR (blue ribbon)-RAMP1 (dark orange ribbon) and CTR (grey ribbon) structures; for the CTR the ECD is from the x-ray structure of the sCT-CTR x-ray structure (PDB: 5II039), following rigid body fitting to the CTR EM map14. B, Zoom-in of the peptide binding sites; CGRP (dark red) and sCT (green) are shown as ribbon, CLR (blue) and CTR (grey) are shown as transparent ribbon. The circles highlight the similarities in position of the peptide N- (green) and C- (red) termini. RAMP1 has been omitted for clarity. C, Zoom-in illustrating distinctions in the upper segment of TM5 (red circle). D, Overlap in RAMP1 contact residues between CLR (blue x-stick) and CTR (grey x-stick). E, The Gαs-Ras-H5 is superimposed in the two structures, but the α-H1 helix is in a different orientation (red circle) and leads to distinctions in positioning of the Gβ and Gγ subunits. The CTR G protein is shown as grey ribbon, the CGRP receptor G protein as coloured ribbon; Gαs-Ras (gold), Gβ (cyan), Gγ (dark purple). Regions of the receptor structures that are missing in the PDB files are shown as dashed lines.
The RAMP1 CLR interface
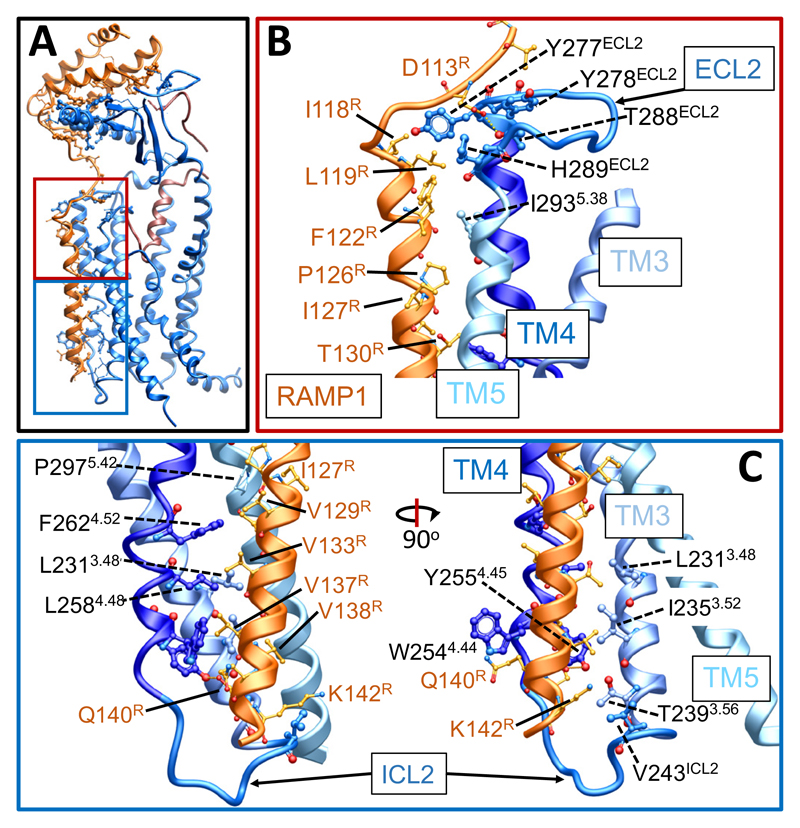
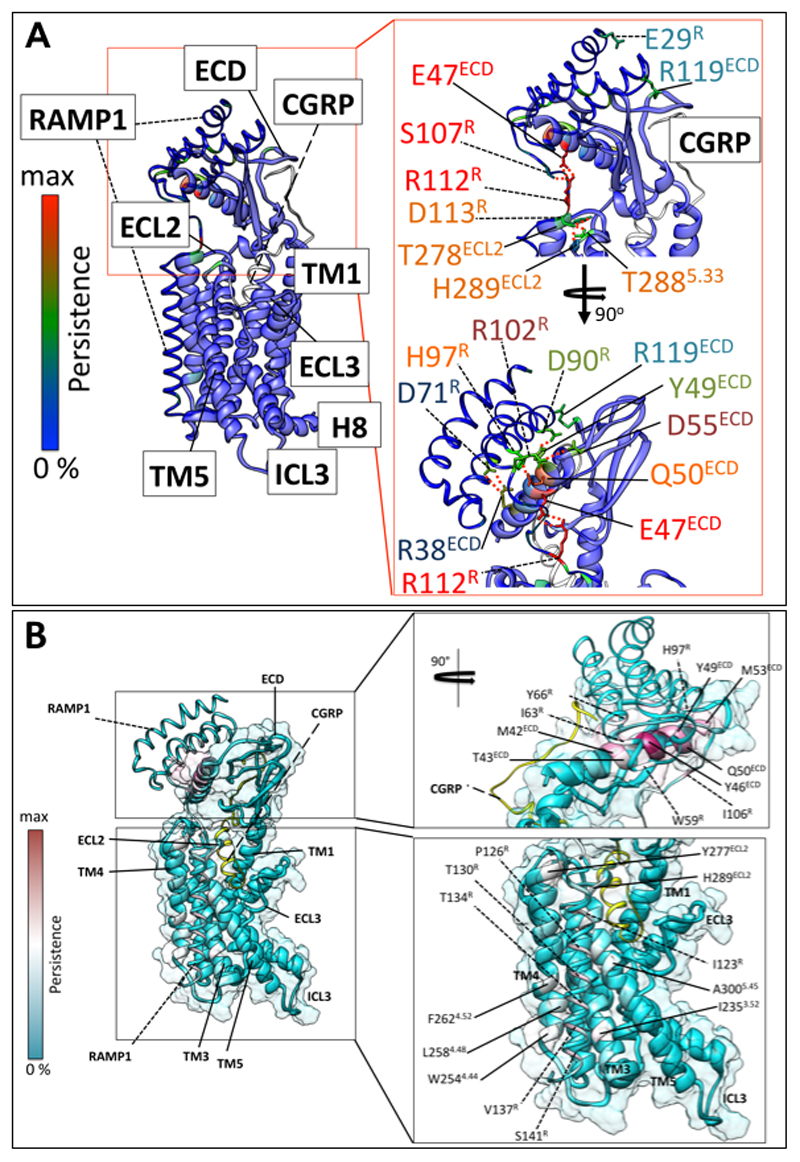
The 2D class averages reveal that there is a single predominant orientation of the ECDs of the complex, relative to the CLR/RAMP core (Ext. Data Figure 3B). This contrasts to the variability in ECD orientation observed for the CTR14. RAMP1 makes extensive contacts with CLR with ~23% of its surface buried within this interface (Figure 1B, 1C). The extensive interface across the ECDs has been previously reported in X-ray crystal structures12,23. In contrast to predictions in published models of RAMPs with either CLR or CTR24–27, the RAMP1 TM sits at an interface formed by CLR TMs 3, 4 and 5, with interactions of the upper half principally with TM5 (T2885.33/ECL2, H2895.34/ECL2, I2935.38) (Figure 2A, 2B) and at the base with TM3 (L2313.48, I2353.52, T2393.56, V243ICL2) and TM4 (W2544.44, Y2554.45, L2584.48, F2624.52) (Figure 2A, 2C). These interactions were primarily van der Waals interactions, although there was potential for H-bond formation between Y2554.45 and S141R. D113R in the membrane proximal segment of RAMP1 formed H-bonds with ECL2 residues proximal to CLR TM4 (Y278ECL2), and TM5 (T2885.33, H2895.34) (Figure 2B). Alanine mutagenesis studies of CLR residues28–33 revealed decreased CGRP potency for the Y278ECL2, T2885.33/ECL2 and W2544.44 mutants with no impact on H2895.34/ECL2, I2935.38, T2393.56, V243ICL2 and Y2554.45 mutants32,33, consistent with important but weak interactions between RAMP1 and CLR. Likewise, there was a small decrease in CGRP potency with D113RA mutation indicating an indirect impact on CGRP peptide binding34. To understand the dynamics of the RAMP1/CLR interface we performed MD simulations, following modelling of missing amino acids and side chains into the full protein complex (Ext. Data Figure 7A, 7B; Supp. Information Table 2; Supp. Information Video 1); these confirmed the importance of interactions between D113R and CLR ECL2 (Ext. Data Figure 7A). The simulations also predicted that E47ECD formed persistent H-bond interactions with R112R, in addition to H-bonds to the backbone of G108R and Ala110R in the linker region. R112R was also predicted to form less frequent H-bonds with D90ECD but may maintain more persistent ionic interactions; collectively these interactions likely contribute to the limited mobility of the RAMP1 linker and stable positioning of the ECDs relative to the receptor core (Ext. Data Figure 7A; Supp. Information Table 2; Supp. Information Videos 2, 3). From the EM map, there were no resolved interactions between the RAMP and G-protein, however, there was no density for the RAMP1 C-tail. In MD simulations where the RAMP1 C-terminus was modelled transient interactions with ICL2, and the αN-helix of the Gα-protein were predicted, with potential interactions that could extend to ICL1 (Supp. Information Table 2). Nonetheless, this segment was highly mobile in the simulations.
Figure 2. RAMP1 forms stable interactions with the CLR core and ECD.
A, The CGRP-CLR-RAMP1 complex, with the interacting residues depicted in x-stick representation, with the backbone shown in ribbon representation. CGRP, dark red; CLR, blue; RAMP1, dark orange. Regions amplified in B (red) and C (blue) are boxed. B, RAMP1 interacts with ECL2 and the top of TM5 towards the extracellular face of the receptor. C, RAMP1 interacts with TM3 and TM4 towards the intracellular face of the receptor; interacting side chains are depicted in x-stick representation and the backbone in ribbon.
The CGRP binding site
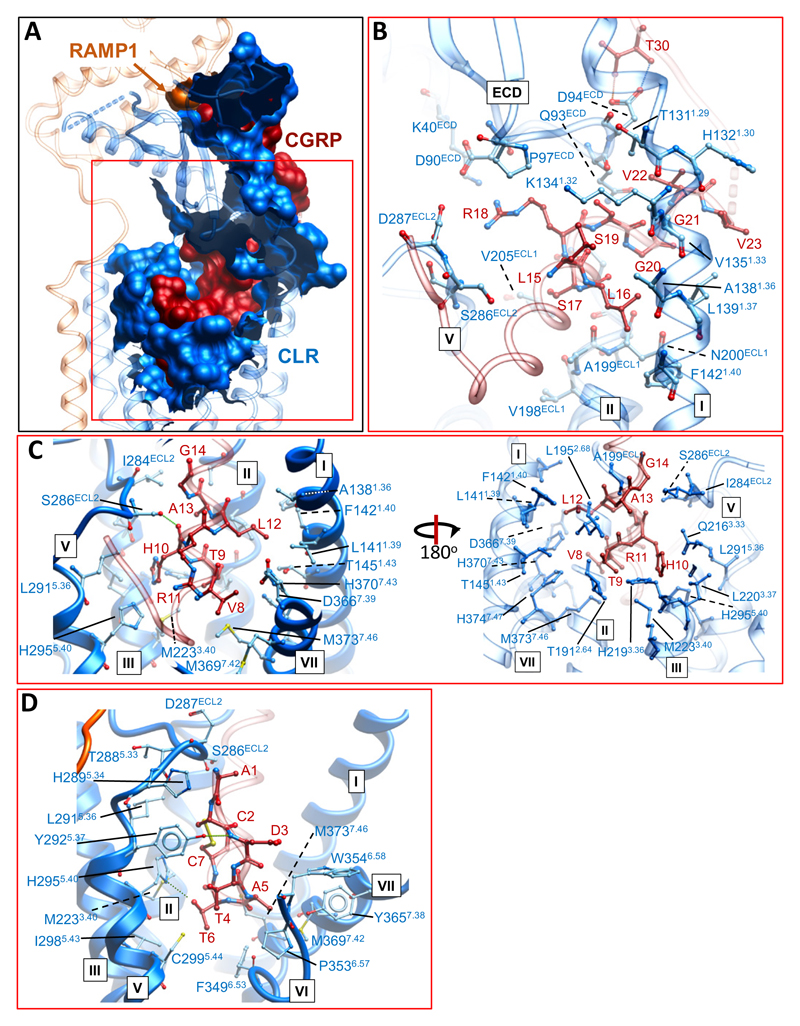
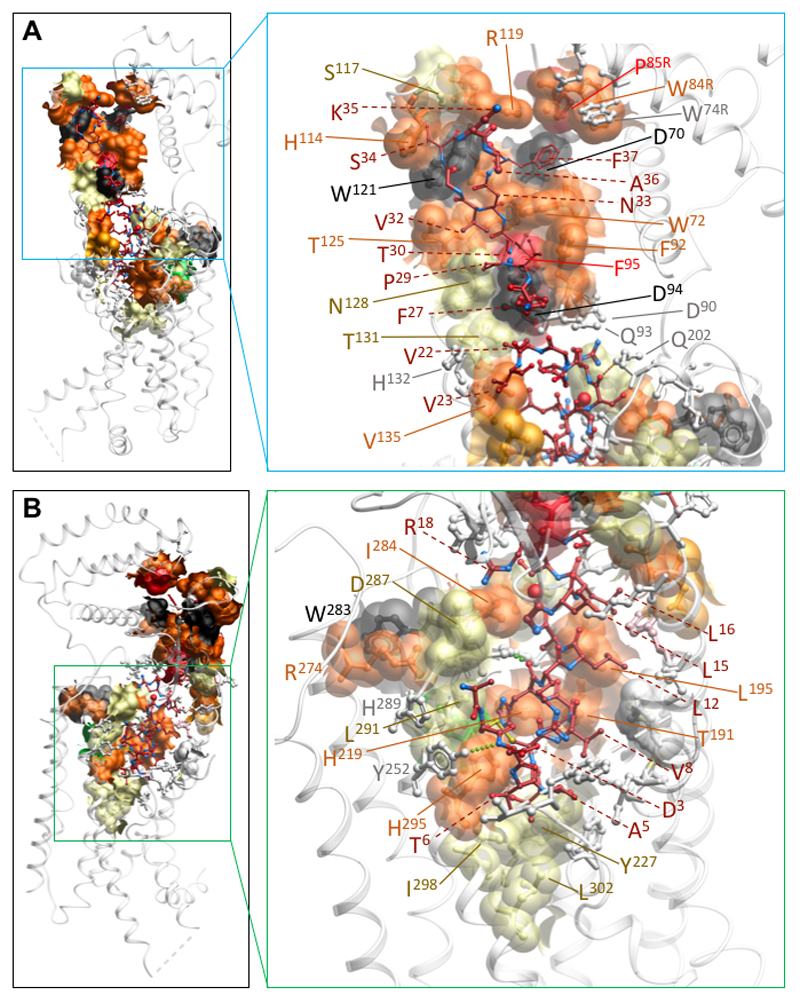
The CGRP peptide forms extensive interactions with the CLR/RAMP1 complex, with 61.5% of its surface buried. Intriguingly, the only direct contact between the peptide and RAMP1 occurs at the far C-terminus of the peptide, principally with the cluster of RAMP residues (F83R-P85R) that have been previously observed in isolated ECD structures12 (Figure 3A). The N-terminal peptide loop that is constrained by C2P-C7P is deeply buried, extending into an amphipathic α-helix, until V23P, that forms extensive van der Waal interactions (Figure 3D). There are only limited H-bonds in the static structure between the peptide N-terminus and the CLR core; these include interactions between Y2925.37 and the backbone of D3P, between H2955.40 and T6P, and S286ECL2 and the backbone of H10P (Figure 3C, 3D). Of these, only the interaction between H2955.40 and T6P is functionally important, with H2955.40A reported to cause ~30-fold loss of CGRP potency in cAMP accumulation28. This amino acid is equivalent to H3025.40 of the CTR that is predicted to form a H-bond with T6P of sCT14. Alanine substitution of CGRP T6P leads to ~80-fold loss of peptide potency29, confirming the importance of this bond and other interactions. There are extensive interactions between the peptide and TM3, TM5 and ECL2 of CLR. Below H2955.40, a series of amino acids that include I2985.43, L3025.47, M2233.40 and Y2273.44 form the bottom of the peptide binding pocket (Figure 3C, 3D; Ext. Data Figure 8B). Alanine substitution of T4P leads to over 20-fold reduction in CGRP potency29, however, it forms only limited interactions with the receptor. For this amino acid, side-chain to backbone interactions within the peptide that contribute to the loop fold and initiation of the peptide helix may underlie its functional importance. T9P and H10P pack within an extended cluster of residues that include T1912.64, L1952.68, H2193.36, S286ECL2, and I284ECL2 (Figure 3C; Ext. Data Figure 8B). With the exception of S286ECL2, alanine mutation of these residues caused marked impairment in CGRP signalling28,30–32 (Ext. Data Figure 8B), with I284ECL2 and L1952.68 forming a hydrophobic barrier that coincides with the exit of the peptide from the receptor core (Ext. Data Figure 8B); MD simulations predict transient H-bond formation between T9P and H2193.36 (Ext. Data Figure 9E; Supp. Information Table 3). Alanine substitution of T9P causes a 15-fold loss of CGRP potency29, consistent with the importance of interaction of this side chain. While mutations to amino acids in the distal segment of ECL2 (S286ECL2, D287ECL2, H289ECL2, L2915.36) had relatively limited effects on CGRP potency28 (Ext. Data Figure 8B), ECL2 conformation is critical to CGRP activation of its receptor, with R2744.64 and, in particular, W283ECL2 mutation to alanine highly detrimental to CGRP signaling32 (Ext. Data Figure 8B). These amino acids are critical to the stable packing of ECL2 in the active structure, similar to those observed in other active, class B GPCR structures14–16. There are only limited contacts between ECL1 and the peptide, the most prevalent being between L16P, S17P and A199ECL1, N200ECL1, Q202ECL1 and V205ECL1 (Figure 3B; Ext. Data Figure 8B). Q202ECL1 is within weak H-bond distance of the backbone oxygen of S17P (Ext. Data Figure 8B), however, alanine mutation of Q202ECL1, N200ECL1 or V205ECL1 had no impact on CGRP peptide potency, indicating limited importance of this domain for CGRP activity30. CLR and CTR have shorter ECL1 loops compared to the related glucagon (GCGR)35, or glucagon-related peptide 1 receptor (GLP-1R)15,16. These receptors have longer TM2 and TM3 helices (Ext. Data Figure 10A, 10B) that interact with the extended helix of peptide agonists of these receptors15,16,35. In the EM map, there was no high-resolution density for ECL3 consistent with only limited interaction between CGRP and this receptor segment. This high mobility and lack of persistent interactions was also observed in our MD simulations (Ext. Data Figure 9A-F); Supp. Information Table 3; Supp. Information Video 2), while previously published alanine mutagenesis provides additional support for the limited role of this domain in CGRP-mediated cAMP production28,30 (Ext. Data Figure 8B).
Figure 3. The CGRP binding site.
A, The CGRP interaction surface (amino acids within 5 Å) of CLR (blue) or RAMP1 (dark orange), illustrating how the peptide N-terminus is buried within CLR. CGRP is shown in dark red surface representation. B-D, amino acid side chains of CLR proximal to CGRP residues; amino acids are shown in x-stick with carbons in blue (CLR) or dark red (CGRP), and other atoms coloured by type. B, CGRP L15P-V23P contact residues; T30P that forms two H-bonds with CLR D94ECD is also illustrated. C, CGRP V8P-G14P contact residues. D, CGRP A1P-C7P contact residues. There are very few H-bonds formed between the peptide N-terminus and CLR in the static structure.
V8P, L12P and L16P lie on the same face of the peptide α-helix and sit deep within a groove formed by TMs 1 and 7, where they pack among multiple receptor residues. Alanine mutation of individual receptor amino acids within this groove have very little impact on CGRP-mediated cAMP production (Ext. Data Figure 8B), consistent with only weak contacts for individual amino acids. Nonetheless, alanine substitution of either L12P or L16P markedly impaired CGRP potency36, indicating that the packing of the hydrophobic face of the peptide helix is critical for receptor activation.
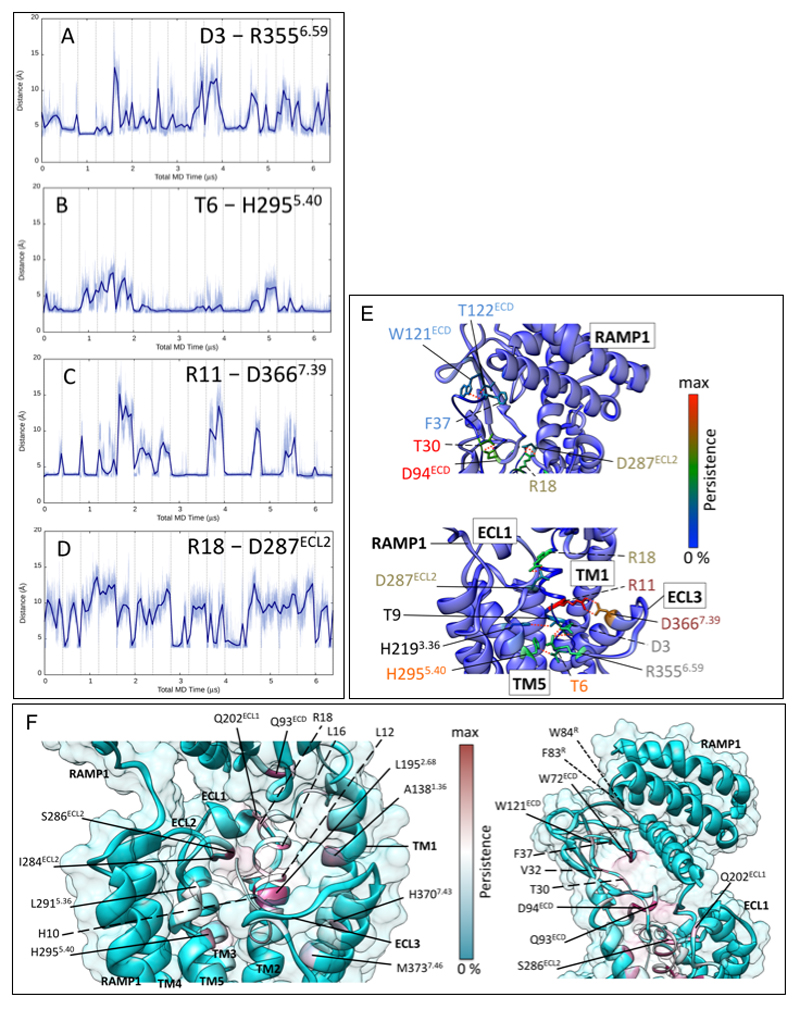
In the EM structure, R11P forms polar interactions with the backbone of peptide residues T4P and C2P, with potential salt-bridge interactions with D3P and D3667.39 of the receptor, and may contribute to stability of the peptide loop conformation (Figure 3C). In MD simulations, R11P formed persistent H-bonds with D3667.39, though such interactions are not observed in the EM map. R18P is within salt-bridge distance to D287ECL2, and D90ECD, and forms a H-bond with D287ECL2 in nearly 25% of frames in the MD simulation (Figure 3B, Ext Data Figure 9D, 9E).
The resolution of the peptide C-terminus and receptor ECDs are lower than in the receptor core, and they were primarily modelled via rigid body fitting of the available x-ray structure (PDB: 4RWG12). To test the stability of interactions in the fully active structure, 6.4 μs MD simulations were run. Our data are consistent with the interactions previously reported in the isolated ECD structure12, and are summarised in Ext. Data Figure 9A-9F, and Supp. Information Table 3. The main intermolecular interactions involved T30P - D94ECD (Figure 3B, Ext. Data Figure 9E), and F37P (amide terminus) - T122ECD (backbone atoms) (Ext. Data Figure 9E). There were no persistent hydrogen bonds between CGRP and RAMP1. The critical importance of interactions between the C-terminus of CGRP (F27P-F37P) and the CLR and RAMP1 ECDs for CGRP signaling has been highlighted by previous mutagenesis studies12,23,34,37,38, and are illustrated in Ext. Data Figure 8A. The extent to which this is dependent upon the stability of the relative positioning of the ECD to the receptor core is unclear, but RAMP1 is a major contributor to the limited conformational flexibility of the CLR ECD domain (Supp. Information Video 3).
Comparisons with the CTR structure
CTR is most closely related to CLR, and both can interact with RAMP1 to form a high affinity CGRP receptor1. As such, we compared our previously published structure of the sCT:CTR:Gs complex to the CGRP receptor complex. Due to the relatively limited resolution in density for the peptide binding domain and N-terminus of the CTR, comparisons were limited to the backbone structures in these regions. Overall, there was a high degree of similarity between the CLR and CTR structures, both exhibiting an extended TM1 α-helical stalk that interconnects the receptor core and ECD, and a similar organization of the upper segments of TM6 and TM7, to accommodate the bulk of the cysteine-bridged loops of the peptides (Figure 4A).
The largest difference was in the orientation of the ECD relative to the receptor core (Figure 4A, 4B). Intriguingly, this located the C-terminus of the peptides at virtually equivalent positions, with the N-terminal activation domain of the peptides also occupying a similar binding cavity (Figure 4B). Within the receptor core, there was an inward movement at the apex of TM5 of the CLR relative to CTR by ~2 Å, that is likely a product of the RAMP1 interaction with this domain (Figure 4C). There was a high degree of sequence conservation between CLR and CTR for the residues that contacted the RAMP (Figure 4D), which may explain the similar broad specificity for RAMP interaction of these receptors. We previously reported that, in simulations of the CTR bound to human CT (hCT) versus sCT, there was destabilization of ECL2 for hCT relative to the sCT bound receptor that was indicative of a role for conformational dynamics of this receptor domain in ligand interaction and efficacy18. The interactions of RAMP1 with ECL2 may therefore contribute to peptide selectivity and/or efficacy.
At the base of the receptor, the structured H8 of CLR was much shorter than that of CTR (Figure 4A), and consequently has more limited interaction with the Gβ subunit. Nonetheless, truncation studies of the CTR C-terminus indicated that only the segment that is also present in the CGRP receptor structure was functionally important for Gs mediated signaling14. Perhaps more relevant, although the Gs-Ras α–H5 is aligned between the two structures, there are differences in the G-protein, particularly with respect to the positioning of the Gs-Ras α-N helix, which are propagated across the β- and γ- subunits (Figure 4E).
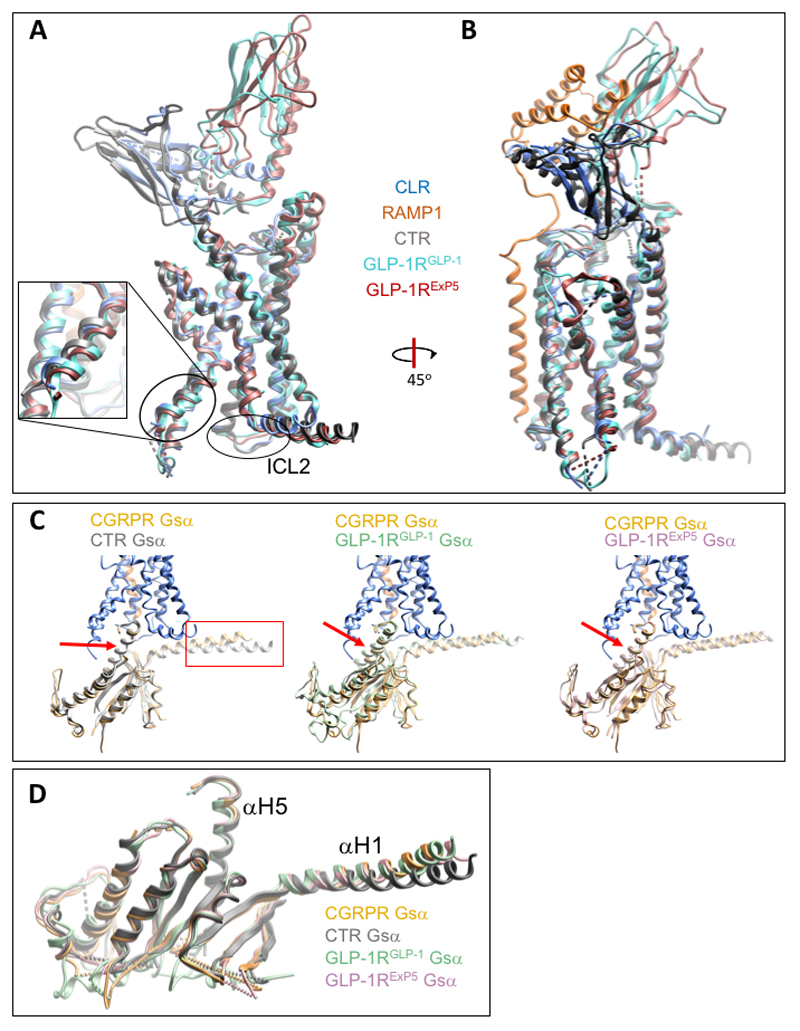
Broader comparison of Gs-protein interactions to include the structures of the glucagon-like peptide-1 receptor (GLP-1R) bound to either exendin-P5 (ExP5)15 or GLP-116 (Ext. Data Figure 10A, 10B), also revealed differences in the relative positioning of the Gs-protein, however, this was principally due to translational differences in the engagement of the receptors and the α-H5 (Ext. Data Figure 10C), with strong overlap in the backbone of the Gα subunit when these are aligned (Ext. Data Figure 10D). ICL2 of CLR and CTR are longer than their GLP-1R counter parts, and there is an ~2 Å greater outward movement of the base of TM6 of CLR and CTR compared to the GLP-1R (Ext. Data Figure 10A); these dissimilarities likely account for the translational differences in engagement of the Gs-protein by GLP-1R.
Stability of the complex in the absence of RAMP1
In MD simulations of the complex in the presence and absence of RAMP1, the orientation of the CLR ECD remains relatively stable during CLR-CGRP-RAMP1-Gαβγ-Nb35 (6.4 μs), and CLR-CGRP-RAMP1-miniGα (2 μs) MD simulations, but not during CLR-CGRP-miniGα (2 μs) MD simulations (Supp. Information Videos 1-3). In the absence of RAMP1, only CGRP and TM1, with its extension, hold the ECD in place relative to the TM domain. The N-terminal region (A1P – R18P) of CGRP is stable (Supp. Information Video 2), even in the absence of RAMP1, but the C-terminal region is affected by the mobility of the CLR ECD and is much more mobile in the absence of RAMP1 (Ext. Data Figure 6; Supp. Information Video 3). A consequence of this C-terminal mobility in the absence of RAMP1 is reduced persistence of H-bonds formed by CGRP in this region (Supp. Information Table 4).
RAMP1 provides additional stability to ECL2, a major contact point for CGRP, even though this loop is relatively stable even in the absence of RAMP1. In the MD in the absence of RAMP1, there is a marked reduction in the persistence of H-bonds between R2744.64 and D280ECL2 (Supp. Information Table 5). In the cryo-EM structure, these two residues can form a salt-bridge interaction, and this interaction in the presence of RAMP1 is likely to impact on signal propagation. Indeed, mutagenesis of either of these residues greatly impacts CGRP mediated cAMP signalling28,32. RAMP1 interaction does not impact the mobility of distally located ECL1 and ICL3. The least mobile points of each TM generally correspond to point of helix intersection; for TM3 this is in the vicinity of Y2273.44, which provides a deep stable contact point for CGRP.
It is important to note that, while these simulations provide insight into the contribution of RAMP1 to the preformed active complex, this complex does not form in the absence of RAMP, even where CLR is present at the cell surface6, indicating that the CLR/RAMP1 interaction is also critical for initial peptide binding and presentation to the receptor core.
In conclusion, the CGRP-CLR-RAMP1-Gs complex provides unique insight into the organisation of functionally important heteromeric GPCR complexes. The RAMP1 causes marked stabilisation of the CLR ECD, and thus plays a critical role in ligand presentation to the receptor core. It further enhances stability of the TM domain interface and ECL2 that are important for propagation of peptide-induced signalling. This study provides a framework for the development of novel therapeutics that target the CGRP system.
Methods
Constructs
CLR was modified to include an N-terminal Flag tag epitope and a C-terminal 8xhistidine tag, both tags are removable by 3C protease cleavage. The construct was generated in both mammalian and insect cell expression vectors. RAMP1 was modified to include an N-terminal Flag tag epitope. For both constructs, the natural signal peptide was replaced with that of hemagglutinin to improve expression (Ext. Data Figure 1).
Insect cell expression
CLR, RAMP1, DNGαs15, His6-tagged human Gβ1and Gγ2were expressed in Tni insect cells (Expression systems) using baculovirus. Cell cultures were grown in ESF 921 serum-free media (Expression Systems) to a density of 4 million cells per ml and then infected with three separate baculoviruses at a ratio of 1:5:2:1 for CLR, RAMP1, DNGαs and Gβ1γ2. Culture was harvested by centrifugation 48 h post infection and cell pellet was stored at -80 °C.
Complex purification
Cell pellet was thawed in 20 mM HEPES pH 7.4, 50 mM NaCl, 2 mM MgCl2 supplemented with cOmplete Protease Inhibitor Cocktail tablets (Roche). Complex formation was initiated by addition of 10 μM human αCGRP (Chinapeptide), Nb35–His (10 μg/mL), 3C protease (10 μg/mL) and Apyrase (25 mU/mL, NEB); the suspension was incubated for 1 h at room temperature. Membranes were collected by centrifugation at 30,000g for 30 min. Complexes from membranes were solubilized by 0.5% (w/v) lauryl maltose neopentyl glycol (LMNG, Anatrace) supplemented with 0.03% (w/v) cholesteryl hemisuccinate (CHS, Anatrace) for 2 h at 4 °C in the presence of 1 μM CGRP and apyrase (25 mU/mL, NEB). Insoluble material was removed by centrifugation at 30,000g for 30 min and the solubilized complex was immobilized by batch binding to NiNTA resin. The resin was packed into a glass column and washed with 20 column volumes of 20mM HEPES pH 7.4, 100 mM NaCl, 2 mM MgCl2, 0.01% (w/v) LMNG and 0.006% (w/v) CHS, 1μM CGRP, before bound material was eluted in buffer containing 250 mM imidazole. The NiNTA purified fraction was immobilized by batch binding to M1 anti-FLAG affinity resin in the presence of 3 mM CaCl2. The resin was packed into a glass column and washed with 20 column volumes of 20 mM HEPES pH 7.4, 100 mM NaCl, 2 mM MgCl2, 3 mM CaCl2, 1 μM CGRP, 0.01% (w/v) LMNG and 0.006% (w/v) CHS before bound material was eluted in buffer containing 5 mM EGTA and 0.1 mg/mL FLAG peptide. The complex was then concentrated using an Amicon Ultra Centrifugal Filter (MWCO 100 kDa) and subjected to size-exclusion chromatography on a Superose 6 Increase 10/300 column (GE Healthcare) that was pre-equilibrated with 20 mM HEPES pH 7.4, 100 mM NaCl, 2 mM MgCl2, 1 μM CGRP, 0.01% (w/v) LMNG and 0.006% (w/v) CHS. Eluted fractions consisting of receptor and G-protein complex were pooled and concentrated. Final yield of purified complex was approximately 0.3 mg per liter of insect cell culture.
SDS–PAGE and western blot analysis
Sample collected from size-exclusion chromatography was analyzed by SDS–PAGE and Western blot as previously described15. For SDS–PAGE, precast gradient TGX gels (Bio-Rad) were used. The final SEC elution peak was stained by Instant Blue (Expedeon).
Modelling into EM density
An initial template for CLR was generated by homology modelling on template cryo-EM structure of hCTR (PDB-5UZ7)14, performed with the Molsoft ICM modelling software40. Manual adjustment and rebuilding was performed in COOT41. Due to limited density in CLR and RAMP1 ECD regions, we used the high-resolution X-ray crystal structure (PDB-4RWG)12 for modelling. ECDs of CLR and RAMP1 were, separately, rigid body fitted into density prior to the final iteration of global refinement. DNGαs, Gβ1, Gγ2 and Nb35 models were taken from the GLP1R-Gs-ExP5 structure (PDB-6B3J)15. The CGRP peptide and RAMP1 TM were modeled manually. The final model was subjected to global refinement and minimization in real space using the module ‘phenix.real_space_refine’ in PHENIX42. Validation was performed in MolProbity43.
Preparation of vitrified specimen
EM grids (Quantifoil, Großlöbichau, Germany, 200 mesh copper R1.2/1.3) were glow discharged for 30 s using Harrick plasma cleaner (Harrick, Ithaca, NY). 4 µl of sample was applied on the grid in the Vitrobot Mark IV chamber (Thermo Fisher Scientific, Waltham, MA). The chamber of Vitrobot was set to 100% humidity at 4 °C. The sample was blotted for 4.5 s with blot force of 20 and then plunged into propane-ethane mixture (37% ethane and 63% propane).
Data acquisition
Data set was collected on a Thermo Fisher Scientific Titan Krios microscope operated at 300 kV (FEI, Hillsboro, OR) equipped with a Gatan Quantum energy filter, a Gatan K2 summit direct electron camera (Gatan, Pleasanton, CA) and a Volta phase plate (Thermo Fisher Scientific). Movies were taken in EFTEM nanoprobe mode, with 50 µm C2 aperture, at a calibrated magnification of 47170 corresponding to a magnified pixel size of 1.06 Å. Each movie comprises 50 sub frames with a total dose of 50 e-/Å2, exposure time was 13 s with the dose rate of 4.8 e-/pix/s on the detector. Data acquisition was done using SerialEM software at -600 nm defocus44.
Data processing
3180 movies were collected and subjected for motion correction using MotionCor245. CTF estimation was done using Gctf software46 on non-dose-weighted micrographs. The particles were picked using Gautomatch (developed by Dr Kai Zhang, MRC Laboratory of Molecular Biology, Cambridge, UK, http://www.mrc-lmb.cam.ac.uk/kzhang/Gautomatch/). An initial model was made using the common-line approach in EMAN247 based on automatically picked few micrographs and using the common-line approach. The particles were extracted in RELION 2.01b148 using a box size of 200 pixels. 1,205,000 picked particles were subjected to 2D classification with 100 classes, followed by 3D classification. After selecting the best-looking class, with 407,000 particles, 3D auto-refinement was performed in RELION 2.01b1. The final map was sharpened with a B-factor of -50 Å2. The processing workflow is outlined in Ext. Data Figure 3C. Model overfitting was evaluated by randomly displacing all atoms by 0.5Å and refined against one cryo-EM half map. FSC curves were calculated between the resulting model and the half map used for refinement, the resulting model and the other half map for cross validation, and the final refined model and the full map (Ext. Data Figure 3F).
Mammalian cell cAMP assays
Cos7 cells, which were confirmed to be free from mycoplasma, were transfected in suspension in 96 well plates (10,000 cells/well) with 50ng CLR + 50ng human RAMP1 using 600ng PEI. The transfection was performed in 5% FBS DMEM, 200uL total volume per well and cells were incubated for 48 h at 37°C, 5% CO2. cAMP detection was performed as previously described49. All values were converted to cAMP concentration using a cAMP standard curve performed in parallel and data were subsequently normalized to the response of 100 μM forskolin.
Conformational clustering of CGRP ECL3 and the RAMP1
The missing loops throughout CLR were generated using PLOP50, which has been shown to be effective in generating GPCR loop conformations51. The missing side chains were iteratively optimized to convergence using PLOP. In addition, in order to enhance the conformational sampling of ECL3, which is likely to interact with the CGRP peptide, a preliminary clustering of 4000 different loop models generated using Modeller 9.1652 was performed by means of the Clustering VMD plugin (available at http://physiology.med.cornell.edu/faculty/hweinstein/vmdplugins/clustering/). Conformational clustering was based on the coordinates of side chains belonging to residues W3546.58, R3556.59, P356ECL3, E357ECL3, K359ECL3, I360ECL3, A361ECL3 and E362ECL3. A total of 10 clusters were generated with a Root Mean Standard Deviation (RMSD) cut off value of 3 Å and a representative structure with a low Distributed Optimized Potential Energy (DOPE) score from the four most populated ensembles was extracted and prepared for molecular dynamics simulations.
A similar approach was employed for clustering the modelled RAMP1 C-terminus (residues T144R, - V148R): the original PLOP generated conformation was combined with each of the 4 initially selected ECL3 conformations, while the highly distinct RAMP1 C-terminus orientation was arbitrarily combined with ECL3 conformation number 1.
Molecular dynamics (MD) simulations
A total of seven systems were prepared for MD simulations with the CHARMM36 force field53 (Supp. Information Table 6) using a multistep procedure that combines python htmd54 and tcl (Tool Command Language) scripts. Hydrogen atoms were first added by means of the pdb2pqr55 and propka56 software (considering a simulated pH of 7.0); the protonation of titratable side chains was checked by visual inspection. CLR and RAMP1 were embedded in a square 116 Å x 116 Å 1-palmitoyl-2-oleyl-sn-glycerol-3-phospho-choline (POPC) bilayer (previously built by using the VMD Membrane Builder plugin 1.1, at http://www.ks.uiuc.edu/Research/vmd/plugins/membrane/) through an insertion method57. More precisely, the opportune receptor orientation was obtained by superposing CLR coordinates on the CTR structure retrieved from the OPM database58. Lipids overlapping the receptor TMs bundle and the RAMP1 were removed and TIP3P water molecules59 were added to the simulation box (116 Å x 116 Å x 185 Å) by means of the VMD Solvate plugin 1.5 (Solvate Plugin, Version 1.5. at <http://www.ks.uiuc.edu/Research/vmd/plugins/solvate/). Overall charge neutrality was finally reached by adding Na+/Cl- counter ions (final ionic strength of 0.150 M), using the VMD Autoionize plugin 1.3 (Autoionize Plugin, Version 1.3. at <http://www.ks.uiuc.edu/Research/vmd/plugins/autoionize/).
In order to evaluate the influence exerted by RAMP1 on the CGRP-CLR complex, two simplified systems were embedded in a 96 Å x 96 Å POPC bilayers and solvated as described above: one was composed by CLR-CGRP-RAMP1 and the C-terminus (residues N371G - L394G) of the G-protein α subunit (CLR-CGRP-RAMP1-G-protein(α371-394), while the other system was formed by CLR-CGRP and the C-terminus of the G-protein α subunit (CLR-CGRP-G-protein(α371-394); the original PLOP generated conformations of CLR and RAMP1 were used.
Systems equilibration and MD settings
The MD engine ACEMD60 was employed for both the equilibration and productive simulations. Equilibration was achieved in isothermal-isobaric conditions (NPT) using the Berendsen barostat61 (target pressure 1 atm) and the Langevin thermostat62 (target temperature 300 K) with a low damping of 1 ps-1. A three-stage procedure was performed (integration time step of 2 fs): first, clashes between protein and lipid atoms were reduced through 2500 conjugate-gradient minimization steps, then a 2 ns long MD simulation was run with a positional constraint of 1 kcal mol-1 Å-2 on protein and lipid phosphorus atoms. During the second stage, 40 ns of MD simulation were performed constraining only the protein atoms, while in the last equilibration stage, positional constraints were applied only to the protein backbone alpha carbons, for a further 5 ns.
Supp. Information Table 6 summarizes all the simulations performed. Trajectories were computed with an integration time step of 4 fs in the canonical ensemble (NVT) at 300 K, using a thermostat damping of 0.1 ps-1 and the M-SHAKE algorithm63 to constrain the bond lengths involving hydrogen atoms. The cut off distance for electrostatic interactions was set at 9 Å, with a switching function applied beyond 7.5 Å. Long range Coulomb interactions were handled using the particle mesh Ewald summation method (PME)64 by setting the mesh spacing to 1.0 Å.
MD analysis
Atomic contacts, hydrogen bonds and Root Mean Square Fluctuation (RMSF) were computed using VMD65. A contact was considered productive if the distance between two atoms was lower than 3.5 Å. For hydrogen bond detection, a donor-acceptor distance of 3 Å and an angle value of 160° were set as geometrical cut-offs. The hydrogen bond persistence is defined as the number of frames in which the H-Bond is formed divided by the total number of frames times 100. The RAMP1 influence on van der Walls contacts and hydrogen bonds was evaluated by computing the numerical difference between the total numbers of contacts/hydrogen bonds between each CLR and CGRP side chain during the simulations in presence and absence of RAMP1.
Extended Data
Extended Data Figure 1. Amino acid sequences of the CGRP peptide, CLR and RAMP1 constructs use for determination of structure.
The sequences are annotated to denote the location of the HA signal sequence (red highlight), C3 cleavage sites (grey highlight), FLAG (dark olive-green highlight) and His tags (purple highlight). The substituted sequences of the native proteins are listed above the construct sequences and highlighted in blue. Transmembrane helical domains in CLR and RAMP1 are boxed and highlighted in green. Segments of the proteins that were not resolved in the EM map are highlighted in yellow. Amino acids for which backbone density was present but limited side chain density, were stubbed in the model; these are bolded in red in the sequences.
Extended Data Figure 2. CGRP receptor pharmacology and purification of the CGRP-CLR-RAMP1-Gs complex.
A; Pharmacology of untagged CLR-RAMP1 (WT CLR-RAMP1) and the purification construct (HA–FLAG-CLR, FLAG-RAMP1), in CGRP-mediated cAMP accumulation assays performed in transiently transfected Cos7 cells (N=5 separate experiments with triplicate repeats; mean + s.e.). B; Expression and purification strategy. C; Final size exclusion chromatography (SEC) elution profile of the complex. D; SDS–PAGE/Coomassie blue stain of the SEC peak, demonstrating presence of each of the components of the complex.
Extended Data Figure 3. Volta phase plate imaging of the CGRP–CLR–RAMP1-Gs heterotrimer complex.
A; Volta phase plate micrograph of the complex (representative of 3,180). High-contrast phase plate imaging facilitates robust particle selection despite low defocus and tight packing of particles. B; RELION 2D class averages. C; Workflow for map refinement. D; Final 3D EM map calculated in RELION after auto-refinement and map sharpening. E; ‘gold standard’ Fourier shell correlation (FSC) curve; the overall nominal resolution is 3.26 Å. F; Model overfitting was evaluated by randomly displacing all atoms by 0.5Å and refined against one cryo-EM half map. FSC curves were calculated between the resulting model and the half map used for refinement (green); the resulting model and the other half map for cross validation (red), and the final refined model and the full map (blue). G; Potential lipid interaction with the base of TM4 and TM2 of CLR.
Extended Data Figure 4. Atomic resolution model of the CGRP–CLR–RAMP1-Gs heterotrimer in the cryo-EM density map.
EM density map and model are shown for all seven transmembrane helices and H8 of the receptor, the CGRP peptide (excepting the K24PA25PN26P sequence that was not resolved in the map), the RAMP TM and each of the RAMP ECD helices; there was only limited side chain density for RAMP1 H1, with side chains modeled from rigid body fitting of the RAMP1 ECD in PDB: 4RWG12. Also illustrated are the N-terminal (αH1) and C-terminal (αH5) α-helices of the Gαs-Ras domain.
Extended Data Figure 5. Comparison of the backbone position of the ECD of CLR (blue ribbon) and RAMP1 (orange ribbon) from the modelled, active complex, and the structure of the isolated CLR-RAMP1 ECD complex solved by x-ray crystallography12 (light grey ribbon).
The structures were aligned on the RAMP1 ECD. The CLR loops (Loops 1 – 5) are annotated. The CLR loop1 and loop 5 sequences that were not resolved in the EM map are indicated by dotted black arrows. Differences in the backbone position of CLR loops 4 and 5 are indicated in blue (active complex) and grey (isolated ECD complex) dotted arrows. The location of the CGRP peptide is shown in dark red.
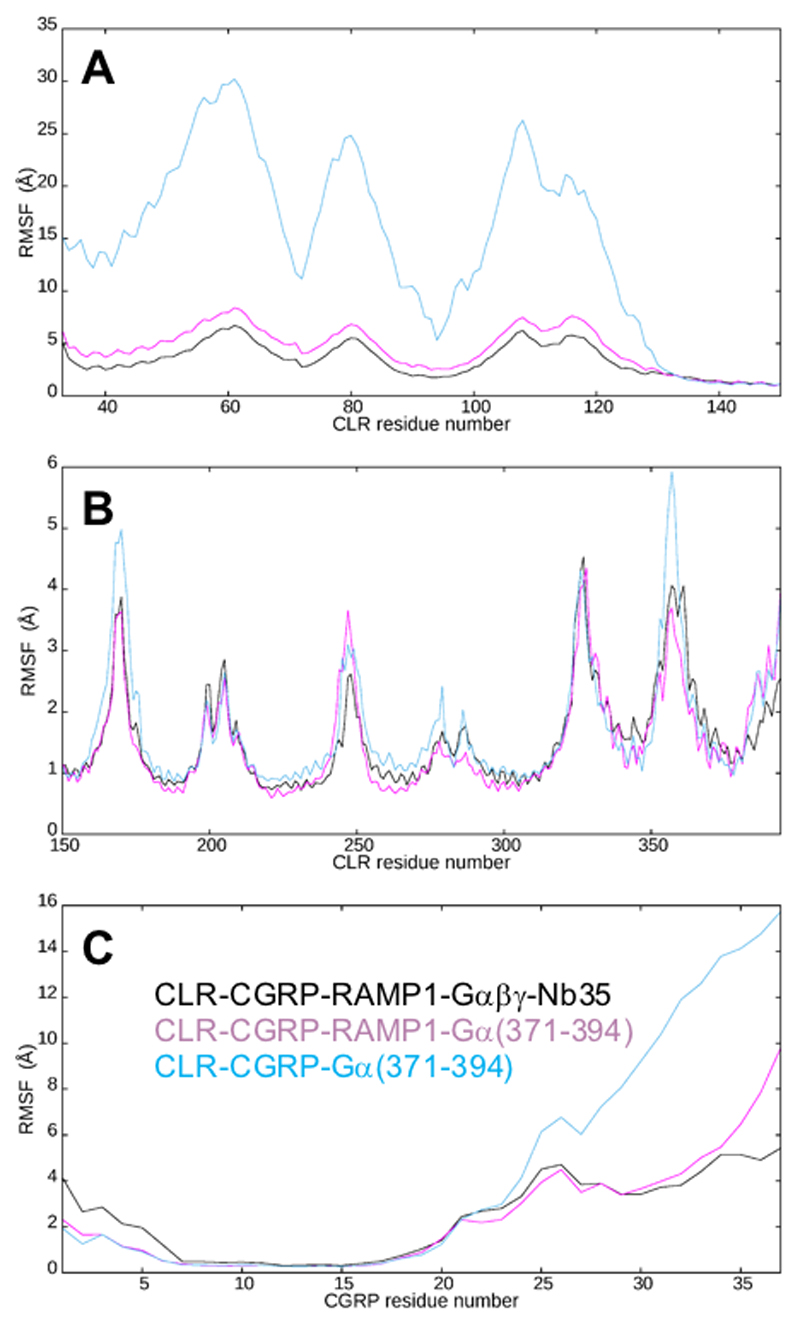
Extended Data Figure 6. Root mean square fluctuation (RMSF) for CGRP and CLR taken from the three simulations, namely CLR-CGRP-RAMP1-Gαβγ-Nb35 (black, 2.4 μs), CLR-CGRP-RAMP1-Gα(371-394) (purple, 2 μs) and CLR-CGRP-Gα(371-394) (blue, 2 μs).
A; The CLR ECD region. B; the CLR TM region. C; CGRP (superposed on Thr6-Ser17 and so valid for N-terminal half). In general, the missing segments in the EM density map correspond to regions of high RMSF and indeed the difficulty of fitting the ECD as a whole is linked to its high RMSF (A; Supp. Information Videos 2, 3). The ECD missing segments (D55ECD-V63ECD) and (Q107ECD-G109ECD) correspond to external loop regions furthest removed from the TM domain. Despite their polar nature they displayed no persistent interactions during the MD simulations; D55ECD-V63ECD displayed the largest backbone RMSF of 8Å, while Q107ECD-G109ECD displayed a similarly high RMSF of 7.5 Å. The next highest RMSF peaks around A79ECD-G81ECD and P115ECD-S117ECD are just a little lower but are nonetheless resolved (A). Within the TM domain, ICL3 (H324-S328) and ECL3 (P356-E362) both contain missing residues and have a high RMSF above 4.5 Å (B). This region displays no persistent interactions during the MD simulations, although CGRP does interact to the proximal (non-missing) region of ECL3. The high RMSF values for ICL1 (3.6 Å) and ICL2 (3.6 Å) give rise to stubbed residues (K1672.40) and E248ICL2-Q250ICL2) but the backbone is resolved. For CGRP, the peak in the RMSF around residue 26 (C) corresponds to the three highly mobile external residues (Lys24Asn25Asn26) in the outward-facing loop that do not interact with CLR (Ext. Data Figure 8); these residues could not be placed from the electron density. These three CGRP residues form a hinge, enabling changes in the orientation of the CLR ECD, especially in the absence of RAMP1; the higher RMSF values C-terminal to this are an artefact of the superposition strategy and the two-domain nature of CLR but their relative values still hold. The high mobility of some of the extracellular loops is visible in videos (Supp. Information Videos 1-3).
Extended Data Figure 7. RAMP1 makes extensive stable interactions with CLR.
A; Hydrogen bonds between RAMP1 and CLR during MD simulations (6.4 μs). The total persistency is plotted onto the experimental structure according to a rainbow colour scale, with residues never involved in dark blue and residue highly involved in red. The receptor is shown as a bulky ribbon, the RAMP1 as a thin coloured ribbon and the peptide as a thin white ribbon. Key side chains are shown, but for intermittent hydrogen bonds the rotameric state has been modified to show an interaction. Residues forming an interaction network are labelled with the same colour. Left, overall topology of the system. Right upper, zoom on the upper portion of the CLR TM domain and ECD; lower, view rotated by 90° on the z axis. H-bonds involving RAMP1-CLR residues R112R-E47ECD and D113R-T288ECL2/H289ECL2 are significant for linking the TM domain to the ECD and for stabilizing ECL2. Other H-bonds implicated in stabilizing the CLR and RAMP1 ECD interaction include S107R-E47ECD, R102R-D55ECD, H97R- Q50ECD, D90R-Y49ECD, D71R-R38ECD and E29R-R119ECD; quantitative data on the persistence of H-bonds during the simulations are reported in Supp. Information Table 2. B; Contacts between RAMP1 and CLR during MD simulations (6.4 μs). The total persistency of a residue side chain is plotted onto the experimental structure according to a cyan-maroon colour scale, with residues never involved in cyan and residue highly involved in maroon. The peptide (italics, dashed line) is depicted as a thin ribbon, while the receptor (solid line) is shown as a bulky ribbon and transparent surface. Left, overall topology of the system. Upper right, the most persistent interactions involving RAMP residues and the CLR ECD, W59R, I63R, Y66R, H97R and I106R help to anchor αH3 and the C-terminal RAMP1 regions of αH2 to (residues M42ECD, T43ECD, Y46ECD, Y49ECD, Q50ECD, and M53ECD, of the CLR ECD). Lower right, the most persistent hydrophobic interactions between the TM domains of RAMP1 and CLR, namely I123R, P126R, T130R, T134R, and V137R (plus S141R) help to anchor the RAMP transmembrane helix to CLR (TM3-TM5; CLR residues Y277ECL2, H289ECL2, A3005.45, I2353.52, F2624.52, L2584.48 and W2544.44).
Extended Data Figure 8. Effect of alanine mutagenesis of CLR or RAMP1 on CGRP potency in cAMP accumulation assays.
A; ECD alanine mutations. B; CLR core alanine mutations. Residues that have been mutated are displayed in x-stick format. Mutated residues with no effect on signalling are coloured off-white. Residues that have significantly altered CGRP signaling12,23,28,30–32,34,37,38 are also highlighted in transparent CPK representation, coloured according to magnitude of effect. <10 fold, yellow; 10-100 fold, dark orange; 100-1000 fold, red; >1000 fold, black. The backbones of CLR and RAMP (solid lines) are displayed in transparent, off-white coloured ribbon. The CGRP peptide (dashed lines) is represented in x-stick format with carbon atoms in dark red and polar atoms coloured in red or blue.
Extended Data Figure 9. CGRP makes extensive stable interactions with CLR.
A-D; Distances between CGRP and CLR residues relevant to key hydrogen bonds. The x-axis denotes sampling time for the 16 merged MD replicas of the whole system (each replica is separated by vertical dashed lines). A; Distance between the peptide D3P carboxylic carbon and receptor R3556.59 guanidinium carbon. B; distance between the peptide T6P side chain oxygen atom and the receptor H2955.40 side chain nitrogen atoms (for each frame, the closest nitrogen to T6P was considered). C; Distance between the peptide R11P guanidinium carbon and the receptor D3667.39 carboxylic carbon. D; Distance between peptide R18P guanidinium carbon and receptor D287ECL2 carboxylic carbon. In most cases the distances corresponding to hydrogen bond formation are slightly longer than the standard 2.8 Å. E; H-bonds between CGRP and CLR during MD simulations (6.4 μs). The total persistency of a residue side chain is plotted onto the experimental structure according to a rainbow colour scale, with residues never involved in blue and residues highly involved in red. The peptide (italics, dashed line) is depicted as thin ribbon, while the receptor (solid line) is shown as bulky ribbon. Key side chains are shown, but for intermittent H-bonds the rotameric state has been modified to show an interaction. Residues forming an interaction network are labelled with the same colour. Lower panel, H-bonds between the CGRP N-terminus and the TM bundle of CLR. Upper panel, H-bonds between the CGRP C-terminus and the ECD of CLR; quantitative data on the persistence of H-bonds during the simulations are reported in Supp. Information Table 3. F; Contacts between CGRP and CLR / RAMP1 during MD simulations (6.4 μs). The total persistency of a residue side chain is plotted onto the experimental structure according to a cyan-maroon colour scale, with residues never involved in cyan and residue highly involved in maroon. The peptide (italics, dashed line) is depicted as a thin ribbon, while the receptor (solid line) is shown as a bulky ribbon and transparent surface. Left, contacts between the N-terminus of CGRP and the TM bundle of the CLR: highly persistent hydrophobic interactions characterize peptide residues L12P, L16P, H10P and receptor residues L1952.68, A1381.36 and H2955.40. Right, contacts between the C-terminus of CGRP and the ECD of CLR; highly persistent contacts characterize peptide residues V32P, T30P, F37P and receptor residues Q93ECD and W72ECD. RAMP1 residues F83R, W84R are mainly engaged by CGRP residue F37P.
Extended Data Figure 10. Class B GPCRs display similar active state conformations.
A-B; Alignment of the CGRP-CLR-RAMP1, sCT-CTR, ExP5-GLP-1R and GLP-1-GLP1R structures (aligned on the TM domains). Regions of divergence between CLR/CTR and GLP-1R are circled. In A, RAMP1 has been omitted for clarity. C; Position of the Gαs-Ras domain in the CTR (left), GLP-1R (GLP-1 bound; middle) and GLP-1R (ExP5 bound; right). The receptor TMs were aligned. Only the CLR (blue) and RAMP1 (orange) are displayed for clarity. D; The Gαs-Ras domain from each of the four structures, aligned according to the Gαs-Ras.
Supplementary Material
Acknowledgements
The work was supported by the Monash University Ramaciotti Centre for Cryo-Electron Microscopy.
This work was supported by National Health and Medical Research Council of Australia (NHMRC) project grant (1120919), and NHMRC program grant (1055134). PMS and AC are NHMRC Principal and Senior Principal Research Fellows, respectively. DW is a NHMRC Career Development Fellow, and CK a NHMRC CJ Martin Fellow. AG is an Australian Research Council DECRA Fellow. DLH is a James Cook Research Fellow and is supported by the Marsden Fund (both Royal Society of New Zealand). CAR is a Royal Society Industry Fellowship and acknowledges support from the BBSRC (BB/M006883/1). We are grateful to George Christopoulos and Villy Julita for assay and technical support, Thomas Coudrat for initial homology modelling of CLR from the active CTR, and to Sebastian Furness, Peishen Zhao and David Thal for useful discussion.
Footnotes
Data availability. All relevant data are available from the authors and/or included in the manuscript or Supplementary Information. Atomic coordinates and the cryo-EM density map have been deposited in the Protein Data Bank (PDB) under accession number 6E3Y and EMDB entry ID EMD-8978.
The authors declare no competing financial or non-financial interests related to the research.
Reprints and permissions information is available at www.nature.com/reprints.
Author Contributions
Y.L.L performed virus production, insect cell expression, purification, negative stain EM, data acquisition/analysis, prepared samples for cryo-EM, was responsible for model building and refinement, and assisted with manuscript preparation.
M.K performed cryo-sample preparation, phase-plate imaging, data collection, EM data processing and analysis, calculated the cryo-EM map and assisted with manuscript preparation.
G.D performed MD simulations and assisted in manuscript preparation.
A.G assisted with model building and refinement and contributed to manuscript preparation.
T.S.P assisted with model building and refinement and reviewed the manuscript.
C.K performed cell based assays and data analysis and reviewed the manuscript.
M.R performed preliminary screening imaging and reviewed the manuscript.
J.M.P and W.B organized and managed the Volta phase plate development project.
D.L.H provided insights into the CGRP receptor, assisted with data interpretation, and reviewed the manuscript.
L.J.M provided insights into class B GPCRs, assisted with data interpretation and reviewed the manuscript.
A.C assisted with data interpretation and manuscript preparation.
C.A.R. designed MD simulations, assisted in data interpretation and contributed to writing of the manuscript.
D.W was responsible for overall project strategy and management, data analysis and interpretation and contributed to writing of the manuscript.
P.M.S was responsible for overall project strategy and management, data interpretation and wrote the manuscript.
References
- 1.Hay DL, Garelja ML, Poyner DR, Walker CS. Update on the pharmacology of calcitonin/CGRP family of peptides: IUPHAR Review 25. Br J Pharmacol. 2018;175:3–17. doi: 10.1111/bph.14075. [DOI] [PMC free article] [PubMed] [Google Scholar]
- 2.Russell FA, King R, Smillie SJ, Kodji X, Brain SD. Calcitonin gene-related peptide: physiology and pathophysiology. Physiol Rev. 2014;94:1099–1142. doi: 10.1152/physrev.00034.2013. [DOI] [PMC free article] [PubMed] [Google Scholar]
- 3.Dickerson IM, Bussey-Gaborski R, Holt JC, Jordan PM, Luebke AE. Maturation of suprathreshold auditory nerve activity involves cochlear CGRP-receptor complex formation. Physiol Rep. 2016;4 doi: 10.14814/phy2.12869. [DOI] [PMC free article] [PubMed] [Google Scholar]
- 4.Walker CS, et al. Mice lacking the neuropeptide alpha-calcitonin gene-related peptide are protected against diet-induced obesity. Endocrinology. 2010;151:4257–4269. doi: 10.1210/en.2010-0284. [DOI] [PubMed] [Google Scholar]
- 5.Karsan N, Goadsby PJ. Calcitonin gene-related peptide and migraine. Curr Opin Neurol. 2015;28:250–254. doi: 10.1097/WCO.0000000000000191. [DOI] [PubMed] [Google Scholar]
- 6.McLatchie LM, et al. RAMPs regulate the transport and ligand specificity of the calcitonin-receptor-like receptor. Nature. 1998;393:333–339. doi: 10.1038/30666. [DOI] [PubMed] [Google Scholar]
- 7.Barbash S, Lorenzen E, Persson T, Huber T, Sakmar TP. GPCRs coevolved with receptor activity-modifying proteins, RAMPs. Proc Natl Acad Sci USA. 2017;114:12015–12020. doi: 10.1073/pnas.1713074114. [DOI] [PMC free article] [PubMed] [Google Scholar]
- 8.Hay DL, Pioszak AA. Receptor Activity-Modifying Proteins (RAMPs): New Insights and Roles. Annu Rev Pharmacol Toxicol. 2016;56:469–487. doi: 10.1146/annurev-pharmtox-010715-103120. [DOI] [PMC free article] [PubMed] [Google Scholar]
- 9.Routledge SJ, Ladds G, Poyner DR. The effects of RAMPs upon cell signalling. Mol Cell Endocrinol. 2017;449:12–20. doi: 10.1016/j.mce.2017.03.033. [DOI] [PubMed] [Google Scholar]
- 10.Wootten D, et al. Receptor activity modifying proteins (RAMPs) interact with the VPAC2 receptor and CRF1 receptors and modulate their function. Br J Pharmacol. 2013;168:822–834. doi: 10.1111/j.1476-5381.2012.02202.x. [DOI] [PMC free article] [PubMed] [Google Scholar]
- 11.Christopoulos A, et al. Novel receptor partners and function of receptor activity-modifying proteins. J Biol Chem. 2003;278:3293–3297. doi: 10.1074/jbc.C200629200. [DOI] [PubMed] [Google Scholar]
- 12.Booe JM, Warner ML, Roehrkasse AM, Pioszak AA. Structural Basis for Receptor Activity-Modifying Protein-Dependent Selective Peptide Recognition by a G Protein-Coupled Receptor. Mol Cell. 2015;58:1040–1052. doi: 10.1016/j.molcel.2015.04.018. [DOI] [PMC free article] [PubMed] [Google Scholar]
- 13.Booe JM, et al. Probing the mechanism of receptor activity-modifying protein modulation of GPCR ligand selectivity through rational design of potent adrenomedullin and calcitonin gene-related peptide antagonists. Mol Pharmacol. 2018;93:355–367. doi: 10.1124/mol.117.110916. [DOI] [PMC free article] [PubMed] [Google Scholar]
- 14.Liang YL, et al. Phase-plate cryo-EM structure of a class B GPCR-G-protein complex. Nature. 2017;546:118–123. doi: 10.1038/nature22327. [DOI] [PMC free article] [PubMed] [Google Scholar]
- 15.Liang YL, et al. Phase-plate cryo-EM structure of a biased agonist-bound human GLP-1 receptor-Gs complex. Nature. 2018;555:121–125. doi: 10.1038/nature25773. [DOI] [PubMed] [Google Scholar]
- 16.Zhang Y, et al. Cryo-EM structure of the activated GLP-1 receptor in complex with a G protein. Nature. 2017;546:248–253. doi: 10.1038/nature22394. [DOI] [PMC free article] [PubMed] [Google Scholar]
- 17.Wootten D, et al. The extracellular rurface of the GLP-1 Receptor is a molecular trigger for biased agonism. Cell. 2016;165:1632–1643. doi: 10.1016/j.cell.2016.05.023. [DOI] [PMC free article] [PubMed] [Google Scholar]
- 18.Dal Maso E, et al. Extracellular loops 2 and 3 of the calcitonin receptor selectively modify agonist binding and efficacy. Biochem Pharmacol. 2018;150:214–244. doi: 10.1016/j.bcp.2018.02.005. [DOI] [PMC free article] [PubMed] [Google Scholar]
- 19.Liang YL, et al. Nucleotide-free immobilized G proteins enhance formation of agonist-GPCR-G protein complexes. ACS Pharmacol Transl Sci. doi: 10.1021/acsptsci.8b00017. (in press) [DOI] [PMC free article] [PubMed] [Google Scholar]
- 20.Khoshouei M, et al. Volta phase plate cryo-EM of the small protein complex Prx3. Nat Commun. 2016;7 doi: 10.1038/ncomms10534. 10534. [DOI] [PMC free article] [PubMed] [Google Scholar]
- 21.Khoshouei M, Radjainia M, Baumeister W, Danev R. Cryo-EM structure of haemoglobin at 3.2 Å determined with the Volta phase plate. Nat Commun. 2017;8 doi: 10.1038/ncomms16099. 16099. [DOI] [PMC free article] [PubMed] [Google Scholar]
- 22.Wootten D, Simms J, Miller LJ, Christopoulos A, Sexton PM. Polar transmembrane interactions drive formation of ligand-specific and signal pathway-biased family B G protein-coupled receptor conformations. Proc Natl Acad Sci U S A. 2013;110:5211–5216. doi: 10.1073/pnas.1221585110. [DOI] [PMC free article] [PubMed] [Google Scholar]
- 23.Ter Haar E, et al. Crystal structure of the ectodomain complex of the CGRP receptor, a class-B GPCR, reveals the site of drug antagonism. Structure. 2010;18:1083–1093. doi: 10.1016/j.str.2010.05.014. [DOI] [PubMed] [Google Scholar]
- 24.Watkins HA, et al. Receptor activity-modifying proteins 2 and 3 generate adrenomedullin receptor subtypes with distinct molecular properties. J Biol Chem. 2016;291:11657–11675. doi: 10.1074/jbc.M115.688218. [DOI] [PMC free article] [PubMed] [Google Scholar]
- 25.Woolley MJ, et al. Receptor activity-modifying protein dependent and independent activation mechanisms in the coupling of calcitonin gene-related peptide and adrenomedullin receptors to Gs. Biochem Pharmacol. 2017;142:96–110. doi: 10.1016/j.bcp.2017.07.005. [DOI] [PMC free article] [PubMed] [Google Scholar]
- 26.Weston C, et al. Receptor activity-modifying protein-directed G protein signaling specificity for the calcitonin gene-related peptide family of receptors. J Biol Chem. 2016;291:21925–21944. doi: 10.1074/jbc.M116.751362. [DOI] [PMC free article] [PubMed] [Google Scholar]
- 27.Bower RL, et al. Molecular signature for receptor engagement in the metabolic peptide hormone amylin. ACS Pharmacol Transl Sci. doi: 10.1021/acsptsci.8b00002. (in press) [DOI] [PMC free article] [PubMed] [Google Scholar]
- 28.Woolley MJ, et al. Understanding the molecular functions of the second extracellular loop (ECL2) of the calcitonin gene-related peptide (CGRP) receptor using a comprehensive mutagenesis approach. Mol Cell Endocrinol. 2017;454:39–49. doi: 10.1016/j.mce.2017.05.034. [DOI] [PubMed] [Google Scholar]
- 29.Hay DL, et al. Structure-activity relationships of the N-terminus of calcitonin gene-related peptide: key roles of alanine-5 and threonine-6 in receptor activation. Br J Pharmacol. 2014;171:415–426. doi: 10.1111/bph.12464. [DOI] [PMC free article] [PubMed] [Google Scholar]
- 30.Barwell J, Conner A, Poyner DR. Extracellular loops 1 and 3 and their associated transmembrane regions of the calcitonin receptor-like receptor are needed for CGRP receptor function. Biochim Biophys Acta. 2011;1813:1906–1916. doi: 10.1016/j.bbamcr.2011.06.005. [DOI] [PMC free article] [PubMed] [Google Scholar]
- 31.Vohra S, et al. Similarity between class A and class B G-protein-coupled receptors exemplified through calcitonin gene-related peptide receptor modelling and mutagenesis studies. J R Soc Interface. 2012;10 doi: 10.1098/rsif.2012.0846. 20120846. [DOI] [PMC free article] [PubMed] [Google Scholar]
- 32.Woolley MJ, et al. The role of ECL2 in CGRP receptor activation: a combined modelling and experimental approach. J R Soc Interface. 2013;10 doi: 10.1098/rsif.2013.0589. 20130589. [DOI] [PMC free article] [PubMed] [Google Scholar]
- 33.Conner AC, Simms J, Howitt SG, Wheatley M, Poyner DR. The second intracellular loop of the calcitonin gene-related peptide receptor provides molecular determinants for signal transduction and cell surface expression. J Biol Chem. 2006;281:1644–1651. doi: 10.1074/jbc.M510064200. [DOI] [PubMed] [Google Scholar]
- 34.Simms J, et al. Structure-function analysis of RAMP1 by alanine mutagenesis. Biochemistry. 2009;48:198–205. doi: 10.1021/bi801869n. [DOI] [PubMed] [Google Scholar]
- 35.Zhang H, et al. Structure of the glucagon receptor in complex with a glucagon analogue. Nature. 2018;553:106–110. doi: 10.1038/nature25153. [DOI] [PubMed] [Google Scholar]
- 36.Simms J, et al. Photoaffinity cross-linking and unnatural amino acid mutagenesis reveal insights into calcitonin gene-related peptide binding to the calcitonin receptor-like receptor/receptor activity-modifying protein 1 (CLR/RAMP1) complex. Biochemistry. doi: 10.1021/acs.biochem.8b00502. (in press) [DOI] [PubMed] [Google Scholar]
- 37.Garelja ML, et al. Receptor activity modifying proteins have limited effects on the Class B G protein-coupled receptor calcitonin receptor-like receptor stalk. Biochemistry. 2018;57:1410–1422. doi: 10.1021/acs.biochem.7b01180. [DOI] [PubMed] [Google Scholar]
- 38.Hay DL, Christopoulos G, Christopoulos A, Sexton PM. Determinants of 1-piperidinecarboxamide, N-[2-[[5-amino-l-[[4-(4-pyridinyl)-l-piperazinyl]carbonyl]pentyl]amino]-1-[(3,5-dibromo-4-hydroxyphenyl)methyl]-2-oxoethyl]-4-(1,4-dihydro-2-oxo-3(2H)-quinazolinyl) (BIBN4096BS) affinity for calcitonin gene-related peptide and amylin receptors--the role of receptor activity modifying protein 1. Mol Pharmacol. 2006;70:1984–1991. doi: 10.1124/mol.106.027953. [DOI] [PubMed] [Google Scholar]
- 39.Johansson E, et al. Type II turn of receptor-bound salmon calcitonin revealed by X-ray crystallography. J Biol Chem. 2016;291:13689–13698. doi: 10.1074/jbc.M116.726034. [DOI] [PMC free article] [PubMed] [Google Scholar]
- 40.Abagyan R, Totrov M. Biased probability Monte Carlo conformational searches and electrostatic calculations for peptides and proteins. J Mol Biol. 1994;235:983–1002. doi: 10.1006/jmbi.1994.1052. [DOI] [PubMed] [Google Scholar]
- 41.Emsley P, Cowtan K. Coot: model-building tools for molecular graphics. Acta Crystallogr D Biol Crystallogr. 2004;60:2126–2132. doi: 10.1107/S0907444904019158. [DOI] [PubMed] [Google Scholar]
- 42.Adams PD, et al. PHENIX: a comprehensive Python-based system for macromolecular structure solution. Acta Crystallogr D Biol Crystallogr. 2010;66:213–221. doi: 10.1107/S0907444909052925. [DOI] [PMC free article] [PubMed] [Google Scholar]
- 43.Chen VB, et al. MolProbity: all-atom structure validation for macromolecular crystallography. Acta Crystallogr D Biol Crystallogr. 2010;66:12–21. doi: 10.1107/S0907444909042073. [DOI] [PMC free article] [PubMed] [Google Scholar]
- 44.Mastronarde DN. Automated electron microscope tomography using robust prediction of specimen movements. J Struct Biol. 2005;152:3651. doi: 10.1016/j.jsb.2005.07.007. [DOI] [PubMed] [Google Scholar]
- 45.Zheng SQ, et al. MotionCor2: anisotropic correction of beam-induced motion for improved cryo-electron microscopy. Nat Methods. 2017;14:331–332. doi: 10.1038/nmeth.4193. [DOI] [PMC free article] [PubMed] [Google Scholar]
- 46.Zheng K. Gctf: Real-time CTF determination and correction. J Struct Biol. 2016;193:1–12. doi: 10.1016/j.jsb.2015.11.003. [DOI] [PMC free article] [PubMed] [Google Scholar]
- 47.Tang G, et al. EMAN2: an extensible image processing suite for electron microscopy. J Struct Biol. 2007;157:38–46. doi: 10.1016/j.jsb.2006.05.009. [DOI] [PubMed] [Google Scholar]
- 48.Kimanius D, Forsberg BO, Scheres SH, Lindahl E. Accelerated cryo-EM structure determination with parallelisation using GPUs in RELION-2. Elife. 2016;5:e18722. doi: 10.7554/eLife.18722. [DOI] [PMC free article] [PubMed] [Google Scholar]
- 49.Hager MV, Clydesdale L, Gellman SH, Sexton PM, Wootten D. Characterization of signal bias at the GLP-1 receptor induced by backbone modification of GLP-1. Biochem Pharmacol. 2017;136:99–108. doi: 10.1016/j.bcp.2017.03.018. [DOI] [PMC free article] [PubMed] [Google Scholar]
- 50.Jacobson MP, et al. A hierarchical approach to all-atom protein loop prediction. Proteins. 2004;55:351–367. doi: 10.1002/prot.10613. [DOI] [PubMed] [Google Scholar]
- 51.Goldfeld DA, Zhu K, Beuming T, Friesner RA. Successful prediction of the intra- and extracellular loops of four G-protein-coupled receptors. Proc Natl Acad Sci U S A. 2011;108:8275–8280. doi: 10.1073/pnas.1016951108. [DOI] [PMC free article] [PubMed] [Google Scholar]
- 52.Eswar N, et al. Comparative protein structure modeling using Modeller. Curr Protoc Bioinformatics. 2006;Chapter 5:Unit 5.6. doi: 10.1002/0471250953.bi0506s15. [DOI] [PMC free article] [PubMed] [Google Scholar]
- 53.Huang J, MacKerell AD. CHARMM36 all-atom additive protein force field: validation based on comparison to NMR data. J Comput Chem. 2013;34:2135–2145. doi: 10.1002/jcc.23354. [DOI] [PMC free article] [PubMed] [Google Scholar]
- 54.Doerr S, Harvey MJ, Noé F, De Fabritiis G. HTMD: High-Throughput Molecular Dynamics for Molecular Discovery. J Chem Theory Comput. 2016;12:1845–1852. doi: 10.1021/acs.jctc.6b00049. [DOI] [PubMed] [Google Scholar]
- 55.Dolinsky TJ, Nielsen JE, McCammon JA, Baker NA. PDB2PQR: an automated pipeline for the setup of Poisson-Boltzmann electrostatics calculations. Nucleic Acids Res. 2004;32:W665–7. doi: 10.1093/nar/gkh381. [DOI] [PMC free article] [PubMed] [Google Scholar]
- 56.Olsson MHM, Søndergaard CR, Rostkowski M, Jensen JH. PROPKA3: Consistent Treatment of Internal and Surface Residues in Empirical pK Predictions. J Chem Theory Comput. 2011;7:525–537. doi: 10.1021/ct100578z. [DOI] [PubMed] [Google Scholar]
- 57.Sommer B. Membrane Packing Problems: A short Review on computational Membrane Modeling Methods and Tools. Comput Struct Biotechnol J. 2013;5:e201302014. doi: 10.5936/csbj.201302014. [DOI] [PMC free article] [PubMed] [Google Scholar]
- 58.Lomize MA, Lomize AL, Pogozheva ID, Mosberg HI. OPM: orientations of proteins in membranes database. Bioinformatics. 2006;22:623–625. doi: 10.1093/bioinformatics/btk023. [DOI] [PubMed] [Google Scholar]
- 59.Jorgensen WL, Chandrasekhar J, Madura JD, Impey RW, Klein ML. Comparison of simple potential functions for simulating liquid water. J Chem Phys. 1983;79:926. [Google Scholar]
- 60.Harvey MJ, Giupponi G, Fabritiis GD. ACEMD: Accelerating Biomolecular Dynamics in the Microsecond Time Scale. J Chem Theory Comput. 2009;5:1632–1639. doi: 10.1021/ct9000685. [DOI] [PubMed] [Google Scholar]
- 61.Berendsen HJC, Postma JPM, van Gunsteren WF, DiNola A, Haak JR. Molecular dynamics with coupling to an external bath. J Chem Phys. 1984;81:3684. [Google Scholar]
- 62.Loncharich RJ, Brooks BR, Pastor RW. Langevin dynamics of peptides: the frictional dependence of isomerization rates of N-acetylalanyl-N’-methylamide. Biopolymers. 1992;32:523–535. doi: 10.1002/bip.360320508. [DOI] [PubMed] [Google Scholar]
- 63.Kräutler V, van Gunsteren WF, Hünenberger PH. A fast SHAKE algorithm to solve distance constraint equations for small molecules in molecular dynamics simulations. J Comput Chem. 2001;22:501–508. [Google Scholar]
- 64.Essmann U, et al. A smooth particle mesh Ewald method. J Chem Phys. 1995;103:8577. [Google Scholar]
- 65.Humphrey W, Dalke A, Schulte K. VMD: visual molecular dynamics. J Mol Graph. 1996;14:33–38. doi: 10.1016/0263-7855(96)00018-5. [DOI] [PubMed] [Google Scholar]
Associated Data
This section collects any data citations, data availability statements, or supplementary materials included in this article.


