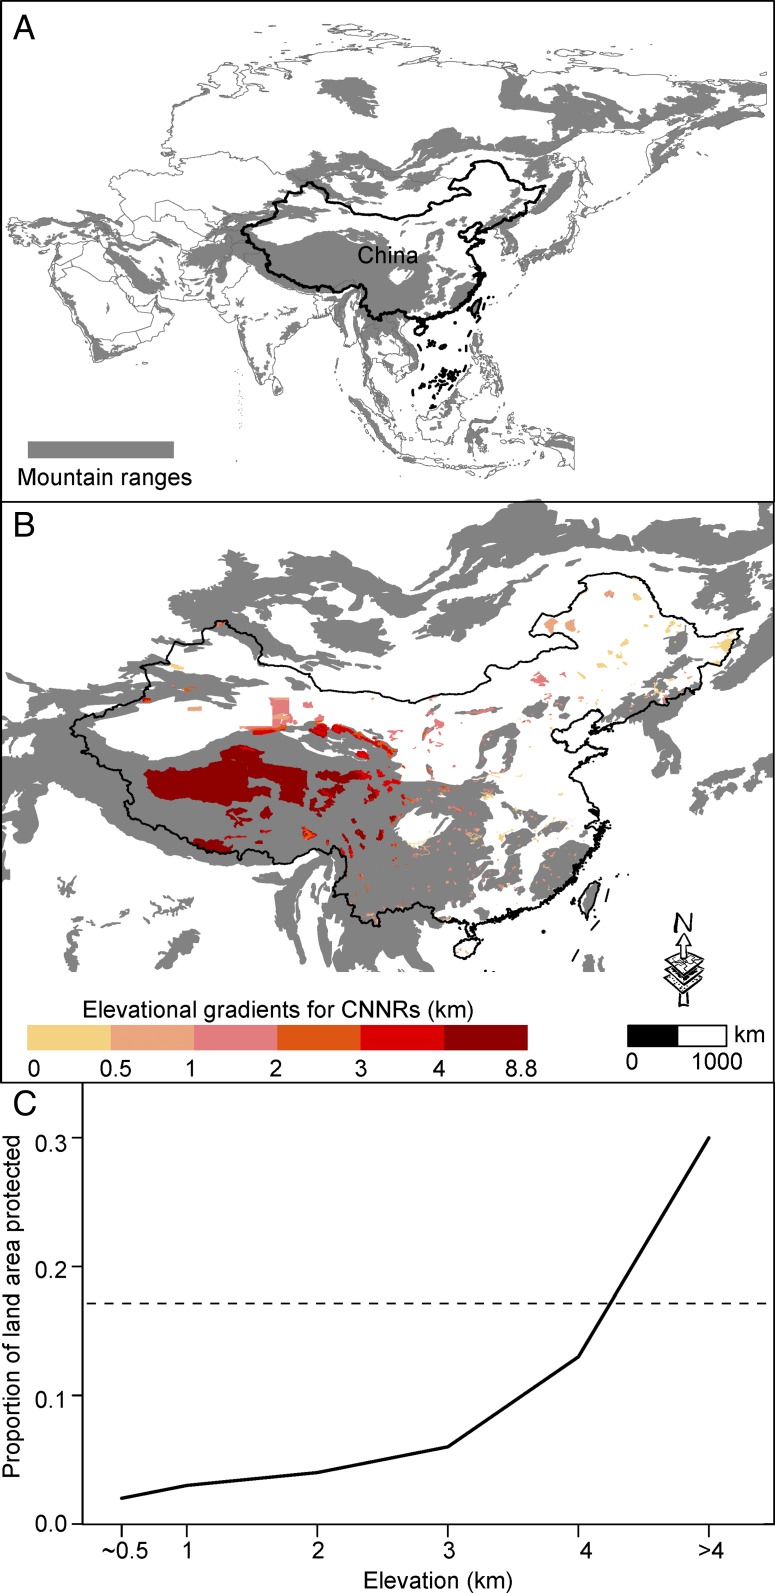
Now, more and more studies use big databases, such as the World Database on Protected Areas (WDPA) (https://www.protectedplanet.net/), which is now a predominant source of information on world protected areas (PAs) (1–4). In PNAS, Elsen et al. (5) report that mountain ranges in Africa and Asia had the lowest elevational protection, based on analyses of the WDPA database. We suspect that this may not be true. China is a mountainous country in Asia (Fig. 1A) (5); we analyzed the elevational protection by China's National Nature Reserves (CNNR) and found that higher elevation regions are under a higher proportion of coverage by CNNR (Fig. 1B). The area of CNNR differed obviously among elevational gradients (Kruskal–Wallis test: χ2 = 143.29, P < 0.01), with the proportion of coverage becoming higher along the elevation (Fig. 1C). The proportion of CNNR coverage in regions with elevation of 4,000 m neared the Aichi Conservation Target 11, and this proportion reached ∼30% when elevation was >4,000 m (Fig. 1C). However, figure 1B of Elsen et al. (5) displays that the heartland of Asia, mainly the Qinghai–Tibetan Plateau, has low coverage of I–IV PAs and does not meet the 17% target. This picture contradicts the fact that this region has the highest PA coverage owing to larger CNNRs established across the vast plateau with few or no human settlements (Fig. 1B).
Fig. 1.
(A) Geographic distribution of mountain ranges in Asia, (B) elevational gradient of China's National Nature Reserve (CNNR), and (C) proportion of elevational land areas protected by CNNR. The horizontal dashed line represents the Aichi Conservation Target 11 of protecting 17% of total land area across elevation.
Why is there such a discrepancy? The pitfall lies in the WDPA database itself. First, compared with current >400 CNNRs, only 112 PAs of China are listed in WDPA (Table 1). Second, in WDPA, only 1 (ID95418) and 18 CNNRs are listed as category IV and VI, respectively; most PAs in China are categorized as “not reported,” “not applicable,” or “underdesignated.” This consequence is more profound in figure 2 B–D of Elsen et al. (5), with clear divergence in the heartland of Asia, considering different categories of PAs. Moreover, besides national nature reserves, many more provincial and county reserves were established in China (www.mep.gov.cn/gkml/hbb/bwj/201611/t20161102_366739.htm). This obviously differs from the data in WDPA (Table 1). Other Asian countries most likely encounter a similar problem. Such a pitfall must be noticed by both conservationists and managers, as the trend of using the WDPA database for authoritative information continues.
Table 1.
Categories of nature reserves in China and PAs in the WDPA database
| China’s nature reserves and PAs in WDPA | No. | Area, km2 |
| Different categories of nature reserves in China | ||
| National level | 428 | 9.65E+09 |
| Provincial level | 879 | 3.80E+09 |
| City level | 410 | 4.66E+08 |
| County level | 1,023 | 7.92E+08 |
| Total | 2,740 | 1.47E+10 |
| PAs of China listed in WDPA | ||
| IV | 1 | 2.11E+02 |
| VI | 18 | 4.95E+03 |
| Not applicable | 45 | 1.12E+05 |
| Not reported | 48 | 3.10E+04 |
| Total | 112 | 1.48E+05 |
We thus strongly urge local authorities to review the data variability of these kinds of big databases, whose importance is beyond description, being used for more and more metaanalyses. The WDPA’s manager should contact each country for reporting and categorizing their PAs and check the data to eliminate confusion in areas, because many PAs may have more than one title; for instance, a nature reserve also bears other type names, such as Geopark, forest park, scenic site, or Natural Heritage Site, and so forth. Only when the data are validated and reviewed periodically can we have sound data for further analyses and avoid the pitfall of big databases. We cannot rely on the users to validate the data, nor can we rely on the reviewers and editors of scientific journals to validate these data.
Acknowledgments
This study was supported by the National Natural Science Foundation of China (Grants 31572290 and 31770568), State Key Research and Development Project (Grant 2016YFC0503303), Science and Technology Service Network Initiative of the Chinese Academy of Sciences (Grant KFJ-STS-ZDTP-013), and the Youth Innovation Promotion Association of the Chinese Academy of Sciences (Award 2015304).
Footnotes
The authors declare no conflict of interest.
References
- 1.Joppa LN, Pfaff A. High and far: Biases in the location of protected areas. PLoS One. 2009;4:e8273. doi: 10.1371/journal.pone.0008273. [DOI] [PMC free article] [PubMed] [Google Scholar]
- 2.Leroux SJ, et al. Global protected areas and IUCN designations: Do the categories match the conditions? Biol Conserv. 2010;143:609–616. [Google Scholar]
- 3.Watson JEM, Dudley N, Segan DB, Hockings M. The performance and potential of protected areas. Nature. 2014;515:67–73. doi: 10.1038/nature13947. [DOI] [PubMed] [Google Scholar]
- 4.Jones KR, et al. One-third of global protected land is under intense human pressure. Science. 2018;360:788–791. doi: 10.1126/science.aap9565. [DOI] [PubMed] [Google Scholar]
- 5.Elsen PR, Monahan WB, Merenlender AM. Global patterns of protection of elevational gradients in mountain ranges. Proc Natl Acad Sci USA. 2018;115:6004–6009. doi: 10.1073/pnas.1720141115. [DOI] [PMC free article] [PubMed] [Google Scholar]


