Abstract
This paper examines the possibilities of creating quantified models of past human activities in both time and space. The study area lies in the southeastern Czech Republic and western Slovakia. The spatio-temporal model of behavioural categories was calculated with the help of Monte Carlo simulations and statistical testing. One of the main advantages of our approach is that it admits the probabilistic nature of input data, quantifies them and provides probabilistic results comparable with other proxies. It also presents a less biased way of how archaeological data from regions and periods with low numbers of 14C datings can be incorporated into models of past population dynamics.
Keywords: temporal uncertainty, Monte Carlo simulation, past human activities, prehistoric population dynamics, chronology, modelling, Central Europe
Introduction
Human societies studied by archaeology are always defined in space and time. Spatial dimensions and structures are often explored, recorded and analyzed with modern, high precision devices (e.g. total station, GPS). There is a broad range of quantitative approaches to archaeological spatial data, which have been discussed in literature for decades (e. g. Hodder and Orton 1976; Mehrer and Wescott 2006; Bevan 2012). Quantitative spatial analysis has been accelerated by the availability of digital spatial data and increased computational power used by a diverse range of GIS software (Longley 2000).
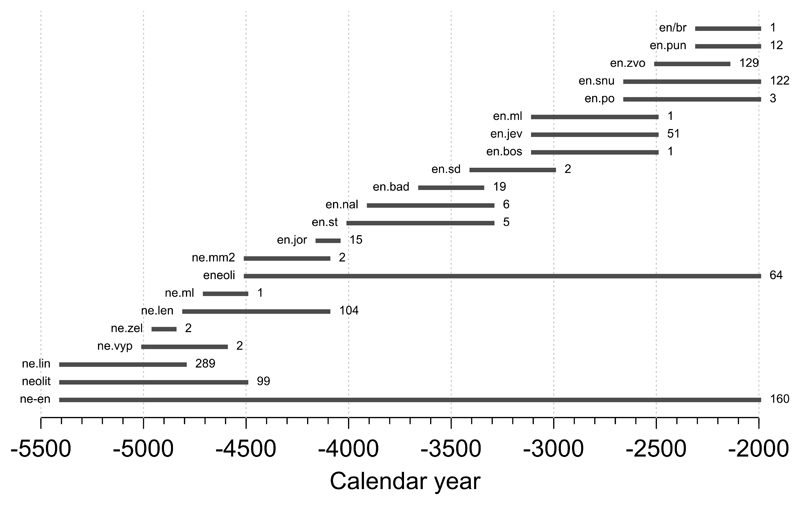
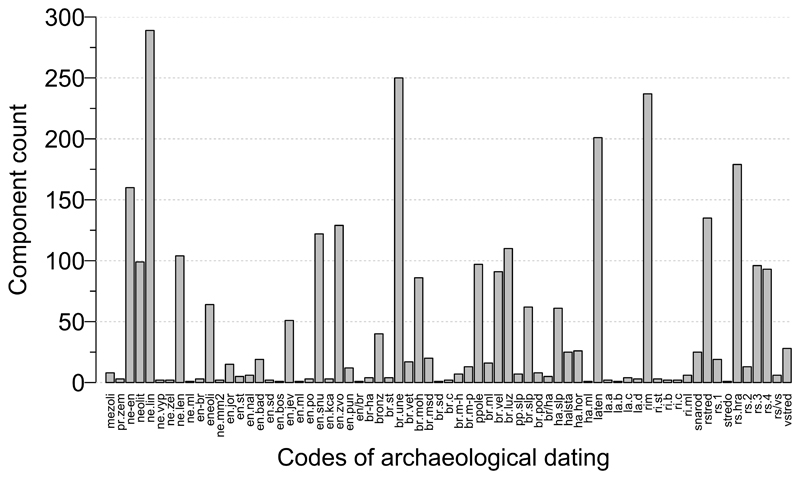
By contrast, approaching the time dimension can still be a precarious enterprise. Crema (2012) called the quantified integration of the temporal dimensions of archaeological phenomena into formal analysis a “thorny but surprisingly neglected problem.” There exist techniques (e.g. 14C dating, OSL) that measure the physical properties of dated archaeological materials, such as artefacts, sediments, human, animal or plant remains. Such techniques can produce relatively precise dates, but it is equally important to understand their limitations (for a broad discussion, see Walker 2005). In addition, the use of modern dating techniques is also limited by the scientists themselves, more precisely by their research traditions. The coverage of 14C datings from prehistory in Europe is strongly regionalized due to various reasons (Contreras and Meadows 2014). For example in East-Central Europe (especially in the Czech Republic and Slovakia) it never became a research routine to analyze sets of samples from every excavated site. This causes numerous problems from the persistence of typo-chronological schemes of traditional cultural-historical archaeology to the impossibility of comparing local cultural or population dynamics with other European regions (cf. Shennan et al. 2013; Whitehouse et al. 2014; Hinz et al. 2012). Central European archaeology still heavily relies on terms like archaeological cultures (e. g. Linearbandkeramik, Funnel Beaker culture), or periods (Neolithic, La Tène period). These terms are also frequently used as a means of dating (for a recent discussion on archaeological cultures, see Roberts and Vander Linder 2011). Based on known absolute datings from several sites in the region as well as on stratigraphic relations of features assigned to archaeological cultures at individual sites, regional chronologies with specified time spans for each archaeological unit (culture, group, period, phase, etc.) have been established. Temporal information with a specified beginning and end is available for every recognizable archaeological component. Nevertheless, it is increasingly difficult to decide whether archaeological phenomena occurred continually or in cycles of events within a given temporal framework. A further cause of temporal uncertainty in archaeology is the variation in dating precision of different types of artefacts. Some types are diagnostic (with high precision of dating) while others are generic (with low precision, i.e. with a time span sometimes as long as several thousand years) (Figure 1). Dating solely by archaeological cultures (or periods and phases) does not create plausible results for long-term human activity models. Figure 2 shows a barplot of archaeological components assigned to archaeological cultures in chronological order according to the central point of their time span but without taking temporal uncertainty or synchronicity into account. In this barplot, temporal overlaps and the lengths of individual time spans are not observable. Such a simple depiction strongly deforms our knowledge and is thus of no use.
Figure 1.
Temporal uncertainty represented by the length of the bar and number of components assigned to archaeological units from the Neolithic (beginning with "ne") and Eneolithic (beginning with "en") in the study area.
Figure 2.
Barplot showing the number of archaeological components assigned to archaeological cultures and periods (arranged from oldest to youngest, coding was adopted from the Archaeological Database of Bohemia) acquired from parishes in a buffer of 25 km radius around Lake Vracov (Czech republic).
Notwithstanding the above, the (numerical) character of typo-chronological dating is in fact similar to 14C dating results and can therefore be used in similar mathematical procedures including modelling. There are several approaches to resolve the issue of temporal uncertainties. For example Bevan et al. (2013) analyzed intensive surface survey finds from Antikythera, Greece with the help of statistical methods at the landscape scale. Crema (2012; Crema et al. 2010) quantified temporal uncertainty in the settlement strategies and population size of hunter-gatherers in Japan by probability-weighted spatial analysis and by Monte Carlo simulation. Nakoinz (2012) examined Early Iron Age finds that could not be precisely dated by 14C due to the shape of the calibration curve. Green (2011a; 2011b) addressed the temporal inadequacies of the conventional use of GIS by integrating dating evidence. His temporal GIS models were able to deal with different kinds of temporal uncertainties and analyze them in space.
The usage or negligence of independent dating methods during recent excavations is only one side of the issue of temporal uncertainty in archaeology. These methods were invented from the mid-20th century onwards, when in many regions archaeological research had already had a history spanning more than a century. Because archaeology is destructive, early research usually cannot be re-examined and dated with modern methods. Furthermore, temporal uncertainty is often combined with spatial imprecision. Older excavation reports tended to provide location information only in vague terms, such as fields or parishes. In order to realize the full potential of large archaeological databases, effective means of incorporating and analyzing all existing data need to be invented. Central Europe seems to have ideal conditions to achieve this. Archaeological heritage management is centralized and regularly up-dated, large digital databases of archaeological sites or excavations exist (in the Czech Republic: ‘Archaeological database of Bohemia’i managed by the Institute of Archaeology of the Academy of Sciences of Czech Republic, Prague, ‘Megalit’ databaseii managed by the Institute of Archaeology of the Academy of Sciences of Czech Republic, Brno, and ‘State Archaeological List’iii managed the National Heritage Institute; in Slovakia: ‘Central evidence of Archaeological Sites of Slovakia’iv managed by the Archaeological Institute of the Slovakian Academy of Sciences, Nitra). However, these large digital datasets are usually used for the purposes of documentation and evidence, and robust scientific analyses are still missing. The main problem with these databases is their focus: they usually do not contain all available archaeological data. Some focus on precisely localized sites and ignore large numbers of traces localized at the level of parishes, others register ongoing excavations, which leads to multiple records from one site with multiple excavation campaigns. Finds (and sometimes entire sites) excavated before WWII are often not included due to their spatial or temporal uncertainty.
In a wider context, one can argue that archaeologists deal with data which are essentially random collections of evidence. Theoretically, archaeological sites and finds are remains of former community areas - parts of landscapes inhabited and used by human communities. These community areas consisted of patches of activity areas (villages, graveyards and other ritual places, fields, pastures, woodland, communications, etc.) where specific types of behaviour (dwelling, pottery production, ploughing, foraging, etc.) occurred. These community areas, together with supra-community places (e. g. hillforts, large mining areas, important ritual places) created landscapes not in a geographical sense, but in the sense of a social world (Neustupný 1991; 1998a; 1998b; Kuna and Dreslerová 2007). The original remains of human behaviour in these activity areas undergo formation processes and thus the amount of available information depends on several factors, such as past depositional behaviour, survey and excavation intensity as well as archaeological component taphonomy, which is tightly connected to past and recent land-use and natural landscape processes (e.g. erosion and/or accumulation). As a result, lack of archaeological finds in space or time does not necessarily equal absence of human activity in the past and could be closely connected to social and environmental factors (Mischka 2008). Taking into account recent studies on prehistoric populations based on large 14C datasets, it was also argued that the lack of 14C dates and sample selection is related to the economic possibilities of current regions and to period preferences rather than to prehistoric population dynamics (Contreas and Meadows 2014). Different quantities of archaeological sites (and thus datable material) can be also connected to changes in mobility and subsistence strategies as suggested by Crombé and Robinson (2014) for the Mesolithic and Neolithic in Belgium and northwestern France.
Our paper seeks to address the problems of temporal and spatial uncertainty, synchronicity, and the incompleteness of the archaeological record in a lowland landscape in the southeastern Czech Republic and western Slovakia. In particular, we aim to quantify temporal uncertainty at a spatial resolution that allows for the incorporation of all previous data, and apply the results in spatial analyses that strive to compensate for the randomness of the archaeological record. Our main aim is to present an approach to older as well as recent archaeological data which creates a quantified result, compatible with the results of natural scientific investigations and the statistical methods that natural scientists routinely use. Such an approach can raise the significance and appeal of archaeological data in interdisciplinary investigations.
Materials
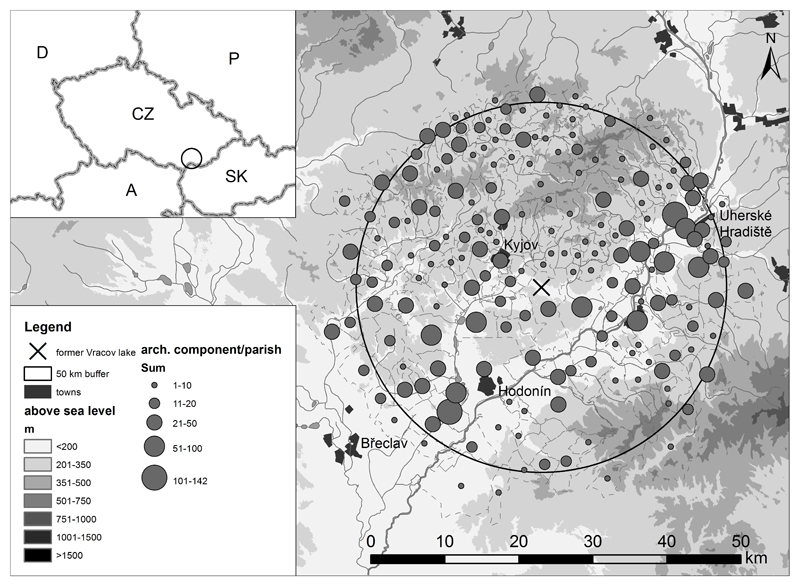
The study area was defined as a circle with a radius of 25 km around Lake Vracov in the southeastern Czech Republic, where intensive palaeoecological investigations are currently conducted (Figure 3). The area consists of hilly areas in the north and partly also in the southeast, while the central part is the wide valley of the Morava river. The smallest administrative unit in the Czech Republic and Slovakia is the (civil) parish (katastrální území in Czech). Because older excavation reports were often spatially identified only at the level of parishes (see below), we used this unit to precisely delimit the study area. All archaeological sites from parishes that were at least partly inside the 25 km circle around Lake Vracov were taken into consideration. In total, 212 parishes were included in the study. The study period ranged from the beginning of the Holocene (Mesolithic) until the Early Medieval Period (until ca. 1000 AD).
Figure 3.
Location of Lake Vracov, the 25 km buffer zone, and the number of archaeological components per parish.
Archaeological data were collected from three main sources: unpublished excavation reports stored at the archive of the Institute of Archaeology, Academy of Sciences of the Czech Republic, Brno, published reports of the Institute of Archaeological Heritage Brno (Čižmář, Geislerová and Unger 2000; Čižmář and Geislerová 2006) and published topographical summaries of known archaeological sites from the vicinity of the Early Medieval centre in Mikulčice (Poláček 1997; 1998; 1999; 2005). Partly following the template set out by the Archaeological Database of Bohemia (Kuna and Křivánková 2006), archaeological components were used as basic analytical units in analysis and simulations. These are defined as spatially continuous sets of finds delineated by their function (e.g. residential) and chronological position (e.g. Early Bronze Age). Chronologically and spatially identical finds were considered as one component. The number of finds in one component played no role – a spatially isolated single grave was considered as one component in the same manner as an entire graveyard consisting of hundreds of chronologically contemporary graves. To spatially distinguish between individual components, an arbitrary distance of 250 m was set.
The temporal and spatial determination of components was characterized by various degrees of accuracy. For spatial determination, the classification used in the Archaeological Database of Bohemia was adopted, distinguishing between 4 categories of accuracy: exactly located (measured with geodetic tools, 2.5m tolerance); less accurately located (25m tolerance); unmeasured location (defined by larger spatial unit, e.g. field name, 250m tolerance); and finally, located only to parish. In most cases, reports written prior to WWII localized the components only relatively vaguely using field names. Forasmuch as the names and positions of these ”fields” could change during time and most reports contained no field plans or maps, we could localize these components only at the level of parishes. Contemporary sites ascribed in these reports to different fields were considered as different components. By contrast, the majority of recent excavations and surface surveys were exactly located using modern geodetic tools.
The dating of archaeological components used in our calculations is based on the time spans of archaeological cultures and periods in the Czech Republic published by the Institute of Archaeology ASCR in Prague.v These dates, which were updated with the help of recent radiocarbon datings collected by Bárta at al. (2013), are used in other scientific and heritage databases as well. Components were defined in time by chronological units whose time span varied from relatively short periods (e.g. La Tène: B 400-250 BC, Bell Beaker Culture: 2500-2150 BC) to long periods for vaguely dated finds (e.g. „Neolithic-Eneolithic“ 5400-2000 BC for most of the non-diagnostic polished stone tools). This variation in dating accuracy was caused by several factors: various dissimilarity of the finds, precision of typo-chronological schemes, skills of the researcher, and, above all, the sporadic occurrence of absolute radiocarbon data. We avoided the use of detailed local typo-chronologies based on pottery styles ordered in evolutionary series (for criticism, see e. g. Müller 2004). We therefore benefited from the constancy of time spans of archaeological cultures, even if recent research on 14C based chronologies of inner material cultural evolution has shown significant differences in comparison with traditional typologies (Kuča et al. 2012).
For the purposes of further quantification, components were divided into four behavioural categories (activity areas): residential components (remains of storage pits, dwellings, pitholes, etc.), burial components (graves, tumuli, etc.), traces (stray finds, sites detected only by surface surveys, coins, older finds with unknown circumstances) and hoards of all kinds.
Methods
Temporal uncertainty quantification
Firstly, to visualize trends in component dating accuracy, we calculated mean, 5th and 95th percentile of dating duration for all components potentially belonging to each single year. This gives an overview of the common limits and central tendency in temporal resolution over the study period.
We calculated the raw sum of components whose dating range fall into each calendar year within the study period. To deal with uncertainty in the dating of archaeological components, we employed a Monte Carlo method based solution as proposed by Crema (2012). From our data we simulated 1000 potential time-series, in each simulation run every single archaeological component was randomly assigned to a single year within the time span of corresponding dating. Uniform probability of component occurrence was set throughout the time span of the archaeological dating, a method also used by Green (2011a, 2011b) in connection with ceramic and other typological dates as well as calibrated radiocarbon dates with unknown internal probabilities (so called standard probability).
The temporal pattern of time-series was analysed to quantify the variance of expected numbers of components at pre-defined time blocks and parishes. At a regional scale (i.e. the entire dataset), median, 5th and 95th percentile of component number belonging to each time block was calculated from 1000 potential time-series. The width of the envelope given by the 5th and 95th percentile expresses the uncertainty caused by the inaccurately dated components within a selected time block. Simulation results were analysed for one resolution, whose time block duration was set to 500 years. This resolution approximately corresponds to the median accuracy of component dating, which is 450 years.
Parish occupancy likelihood
The number of archaeological components per parish (local scale) can be strongly biased by the intensity of archaeological research. To compensate for this, we operated only with the probability of occupancy of each parish in each time block. A parish was considered to be occupied in a particular time block and simulation run if at least one component was attributed to it. To deal with temporal uncertainty, we calculated the likelihood of parish occupancy in a given time block as the proportion of simulation runs in which the parish was evaluated as occupied.
Next, for each simulation run the overall proportion of occupied parishes was expressed. Parishes without any record in the database were excluded from the analysis. This number provided us with information about the spatial extent of archaeologically detectable human activities in the region, which was visualized using GIS techniques. For each parish, parish occupancy likelihood for each time block was interpolated (natural neighbour method; Sibson 1981; Watson 1992) and depicted with help of isolines for the whole study area. Firstly, parish occupancy likelihood based on all kinds of components was calculated for four time blocks. Secondly, the time block 1000-500 BC was chosen for examining the spatial patterning of parish occupancy likelihood based on different components. The maps show only the probability of occupancy higher than 0.5, in other words areas with a high probability of past human activity.
Rate of change analysis
Rate of change, defined as the difference in the proportion of occupied parishes in the whole area between two consecutive time blocks, was analysed following a modified procedure of the Rate of change analysis (Crema 2012). The probability, direction and degree of change in regional occupancy were obtained from the simulated counts of occupied parishes in consecutive time blocks. The significance test was performed in a slightly different way from the original rate of change procedure. We calculated the probability of increase or decrease in occupancy by an exact Fisher test with simulated counts of occupied and vacant parishes for each transition (Fisher 1935). Change of occupancy in transitions with a mean significance level lower than 0.05 over all simulations was considered as significantly different from zero.
The null model in the test designed by Crema assumes that mean expected counts in all time blocks are equal and confidence intervals bound random fluctuations from this mean value. This simulates the situation when no temporal information is available. Such a procedure creates wide confidence intervals for change between periods that share low numbers of components and vice versa. Therefore, we compared occupancy levels between two consecutive time blocks to the null model assuming that their mean is common but different from the overall mean. The Fisher exact test is designed for binomial data (i.e. occupied/vacant cadastres) and gives exact probabilities of obtaining large differences in counts caused by coincidence. The proposed combination of simulated temporal trajectories and Fisher exact test takes both sources of error into consideration: temporal uncertainty and the random nature of archaeological evidence.
All simulations and statistical analyses were performed in R (R Development Core Team 2011).
Results
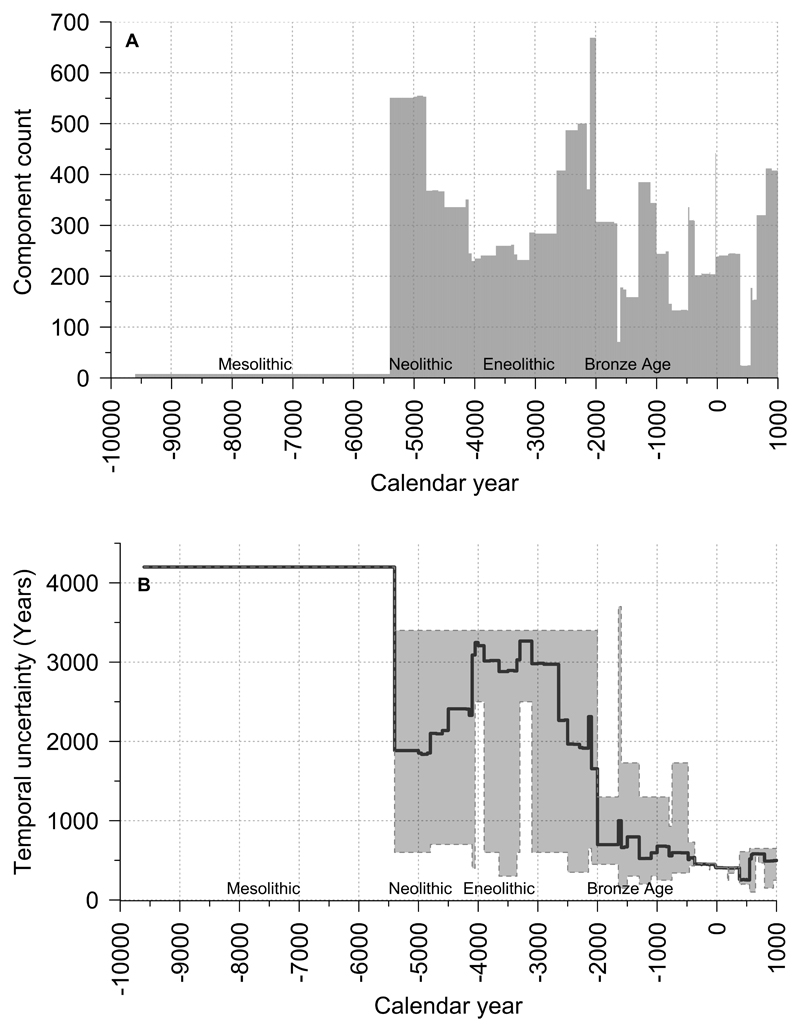
3116 unique archaeological components were acquired in the study area. Activity area classification resulted in 639 residential components, 550 burial components, 1801 traces, 60 hoards and 66 other activity areas. The temporal pattern of the number of components potentially originating in selected periods shows abrupt changes at the edges of the time spans of archaeological units with artificial peaks when consecutive units (cultures) overlap and drops when units are discontinuous (Figure 4:A). Note that sums are not weighted by component dating duration, and therefore long lasting archaeological units accumulate more components. One can also observe significant differences in dating uncertainties (Figure 4:B). In the Mesolithic there are only a few sites dated roughly to the whole time span of this period. The Neolithic and Eneolithic periods (up to 2000 BC) are characterized by high temporal uncertainty and thus high numbers of components (resulting from the procedure described above). From 2000 BC onwards temporal uncertainty becomes relatively low, which can be confronted with the lower number of possible components. In sum, temporal uncertainty in archaeological component dating gradually decreases from as much as 4200 years in the Mesolithic to 407 years in the Roman Period.
Figure 4.
A - Sum of components dated potentially to each calendar year. Counts are uncalibrated by dating time span, B - Observed temporal uncertainty in components over time: mean (full line) and interval between 5th and 95th percentile (grey filled area) of component dating range for calendar years. Lower values indicate more accurate dating in the given period. Note that for the entire Mesolithic stable temporal resolution can be observed.
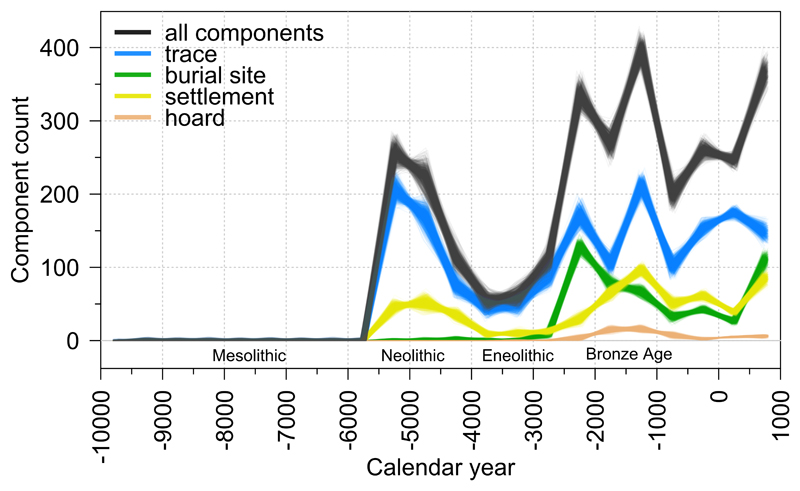
A cumulative plot of 1000 Monte Carlo simulation runs for each dated component with initial duration of time blocks set at 500 years was created from our dataset (Figure 5). The results for the four behavioural categories of the archaeological record (settlements, burial sites, traces and hoards) demonstrated the temporal dynamics of these categories through pre-defined time steps. Figure 5 also shows the temporal pattern of the envelope for each data category. The different thicknesses of the envelopes aptly demonstrate the temporal uncertainty for each data category and time step. Significant differences in temporal uncertainty are suggested between traces, which usually consisted of vaguely dated survey finds, and graves and hoards, which were usually considered as closed find contexts with diagnostic finds in a good state of preservation.
Figure 5.
Counts of components assigned by Monte Carlo simulation to 500-year time blocks, classified according to the origin of activity. Counts are based on 1000 simulations.
The generic course of the curves for each component category (Figure 5) at the regional scale shows that the beginning of the Neolithic around 5500 BC means a significant increase in all kinds of archaeological data, especially settlements and traces. Nevertheless, archaeological evidence is decreasing already before 4000 BC, and between 4000 and 3000 our simulation registers the lowest values for all data categories. Another increase can be observed after 3000 or 2500 BC depending on the category. The model demonstrates that the burial record becomes highly frequent. Data on burials steadily decrease after the Final Eneolithic/Early Bronze Age (2500-2000 BC), and in fact similar levels are reached again only in 500-1000 AD. The temporal structure of traces is similar. The high levels recorded in the Neolithic are not repeated until the second half of the 3rd millennium BC. Settlements show a slightly different pattern. The rise and fall during the Neolithic is present in this case as well, but low values in the Eneolithic are followed by a gradual increase from 3000 to 1000 BC. After this period one can observe a more stable but slightly decreasing tendency in the settlement and burial ground curves. This changes again in the Early Medieval Period after 500 AD. The amount of traces dated to time blocks between 2500 BC and 1000 AD fluctuates, nevertheless the highest number was simulated for the period between 1500 and 1000 BC (most of this time block can be identified with the Younger Bronze Age). In the same time block, we registered the highest number of hoards and settlements as well.
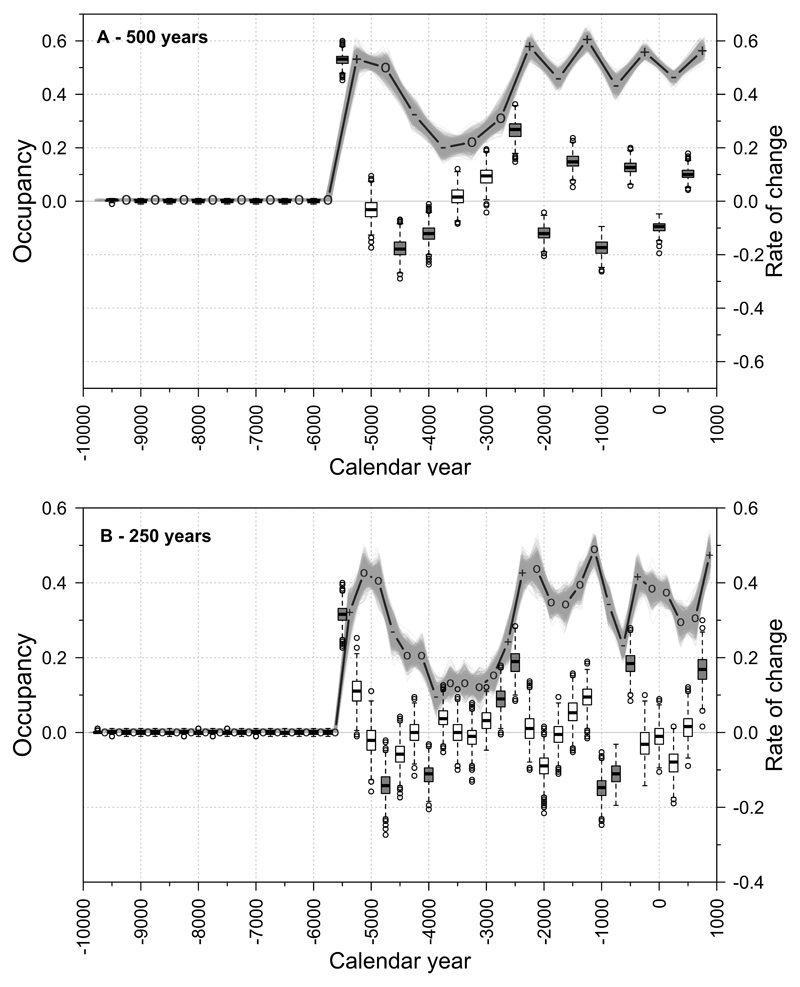
We simulated parish occupancy likelihood for the entire study area by taking into account only the presence or absence of any dated component (Figure 6:A). Surprisingly, the shape of the curve showing the possible number of occupied parishes is very similar to the previous simulation, which was directly dependent on the number of components. The number of possibly occupied parishes sharply increases at the beginning of the Neolithic around 5500 BC. A major decrease in possibly occupied parishes is visible between 4500 and 3000 BC, and Neolithic levels are reached again only after 2500 BC. After that time the proportion of possibly occupied parishes fluctuates between 0.4 and 0.6. The envelope is notably thicker for the Neolithic and Eneolithic periods (ca. 5500-2000 BC) caused by the large number of non-diagnostic stone axes and hammer-axes which usually could not be dated more precisely than for this entire period. Calculating the simulation for 250-year time steps, very similar results can be observed (Figure 6:B). Nevertheless, after the massive reduction of possibly occupied parishes in the Eneolithic, comparable declines are shown between 1750 and 1250 BC (partly Middle Bronze Age), 1000 and 500 BC (Early Iron Age – Hallstat Period) and 250 and 750 AD (end of Roman Period, Migration Period, beginning of Early Medieval Period).
Figure 6.
Parish occupancy likelihood (lines) and rate of change (Box-and-Whisker plots): A - for 500-year time blocks, B - for 250-year time blocks. Medians of occupancy in time blocks with significant increase are marked by „+“; significant decrease is marked „-“. Boxes show the rate of change median value and interquartile range, whiskers span 1.5 times the interquartile range from the box. Significantly non-zero rates of change boxes are in grey.
We calculated the rate of change for parish occupancy, as this seems to be less biased by the research history of the region than the generic curves of component categories. Taking a closer look at the box plot with 500-year resolution, only three transitions appear statistically insignificant - around 5000 BC, 3500 BC and 3000 BC (Figure 6:A). All other transitions indicate significant increases or decreases in parish occupancy. Higher temporal resolution (250 years) produced several consecutive time blocks with statistically insignificant rates of change of parish occupancy, indicating stable periods of up to 1000 years (Figure 6:B). Several periods of constant archaeological evidence can be observed - around 5000 BC, around 4250 BC, 3750-2750 BC, around 2250 BC, 1750-1500 BC, 250 BC-0 and around 500 AD.
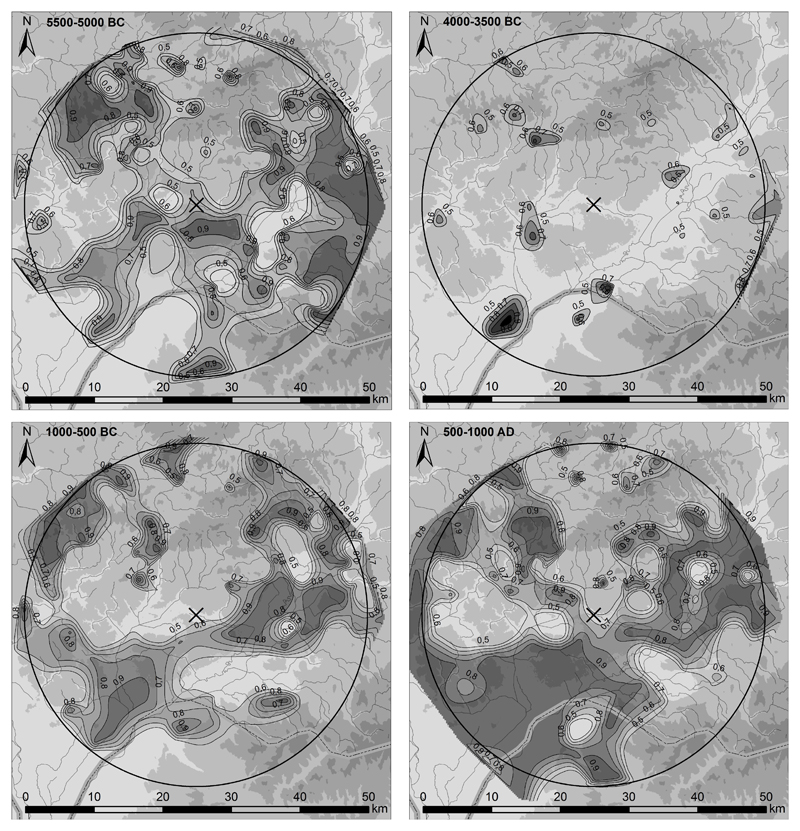
The temporal patterns of parish occupancy likelihood can also be observed in space (Figure 7 and 8). Examples covering specific 500-year time blocks show the different spatial extents of archaeologically detected human activities from the beginning of the Neolithic (5500-5000 BC), Early Eneolithic (4000-3500 BC), Late Bronze Age and Hallstatt Period (1000-500 BC) and the Migration Period and Early Medieval Period (500-1000 BC). In the oldest example (5500-5000 BC), which consisted mostly of finds assigned to the LBK (Linearbandkeramik culture), parishes with the highest occupancy likelihood are concentrated mostly in the eastern part of the region. A similar, somewhat unexpected concentration can be observed also in the northwestern, hilly part of the study area. The spatial model for 4000-3500 BC reflects the temporal model with low levels of archaeologically detected human activity. It seems that exploring these activities in space does not modify the general impression gained from the temporal model; the map depicts dispersed single events. The end of Bronze Age and the Hallstatt Period (1000-500 BC) is characterized by similar patterns as the beginning of the Neolithic, but the area with high occupancy likelihood is smaller. After 500 AD the model shows an even spread of parishes with high occupancy likelihood within relatively wide areas, especially in the Morava river valley.
Figure 7.
Spatial patterns of parish occupancy likelihood in the study region. The raster was interpolated by the natural neighbour method. Parish occupancy likelihood higher than 0.5 is shown.
Figure 8.
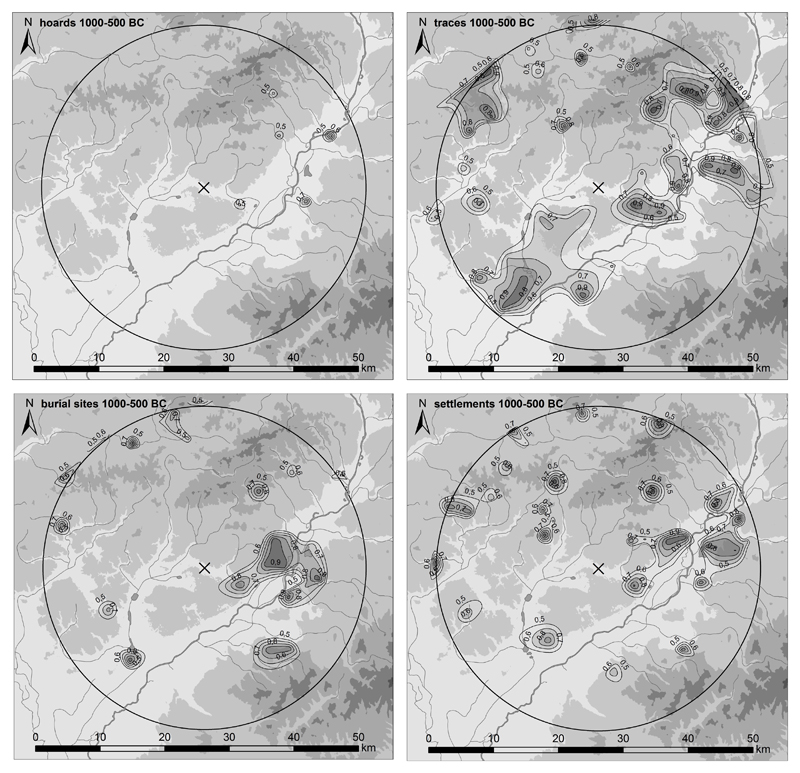
Spatial patterns of parish occupancy likelihood in the study region calculated separately with hoards, traces, burial sites and settlements. The raster was interpolated by the natural neighbour method. Parish occupancy likelihood higher than 0.5 is shown.
To study whether various component types lead to differential spatial patterning, we chose one reference time block (1000-500 BC), for which parish occupancy likelihood was calculated separately using traces, hoards, burial sites and settlements (Figure 8). If we compare this with the overall image of parish occupancy likelihood, the differentiated spatial pattern seems to be much less continuous. Especially settlements and burial sites show quite regular patterning with larger occupied areas in the Morava river valley in the east of the region. Parish occupancy likelihood based on traces shows a more continuous pattern occupying a much larger area. Hoards seem to have been relatively rare in this period.
Discussion and Conclusions
With the Monte Carlo simulation method, we dealt with temporal uncertainty by determining the length of time blocks and simulating possible time series of dated components. As suggested by Crema (2012), using this simulation method implies that we are interested in universal characteristics of the variation at each time step which oscillate between two states (high and low with some threshold in-between). These states can indicate changes in land-use, settlement pattern, population size, depositional behaviour or archaeological research history (cf. Crombé and Robinson 2014). One should also bear in mind that at the beginning we had the exact numbers of archaeological components assigned to archaeological cultures, but a more realistic picture corresponds to the envelopes of possible values calculated during the simulation. Thus we get the range of values of each archaeological category for each time step. This possible range of values also reflects the state of our knowledge, regarding both the number of archaeological components and the uncertainty of their dating. The Monte Carlo simulation method shares the advantages of previously used aoristic analysis (Crema et al. 2010; Johnson 2004; Ratcliffe 2000) and provides an opportunity to express uncertainty given by the mismatch between the temporal resolution of archaeological component dating and the evaluated time blocks. A problematic assumption of this method is the independency of samples (i.e. archaeological components). Human activities were probably both spatially and temporarily correlated even within archaeological units, which is also indicated by our results for basic behavioural categories. Communities within a region were spread in several villages or seasonal dwellings and concurrently used their specific activity areas (burial places, pastures, fields, gardens, ritual places, etc.). This is reflected in the varying intensity of archaeological evidence. For instance, in the case of parallel occupation of several settlements that cannot be precisely dated, our approach may underestimate the temporal variability within the archaeological period, and instead of significant increases or decreases, it indicates longer and more moderate effects.
We analysed the spatial pattern of our data at the resolution of individual parishes, which represents a shared spatial accuracy for all archaeological components. This provided an opportunity to use all existing archaeological data including pre-WWII excavation reports, which make up nearly half of the data. The area of parishes is highly variable, ranging from 0.95 km2 to 63.32 km2, therefore the results of the parish occupancy analysis must be interpreted with caution. Dreslerová (2012) also analyzed the archaeological evidence for the Neolithic and Eneolithic in Bohemia based on parishes, considering the parish as a substitute of a former community area. However she used only presence/absence evidence irrespective of the behavioural type of evidence, temporal uncertainties connected to the archaeological data as well as the size of the parishes. Nevertheless, the size of parishes is not the only challenge. Sampling intensity varied in space and time as substantial numbers of archaeological components were found during rescue excavations at large construction sites, and specific areas were of high interest for systematic surveys and excavations throughout the entire history of archaeology in the region. To tackle this issue, we developed the parish occupancy likelihood method, which connects the simulated time series with the shared spatial accuracy of all data (parish) while minimizing the distorting effects of sampling intensity and research history. Through the use of simulations with a fixed time resolution (in our case 500 and 250 years) rather than comparing unevenly temporarily distributed archaeological cultures, our probabilistic approach has the potential to provide a more reliable picture of patterns in past human activities.
What do these models indicate and what can they be used for? One of the most important advantages of our approach is that it results in a relatively simple model with quantified temporal uncertainty. This model shows not only the temporal dynamics of archaeological evidence, but also chronological uncertainties incorporated within the existing dating systems. Incorporating quantified temporal characteristics is beneficial because it integrates more information on time characteristics into the model. Through combining temporal probability and spatial certainty, it also moves a step further from the traditional procedures of mapping archaeological sites as points in geographical space with a simple graphic indication of their dating. Past human activities are represented in a continuous manner in our spatial models, which better corresponds to actual landscapes managed with different intensities by human communities. Our probabilistic spatial and temporal results can help archaeologists move away from interpreting human activities as points in time and space and foster a better understanding of the mutual relationships between human communities and landscapes.
An important question in recent archaeological research which reaches beyond the scope of this paper is whether the spatio-temporal dynamics of archaeological evidence mirrors population fluctuations, changes in settlement structure, different depositional behaviour, changes in land-use or agricultural systems (intensive vs. extensive), depletion of natural resources, social changes or research history. To work towards an answer, various parts of modelled scenarios, including those presented in this paper, can be compared to other proxy data (climate, vegetation history, archaeozoological data etc.). This multidisciplinary feedback (as suggested also by Crombé – Robinson 2014) can help with resolving issues connected not only to past human activities and their reflection in archaeology, but also to the mutual relationship of human societies and their environments.
Acknowledgements
We would like to express our gratitude to the staff of the archive of the Archaeological Institute ASCR Brno, namely Zdenka Kosarová, Veronika Laubová and Olga Lečbychová, and staff of the archive of the Archaeological Institute SAS Nitra, who kindly allowed us to study the excavation reports. We would also like to thank Jaromír Šmerda (Masaryk Museum in Hodonín), who kindly shared with us his knowledge on local archaeology. We also thank two anonymous reviewers for their helpful comments and suggestions. The research leading to these results has received funding from the European Research Council under the European Union’s Seventh Framework Programme (FP7/2007-2013) / ERC Grant agreement n° 278065. This study was supported as a long-term research development project no. RVO 67985939.
Footnotes
References
- Barta P, Demján P, Hladíková K, Kmet’ová P, Piatničková K. Archaeological Chronometry in Slovakia, Slovak Research and Development Agency Project No. APVV-0598-10, 2011 -2014. Dept. of Archaeology, Faculty of Arts, Comenius University in Bratislava; 2013. Database of radiocarbon dates measured on archaeological samples from Slovakia, Czechia, and adjacent regions. URL: < http://www.c14.sk>. [Google Scholar]
- Bevan A. Spatial methods for analysing large-scale artefacts inventories. Antiquity. 2012;86:492–506. [Google Scholar]
- Bevan A, Conolly J, Hennig C, Johnston A, Quercia A, Spencer L, Vroom J. Measuring chronological uncertainity in intensive survey finds: A case study from Antikythera, Greece. Archaeometry. 2013;55(2):312–328. [Google Scholar]
- Čižmář M, Geislerová K, editors. Výzkumy – Ausgrabungen 1999-2004. Ústav archeologické památkové péče Brno; Brno: 2006. [Google Scholar]
- Čižmář M, Geislerová K, Unger J, editors. Výzkumy – Ausgrabungen 1993-1998. Ústav archeologické památkové péče Brno; Brno: 2000. [Google Scholar]
- Contreras DA, Meadows J. Summed radiocarbon calibrations as a population proxy: a critical evaluation using a realistic simulation approach. Journal of Archaeological Science. 2014;52:591–608. [Google Scholar]
- Crema ER. Modelling Temporal Uncertainty in Archaeological Analysis. Journal of Archaeological Method and Theory. 2012;19(3):440–61. [Google Scholar]
- Crema ER, Bevan A, Lake MW. A probabilistic framework for assessing spatio-temporal point patterns in the archaeological record. Journal of Archaeological Science. 2010;37(5):1118–1130. [Google Scholar]
- Crombé P, Robinson E. 14C dates as demographic proxies in Neolithisation models of northwestern Europe: a critical assessment using Belgium and northeast France as a case-study. Journal of Archaeological Science. 2014;52:558–566. [Google Scholar]
- Dreslerová D. Human Response to Potential Robust Climate Change around 5500 cal BP in the Territory of Bohemia (the Czech Republic) Interdisciplinaria Archaeologica. Natural Sciences in Archaeology. 2012;III(1):43–55. [Google Scholar]
- Fisher R. The logic of inductive inference. Journal of the Royal Statistical Society. 1935;98(1):39–82. [Google Scholar]
- Green C. It’s about Time: Temporality and Intra-Site GIS; On the Road to Reconstructing the Past. Computer Applications and Quantitative Methods in Archaeology (CAA). Proceedings of the 36th International Conference; Budapest. April 2-6, 2008; Budapest: Archaeolingua; 2011a. pp. 206–211. http://proceedings.caaconference.org/paper/cd28_green_caa2008/. [Google Scholar]
- Green C. Winding Dali’s Clock : The Construction of a Fuzzy Temporal-GIS for Archaeology. Archaeopress; Oxford: 2011b. [Google Scholar]
- Hinz M, Feeser I, Sjögren K-G, Müller J. Demography and the Intensity of Cultural Activities: An Evaluation of Funnel Beaker Societies (4200–2800 cal BC) Journal of Archaeological Science. 2012;39(10):3331–3340. [Google Scholar]
- Hodder I, Orton C. Spatial Analysis in Archaeology. Cambridge University Press; Cambridge: 1976. [Google Scholar]
- Johnson I. Aoristic analysis: seeds of a new approach to mapping archaeological distributions through time. In: de Stadt Wien Magistrat, Erbe Referat Kulturelles, Wien Stadtarchäologie., editors. BAR International Series 1227; The E-way into the four dimensions of cultural heritage. CAA2003. Computer Applications and Quantitative Methods in Archaeology, proceedings of the 31st conference; Vienna, Austria. April 2003; Oxford: Archaeopress; 2004. pp. 448–452. [Google Scholar]
- Kuča M, Kovář JJ, Nývltová-Fišáková M, Škrdla P, Prokeš L, Vaškových M, Schenk Z. Chronologie neolitu na Moravě: předběžné výsledky. Přehled výzkumů. 2012;53(1):51–64. [Google Scholar]
- Kuna M, Dreslerová D. Landscape Archaeology and 'Community Areas' in the Archaeology of Central Europe. In: Hicks D, McAtackney L, Fairclough G, editors. Envisioning Landscape. Situations and Standpoints in Archaeology and Heritage. Left Coast Press; Walnut Creek: 2007. pp. 146–171. [Google Scholar]
- Kuna M, Křivánková D. Archiv 3.0. Systém Archeologické databáze Čech Uživatelská příručka. Archeologický ústav AV ČR v Praze; Praha: 2006. [Google Scholar]
- Longley PA. The academic success of GIS in geography: Problems and prospects. Journal of Geographical Systems. 2000;2:37–42. [Google Scholar]
- Mehrer MW, Wescott KL. GIS and Archaeological Site Location Modeling. CRC Press; London: 2006. [Google Scholar]
- Mischka D. Territorial Modelling and Archaeological Data: How Complete Must the Picture Be?. In: Posluschny A, Lambers K, Herzog I, editors. Layers of Perception. Proceeding of the 35th International Conference on Computer Applications and Quantitative Methods in Archaeology (CAA); Berlin. 2.-6. April 2007; Bonn: Kolloquien zur Vor- Und Frühgeschichte 10,Dr. Rudolf Habelt GmbH; 2008. pp. 1–7. [Google Scholar]
- Müller J. Typologieunabhängige Datierungen und die Rekonstruktion prähistorischer Gesselschaften. Archäologie in Sachsen-Anhalt. 2004;2:21–29. [Google Scholar]
- Nakoinz O. Datierungskodierung und chronologische Inferenz - Techniken zum Umgang mit unscharfen chronologischen Informationen. Praehistorische Zeitschrift. 2012;87(1):189–207. [Google Scholar]
- Neustupný E. Community areas of Prehistoric Farmers in Bohemia. Antiquity. 1991;65:326–331. [Google Scholar]
- Neustupný E. Structures and events: The theoretical basis of spatial archaeology. In: Neustupný E, editor. Space in prehistoric Bohemia. Institute of Archaeology, Academy of Sciences of the Czech Republic Praha; Praha: 1998a. pp. 9–44. [Google Scholar]
- Neustupný E. The transformation of community areas into settlement areas. In: Neustupný E, editor. Space in prehistoric Bohemia. Institute of Archaeology, Academy of Sciences of the Czech Republic Praha; Praha: 1998b. pp. 45–61. [Google Scholar]
- Poláček L, editor. Studien zum Burgwall von Mikulčice Band 2. Archäologisches Institut der Akademie der Wissenschaften der Tschechischen Republik Brno; Brno: 1997. [Google Scholar]
- Polácek L, editor. Studien zum Burgwall von Mikulcice Band 3. Archäologisches Institut der Akademie der Wissenschaften der Tschechischen Republik Brno; Brno: 1998. [Google Scholar]
- Poláček L, editor. Studien zum Burgwall von Mikulčice. Band 4. Archäologisches Institut der Akademie der Wissenschaften der Tschechischen Republik Brno; Brno: 1999. [Google Scholar]
- Poláček L, editor. Studien zum Burgwall von Mikulčice. Band 6. Archäologisches Institut der Akademie der Wissenschaften der Tschechischen Republik Brno; Brno: 2005. [Google Scholar]
- R Development Core Team. R: A language and environment for statistical computing. R Foundation for Statistical Computing; Vienna, Austria: 2011. [Google Scholar]
- Ratcliffe JH. Aoristic analysis: the spatial interpretation of unspecific temporal events. International Journal of Geographical Information Science. 2000;14(7):669–79. [Google Scholar]
- Roberts BW, Vander Linden M, editors. Investigating Archaeological Cultures: Material Culture,Variability, and Transmission. Springer; New York: 2011. [Google Scholar]
- Shennan S, Downey SS, Timpson A, Edinborough K, Colledge S, Kerig T, Manning K, Thomas MG. Regional population collapse followed initial agriculture booms in mid-Holocene Europe. Nature Communications. 2013;4:1–8. doi: 10.1038/ncomms3486. [DOI] [PMC free article] [PubMed] [Google Scholar]
- Sibson R. Interpolating Multivariate Data. John Wiley & Sons; New York: 1981. A Brief Description of Natural Neighbor Interpolation; pp. 21–36. [Google Scholar]
- Walker M. Quaternary Dating Methods. John Wiley & Sons, Ltd; Chichester: 2005. [Google Scholar]
- Watson D. Contouring: A Guide to the Analysis and Display of Spatial Data. Pergamon Press; London: 1992. [Google Scholar]
- Whitehouse NJ, Schulting RJ, McClatchie M, Barrat P, McLaughlin TR, Bogaard A, Colledge S, Marchant R, Gaffrey J, Bunting MJ. Neolithic agriculture on the European western frontier: the boom and bust of early farming in Ireland. Journal of Archaeological Science. 2014;51:181–205. [Google Scholar]


