

Abstract
In radiation treatment planning, the esophagus is an important organ-at-risk that should be spared in patients with head and neck cancer or thoracic cancer who undergo intensity-modulated radiation therapy. However, automatic segmentation of the esophagus from CT scans is extremely challenging because of the structure’s inconsistent intensity, low contrast against the surrounding tissues, complex and variable shape and location, and random air bubbles. The goal of this study is to develop an online atlas selection approach to choose a subset of optimal atlases for multi-atlas segmentation to delineate esophagus automatically. We performed atlas selection in 2 phases. In the first phase, we used the correlation coefficient of the image content in a cubic region between each atlas and the new image to evaluate their similarity and to rank the atlases in an atlas pool. A subset of atlases based on this ranking was selected, and deformable image registration was performed to generate deformed contours and deformed images in the new image space. In the second phase of atlas selection, we used Kullback-Leibler divergence to measure the similarity of local-intensity histograms between the new image and each of the deformed images, and the measurements were used to rank the previously selected atlases. Deformed contours were overlapped sequentially, from the most to the least similar, and the overlap ratio was examined. We further identified a subset of optimal atlases by analyzing the variation of the overlap ratio versus the number of atlases. The deformed contours from these optimal atlases were fused together using a modified Simultaneous Truth and Performance Level Estimation algorithm to produce the final segmentation. The approach was validated with promising results using both internal datasets (21 head and neck cancer patients and 15 thoracic cancer patients) and external datasets (30 thoracic patients).
Keywords: Atlas selection, multi-atlas segmentation, esophagus, radiotherapy
1. Introduction
The esophagus is an important organ-at-risk that should be spared in patients with head and neck cancer or thoracic cancer who undergo intensity-modulated radiation therapy (IMRT). Manual delineation of the esophagus is labor intensive and frequently subject to intra- or inter-observer variability (Geets et al., 2005; Collier et al., 2003; Yang et al., 2014). In thoracic cancer patients, the contours of the esophagus should be drawn from the inferior edge of the cricoid cartilage to the esophagogastric junction, accounting for about 90 slices of CT images with 2.5-mm slice spacing. Because of the low contrast of the esophagus against the surrounding tissues, especially in the vicinity of the heart, it is very difficult to correctly identify the esophageal boundary.
Several attempts have been made to automate the contouring process for the esophagus. However, automatic segmentation of the esophagus, unlike most other structures, is extremely challenging. The esophagus is a long thin structure with an inconsistent appearance and low contrast against surrounding tissues on CT images. It also frequently contains random air bubbles. For these reasons, intensity-based segmentation approaches may not be appropriate for delineating this structure automatically. In addition, because the esophagus is not rigid, its shape and location in the body can vary considerably from day to day and person to person, making it difficult to use model-based segmentation approaches. Atlas-based segmentation approaches may also be challenging because of substantial inter-person variability.
A few studies have been devoted to the automatic segmentation of the esophagus and most of them used either shape or appearance model to guide the segmentation (Rousson et al., 2006; Fieselmann et al., 2008a; Feulner et al., 2011; Kurugol et al., 2011; Grosgeorge et al., 2013; Kurugol et al., 2010; Feulner et al., 2009). However, training the models is difficult, and their robustness is unclear. Rousson et al. (Rousson et al., 2006) used a 2D ellipse-shaped model with a centerline of the esophagus to segment the esophagus on each slice. A regularization term was imposed to force a smooth transition between slices. However, esophageal centerline detection relied on the neighboring left atrium structure, which limited the segmentation to the slices that included the left atrium. Feulner et al. (Feulner et al., 2011) used a discriminative model of the appearance to detect the esophagus in a 2D slice and a hidden Markov model to smooth slice-to-slice transitions. Their approach required a large amount of training data to handle the variable appearance of the esophagus as a result of the presence of air pockets or contrast agent. Kurugol et al. (Kurugol et al., 2010) proposed to initialize a model-based 3D level set esophagus segmentation method with a principal curve-tracing algorithm to detect the esophagus centerline. A shape model was then incorporated into the 3D level set algorithm to locate the esophageal wall. This approach also required a large amount of training datasets to address appearance variations and complicated shape representation.
To the best of our knowledge, no atlas-based segmentation approach has been used for esophagus segmentation, possibly because of the substantial inter-subject variability. However, recently, multi-atlas segmentation has been shown to minimize the effects of variability and improve segmentation accuracy, especially for low-contrast anatomy such as the brachial plexus (Chen et al., 2012; Klein et al., 2008; Yang et al., 2013; Sjoberg et al., 2013; Kirisli et al., 2010; Isgum et al., 2009). Multi-atlas segmentation exploits contoured atlas data for the auto-segmentation of new patient images. Deformable image registration is a key to mapping contours from the atlases to new patients. The individual deformed contours from multiple atlases are then effectively combined to produce the best approximation of the true segmentation through various fusion approaches (Warfield et al., 2004; Langerak et al., 2010; Sabuncu et al., 2010; Ramus and Malandain, 2010).
Although multi-atlas segmentation can reduce inter-subject variability, a few bad atlases may still greatly adversely affect segmentation accuracy. In general, a fixed set of atlases might not be able to achieve optimal segmentation results. To improve segmentation accuracy, it is necessary to identify a subset of optimal atlas candidates that are most similar to the new image for multi-atlas segmentation. Unlike other atlas selection approaches (Aljabar et al., 2009; Shen et al., 2011; Wu et al., 2007; Rohlfing et al., 2004; Yang et al., 2010; Langerak et al., 2011), our selection process is completed on the fly when a new image is given. Online atlas selection has not been widely studied. Some offline atlas selection strategies require deformable registration (Rohlfing et al., 2004; Wu et al., 2007; Shen et al., 2011). This is impractical for online selection from a large database because of the time required for deformable registration. In addition, offline selection strategy may not render optimal atlases for a given new image.
In this study, we developed a 2-phase online atlas selection approach to rank and select a subset of optimal atlas candidates, in terms of local anatomical similarity, for multi-atlas segmentation of the esophagus on CT scans. In the first phase of atlas selection, the correlation coefficient of the image content in a local region between the atlas and the new image was used to evaluate their similarities and to rank the atlases. A subset of atlases based on this ranking was selected, and deformable image registration was performed to generate deformed contours and deformed images in the new image space. In the second phase of atlas selection, we used the Kullback-Leibler divergence to measure the similarity of local-intensity histograms between the new image and each deformed image; the measurements were used to rank the previously selected atlases. Deformed contours from the most to the least similar were added sequentially, and the overlap ratio was examined. We further identified a subset of optimal atlas candidates by analyzing the variation of the overlap ratio with the number of atlases. The deformed contours from these optimal atlases were fused to produce the final segmentation. This approach was applied to esophagus segmentation for treatment planning in both head and neck and thoracic cancer patients undergoing radiation treatment.
2. Methods
2.1. Patient data
This study was approved by the institutional review board of The University of Texas MD Anderson Cancer Center. Two sets of patient data were retrospectively selected from our institution for this study. The first set included 21 patients with stage IV head and neck squamous cell carcinoma who had been treated with IMRT. The planning CT images of these patients had been acquired and the cervical esophagus had been contoured from the inferior edge of the cricoid cartilage down to the level of the manubrium by an experienced head and neck radiation oncologist. The second set included 15 stage II-IIIB non-small cell lung cancer patients who had been treated with definitive concurrent chemoradiation. These patients had undergone 4DCT for radiation treatment planning; end-of-exhalation phase CT images were used in this study. The esophageal contour had been drawn from the inferior edge of the cricoid cartilage to the esophagogastric junction by an experienced thoracic radiation oncologist. All CT images used in this study had an in-slice resolution of 1.0 mm and a slice spacing of 2.5 mm.
In addition, 30 sets of 3D CT images used in an esophagus segmentation challenge provided by Varian Medical Systems were used in this study for further validation. These images represent horizontal slices (relative to a standing person) at varying inter-slice spacing through the esophageal region of the human body. Of the 30 datasets, spacing between slices ranges from 0.7 mm to 3 mm and the number of image slices ranges from 103 to 559. In-slice resolution for all of the images is within 1 mm (range: 0.57 mm - 0.96 mm). These images include both feet-first supine and head-first supine scans. Some images were taken using contrast agents but some were not. Experts drew the esophageal contours on all of the 30 datasets.
2.2. Online atlas selection for multi-atlas segmentation
An overall framework of our online atlas selection approach for esophagus segmentation is illustrated in Figure 1. In brief, we first performed rigid alignment between all atlas images and the test image to define a small local region; a first-phase of atlas selection was performed on the basis of the similarity measurement in the local region. In the first phase of atlas selection, we chose 12 or fewer atlases and performed deformable image registration between the atlases and the test image to generate deformed contours and images. A second phase of atlas selection was performed by measuring the similarity of the deformed image and the test image in a region of interest (ROI), as defined by the deformed contours. The deformed contours of selected optimal atlases were then fused together to produce the final segmentation. A detailed description of our approach follows.
Figure 1.

Overall framework of the proposed online atlas selection approach for esophagus segmentation.
2.2.1. First phase of atlas selection
The first phase of atlas selection filters out bad atlases and limits the number of atlases for subsequent deformable image registration. This prescreening step avoids wasting time on the deformable registration of bad atlases and reduces the adverse impact of bad atlases on contour fusion. Rigid alignment is a prerequisite for this step. We performed rigid alignment between each atlas and the test image by minimizing the mean square errors of two 2D images generated from the 3D CT images, which were projected in sagittal and coronal views to obtain two 2D images. The rigid alignments were performed separately on these two 2D images using a gradient decent optimizer, and then further optimized with golden section search and parabolic interpolation (Forsythe et al., 1976) to find the optimal translations in all three directions that gave the minimal mean square error of the two registered 2D images. On the other hand, a landmark point was predefined in each atlas to record the relative shift between two atlases. In head and neck cancer patients, the landmark point was chosen in the cord of the superior end of C2 vertebrate; while in thoracic cancer patients, it was chosen in the cord of the slice where the bottom of the aortic arch is located, as shown in Figure 2. In the automated rigid alignment, the rigid shift between the test image and the atlas of minimal mean square errors was recorded. The rigid shift of the test image and each of other atlases was derived from the recorded rigid shift and the relative shift between atlases.
Figure 2.

Illustration of landmark points in the atlases. Panel (I): For head and neck cancer patients, the landmark point is in the cord of the superior end of C2 vertebrate. Panel (II): For thoracic cancer patients, the landmark point is in the cord of the slice where the bottom of the aortic arch is located.
The similarity of 2 images was measured in a small cubic region using the correlation coefficient of the image-intensity values in the region. This cubic region is determined as follows: after rigid alignment, all atlas contours were transformed to the test image space. The bounding box of all transformed contours was determined and formed a cubic region, which was transformed back to each atlas space to obtain the local region for each atlas. The correlation coefficient between the test image and the atlas image in the corresponding cubic regions was calculated for each atlas. Twelve atlases of the largest correlation coefficient values were selected. Our previous study (Zhou et al., 2017) found that the contour fusion might not benefit from more than 12 atlases; therefore, we chose no more than 12 atlases for the next step to perform deformable registration. We removed those with a correlation coefficient less than 0.2 if the total number of atlases was not less than 6.
2.2.2. Deformable image registration
We used an intensity-based approach for the CT-to-CT deformable registration because Hounsfield units of CT images are calibrated to the attenuation coefficient of water so that the intensity value is consistent among images. Specifically, we used a dual-force Demons algorithm (Wang et al., 2005) for the deformable registration between the test and atlas images. Before performing the deformable registration, we performed histogram equalization to match the contrast of the 2 images. The histogram equalization was performed locally by separating the images into small blocks. A multiresolution scheme was used to accelerate the registration and improve the robustness of the registration. The parameter settings for the deformable registration are specified in Table 1. Refer to Wang et al. (Wang et al., 2005) for details about this deformable registration algorithm.
Table 1.
Parameter settings for the dual-force Demons deformable image registration
| Parameter | Value |
|---|---|
| Number of bins for histogram equalization | 256 |
| Block size for histogram equalization | 20 |
| Multi-resolution levels | 6 |
| Number of iterations | 200 |
| Upper bound of step size | 1.25 |
| Gaussian variance for regularization | 1.5 |
The deformable registration produced a deformation vector field (DVF) pointing from the atlas image to the test image. This DVF was used to deform the atlas image, generating a deformed image in the test image space that was used for the second phase of atlas selection. The DVF was also used to deform the atlas contours to the test image space. To achieve accurate contour deformation, the 2D slice stacks of atlas contours were first converted to a closed triangular mesh (Yang et al., 2010). The DVF was interpolated to obtain a deformation vector at each vertex of the triangular mesh and the vertex was moved along the deformation vector to the new location to complete the deformation. After the deformation, the triangular mesh was converted back to a group of slice stacks of contours by cutting through the mesh using an axial plane, slice by slice, resulting to the deformed contours in the test image space. This process is similar to the work presented in (Lu et al., 2006).
2.2.3. Second phase of atlas selection
The second phase of atlas selection was performed on the basis of the aforementioned deformed images and contours. First, the union of the deformed contours was expanded by 1 mm using morphological dilation to define an irregular local region. A local-intensity histogram was created on the basis of the voxels in the local region for the test image and deformed image, respectively, as shown in Figure 3. This intensity histogram was created with 64 bins. We used the symmetric Kullback-Leibler (KL) divergence to evaluate the similarity between the 2 histograms. Letting P(i) denote the intensity histogram of the deformed image, where i = 1, 2, …, 64 indices the histogram bins, and letting Q(i) denote the intensity histogram of the test image, the symmetric KL divergence can be calculated as:
| (1) |
The KL divergence was measured for each atlas selected in phase one and the measured KL divergence values were used to rank the atlases from the most similar to the least.
Figure 3.

Illustration of using the Kullback-Leibler (KL) divergence to evaluate the similarity of the deformed image and the test image to rank the atlas in the second phase of atlas selection.
After ranking the atlases, we examined the overlap ratio of the deformed contours by sequentially overlapping atlases from the most to the least similar. The Jaccard coefficient was used to compute the overlap ratio. Letting Ai denote the volume of the ith deformed contour for i = 1, 2,…, N, with N being the number of atlases selected in phase one, the Jaccard coefficient for a number of n overlapped deformed contours is defined as:
| (2) |
The values of the overlap ratio were plotted versus the number of atlases, as shown in Figure 4. We analyzed the overlap ratio curve to further determine a subset of optimal atlases. The fundamental assumption of atlas selection in this step is that the deformed contours from different atlases should be consistent for the later contour fusion. If a less similar atlas produces a deformed contour that is largely off from the contours produced by more similar atlases, this deformed contour should not be used for contour fusion. On the basis of this principle, we developed the following atlas selection rules:
Figure 4.

The Jaccard coefficient was used as the overlap ratio, which is defined as the intersection divided by the union of all contours. The overlap ratio was plotted as a function of the number of atlases. This example shows that using more than 5 atlases may not benefit multi-atlas segmentation because the overlap ratio reaches a small value.
-
1)
If Jaccard(n0)≥0.5, select at least a number of n0 top-ranked atlases.
-
2)
If Jaccard(n)<0.2 for any n > n1, discard all atlases ranked beyond n1.
-
3)
Detect continuous steep slopes of the overlap ratio curve. If a)atan[Jaccard(n2-1)-Jaccard(n2)]>30° , b) atan[Jaccard(n2)-Jaccard(n2+1)]>30°, and c)Jaccard(n2+1)<0.3, discard all atlases ranked beyond n2
-
4)
Keep at least 5 atlases for contour fusion. This rule overrides the above rules.
Using these rules, a subset of optimal atlases was further identified from the atlases selected in phase one. In the example shown in Figure 4, our analysis selected 5 optimal atlases for contour fusion. The small overlap ratio values beyond the rank of 5 imply that those atlases are not consistent with the most similar atlas. This inconsistency can possibly deteriorate the contour fusion process.
2.2.4. Contour fusion
The deformed contours of the selected optimal atlases were fused to produce the final segmentation. The contour fusion process took advantage of the Simultaneous Truth and Performance Level Estimation (STAPLE) algorithm (Warfield et al., 2004). The STAPLE algorithm is based on the maximum likelihood estimates of the true positive and false negative of individual segmentations. It estimated the best agreement among individual segmentations and produced a fusion contour that was the expected truth of the segmentation. The fusion process potentially allows us to minimize variations among segmentations obtained from different atlases and random errors in deformable image registration. However, the STAPLE algorithm does not take into account the intensity information of the tissue to be segmented. Its performance solely depends on the individual segmentation performance. To address this issue, we created a tissue appearance model (TAM) and integrated it into the STAPLE fusion process. Specifically, the STAPLE algorithm requires providing the prior probability of true segmentation Ti for each voxel i when initializing the algorithm. In our implementation, the prior probability was initialized as
| (3) |
where Ti = 1 means voxel i belonging to the structure, R(i) is the probability of voxel i belonging to the structure determined by individual segmentations, and S(i) is the probability of voxel i belonging to the structure determined by a TAM. The parameter w is the weight to balance these 2 terms. The R(i) is defined as
| (4) |
where Dij denotes the jth segmentation at voxel i that does (Dij = 1) or does not belong to the structure (Dij = 0). The TAM is a Gaussian model estimated from the test image as
| (5) |
where I(i) is the intensity value of voxel i, Z is a normalization factor, and the mean μp and variance are estimated from voxels in the union region of individual segmentations. In our implementation, we set the weight w = 0.8 for thoracic cancer patients to properly exclude the wrongly segmented lung tissue or high-contrast aorta tissue. For head and neck cancer patients, we set w = 0.5. A threshold of 0.5 was set to produce the final binary segmentation from the STAPLE fuzzy segmentation. If the number of atlases for contour fusion was less than 6, the fusion approach was switched to majority voting with the TAM. Essentially, the binary thresholding was applied directly to the outcome of Eq. (3).
2.3. Evaluation metrics
We compared auto-segmented contours with manual contours using the Dice similarity coefficient (DSC), mean surface distance (MSD), and Hausdorff distance (HD) as the quantitative evaluation. The DSC between the 2 volumes, R and T, is defined as the ratio of the volume of their intersection to their mean volume (Dice, 1945):
| (6) |
The DSC has a value between 0 and 1, with 1 indicating perfect agreement and 0 indicating no overlap. The MSD between the 2 contours, R and T, is defined using the Euclidean distance mapping method (Danielsson, 1980):
| (7) |
A smaller MSD value means better agreement between the 2 contours. Hausdorff distance measures the maximum distance between contours, R and T, as
| (8) |
2.4. Esophagus segmentation for head and neck cancer patients
The proposed multi-atlas segmentation with online atlas selection (MAS-AS) approach was used to delineate the esophagus contours in 21 head and neck cancer patients. We used a leave-one-out approach for validation. Each of the 21 patients was used as the test patient, and the remaining 20 patients were put in the atlas pool to delineate the test patient. The MAS-AS approach automatically determined a subset of optimal atlases from the 20 atlases for auto-segmentation. The auto-segmented contours were compared with the manual contours using the DSC and MSD metrics. The means and standard deviations of the values were calculated for the 21 tests. In addition, we randomly selected 8 patients as a fixed set of atlases and performed multi-atlas segmentation (MAS) for the remaining 13 patients. No atlas selection was performed, but we used the same rigid alignment, deformable image registration, and contour fusion described in Section 2.2. The auto-segmentation results of these 13 patients were evaluated with DSC and MSD metrics and compared with those using the MAS-AS approach. The difference between the MAS-AS approach and the MAS approach was tested for statistical significance using a 2-tailed, paired t-test, evaluated at the 0.05 significance level.
2.5. Esophagus segmentation for thoracic cancer patients
The proposed MAS-AS approach was further validated using 15 thoracic cancer cases. Again, we used the leave-one-out approach for validation. Each of the 15 patients was used as the test patient, and the remaining 14 patients were put in the atlas pool to delineate the test patient. The auto-segmented contours were compared with the manual contours using the DSC and MSD metrics. The means and standard deviations of the values were calculated for the 15 tests. In addition, we plotted a histogram to show the distribution of the 21 head-and-neck tests and the 15 thoracic tests for the DSC and MSD values, respectively.
2.6. Validation using external data
The proposed MAS-AS algorithm was validated using the 30 CT datasets for the esophagus segmentation challenge. The 30 CT images were reformatted to have the same in-slice resolution of 0.78mm and slice spacing of 2.5mm for all 30 datasets. The orientation was forced to be feet-first supine for all images. The expert-drawn contours were also reformatted to be shown on each slice of the reformatted images. The auto-segmentation were performed on the reformatted data. When evaluating the segmentation results, we reformatted the auto-segmented contours back to the original data resolution for quantitative comparison. We performed leave-one-out tests by using one dataset as test image and the other 29 datasets as atlases. The auto-segmented contours were compared with the manual contours using the DSC and MSD metrics. The means and standard deviations of the values were calculated for the 30 tests.
3. Results
3.1. Atlas ranking and selection
One leave-one-out test for the head and neck cancer patients was used to illustrate the efficiency of atlas ranking and selection. The test patient had a large air pocket inside the esophagus, which made it appear different from most atlases. The first phase of atlas selection identified 12 atlases, and their contours were deformed to the test patient, compared with the manual contour, as shown in Figure 5. In the second phase of atlas selection, the symmetric KL divergence of local-intensity histograms ranked atlases 12, 8, and 10 as the first, second, and third best atlases, which was consistent with our observation, as shown in Figure 5. The overlap ratio analysis for the 12 atlases is shown in Figure 4. In this analysis, a subset of 5 optimal atlases was further identified for contour fusion on the basis of the atlas selection rules. By comparing the auto-segmented contour generated from the 5 optimal atlases with the manual contour, we found a DSC of 0.67 and a MSD of 2.3 mm; the segmentation generated from the 12 atlases, without performing a second phase of atlas selection, had values of 0.31 and 4.0 mm, respectively. A subjective comparison is illustrated in Figure 6. It shows much better agreement between the auto-segmented contour and the manual contour for the approach using atlas selection than for the approach without atlas selection.
Figure 5.

Esophagus contours of 12 atlases were deformed to the test image. The red and green colors indicate deformed and manual contours, respectively. In the second phase of atlas selection, atlases 12, 8, and 10 were chosen as the first, second, and third best atlases, which is consistent with the observation: they have a better agreement between the manual contour and the deform contour than other atlases do.
Figure 6.
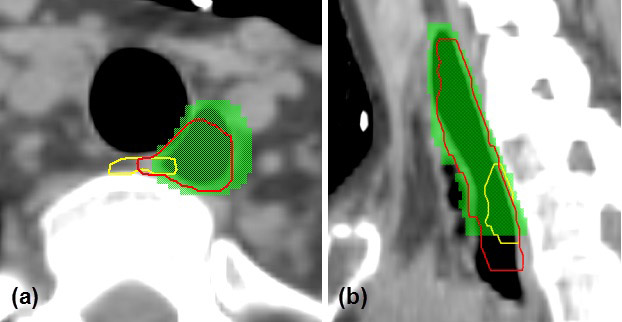
Comparison of auto-segmentation using 5 selected optimal atlases (red contour) versus that using 12 atlases without the second phase of atlas selection (yellow contour). Green colorwash indicates the manual contour. (a) Axial view; (b) sagittal view.
3.2. Esophagus segmentation for head and neck cancer patients
Table 2 shows the results of the leave-one-out tests of the proposed MAS-AS approach compared with the MAS approach, as applied to 21 head and neck cancer patients. The MAS-AS approach resulted in a mean DSC of 0.70 ± 0.07 and a mean MSD of 1.9 mm ± 0.7 mm. For the MAS approach, patients 14–21 were used as a fixed set of atlases to delineate the esophagus for the first 13 patients. In these 13 tests, the MAS approach achieved a mean DSC of 0.55 ± 0.15 and a mean MSD of 2.5 mm ± 0.9 mm. The results for the first 13 patients were tested to determine whether a statistically significant difference existed between the MAS-AS and MAS approaches. Significantly different DSCs and MSDs were found for these 2 approaches (p-value of 0.005 for DSC and 0.022 for MSD). The mean DSC and mean MSD for the MAS-AS approach applied to the first 13 patients were 0.69 ± 0.08 and 2.0 mm ± 0.7 mm, respectively. These results were better than those of MAS approach. The DSCs and MSDs for patients 2, 6, 9, 10, and 11 showed significant improvement with the MAS-AS approach. However, we observed that the MAS-AS approach was slightly inferior to the MAS approach in some patients in terms of the DSC and MSD evaluation. In addition, we reported in Table 2 the best overlap value from a single atlas in order to validate the deformable registration algorithm used in the proposed MAS-AS approach. The overlap values were measured between the deformed contour from each atlas and the best result were reported. These results showed reasonable agreements between the manual contour and the deformed contour thus justifying the use of the deformable registration algorithm.
Table 2.
Segmentation results of the proposed multi-atlas segmentation with the online atlas selection (MAS-AS) approach compared with the multi-atlas segmentation with a fixed set of atlases (MAS) approach in 21 head and neck cancer patients. The column of “Single Atlas” reported the best result from a single atlas-based segmentation, which serves for the validation of deformable registration algorithm used in MAS-AS. The MAS approach used patients 14-21 as atlases to delineate the esophagus for the first 13 patients. SD = standard deviation.
| Patient no. |
Dice similarity coefficient | Mean surface distance (mm) | ||||
|---|---|---|---|---|---|---|
| MAS-AS | MAS | Single Atlas | MAS-AS | MAS | Single Atlas | |
| 1 | 0.61 | 0.56 | 0.61 | 2.1 | 2.7 | 2.1 |
| 2 | 0.67 | 0.41 | 0.70 | 2.4 | 3.2 | 2.1 |
| 3 | 0.65 | 0.56 | 0.61 | 2.1 | 2.2 | 2.0 |
| 4 | 0.77 | 0.78 | 0.69 | 1.6 | 1.5 | 3.0 |
| 5 | 0.56 | 0.40 | 0.63 | 3.7 | 3.9 | 3.1 |
| 6 | 0.78 | 0.49 | 0.71 | 1.1 | 1.5 | 1.5 |
| 7 | 0.74 | 0.74 | 0.71 | 2.1 | 2.1 | 2.2 |
| 8 | 0.61 | 0.63 | 0.60 | 2.9 | 2.6 | 2.0 |
| 9 | 0.76 | 0.54 | 0.68 | 1.4 | 2.2 | 2.1 |
| 10 | 0.67 | 0.22 | 0.72 | 2.3 | 4.5 | 1.9 |
| 11 | 0.72 | 0.60 | 0.74 | 1.5 | 2.1 | 1.4 |
| 12 | 0.59 | 0.53 | 0.64 | 1.9 | 2.3 | 1.5 |
| 13 | 0.77 | 0.73 | 0.91 | 1.3 | 1.4 | 0.6 |
| 14 | 0.81 | - | 0.74 | 1.3 | - | 1.8 |
| 15 | 0.72 | - | 0.73 | 1.6 | - | 1.7 |
| 16 | 0.65 | - | 0.56 | 2.6 | - | 3.4 |
| 17 | 0.70 | - | 0.67 | 1.7 | - | 1.7 |
| 18 | 0.79 | - | 0.78 | 1.6 | - | 1.3 |
| 19 | 0.69 | - | 0.44 | 1.8 | - | 3.5 |
| 20 | 0.78 | - | 0.70 | 1.1 | - | 1.7 |
| 21 | 0.65 | - | 0.57 | 2.7 | - | 3.3 |
| Median | 0.70 | 0.56 | 0.69 | 1.8 | 2.2 | 2.0 |
| Mean | 0.70 | 0.55 | 0.67 | 1.9 | 2.5 | 2.1 |
| SD | 0.07 | 0.15 | 0.09 | 0.7 | 0.9 | 0.8 |
3.3. Esophagus segmentation for thoracic cancer patients
Table 3 shows the results of the 15 leave-one-out tests of the proposed MAS-AS approach applied to 15 thoracic cancer patients. The results showed that the MAS-AS approach achieved a mean DSC of 0.73 ± 0.07, a mean MSD of 2.2 mm ± 0.8 mm and a mean HD of 16.9 mm ± 8.9 mm. Figure 7 illustrates the comparison of the auto-segmented contours with the manual contour for one patient in several slices. Good agreement was observed, even for slices with a large air pocket. Figure 8 shows the distribution of the DSC and MSD values in the 36 tests for both head and neck and thoracic cancer patients. Most tests had a DSC value between 0.6 and 0.8 and an MSD value between 1.0 mm and 2.0 mm. The cumulative histogram shows that 53% of the tests had a DSC value greater than or equal to 0.7 and that 86% of the tests had an MSD value smaller than or equal to 3.0 mm.
Table 3.
Segmentation results of the proposed multi-atlas segmentation with the online atlas selection approach in 15 thoracic cancer patients. SD = standard deviation.
| Patient no. | Dice similarity coefficient |
Mean surface distance (mm) |
Hausdorff distance (mm) |
|---|---|---|---|
| 1 | 0.79 | 1.8 | 13.3 |
| 2 | 0.66 | 3.1 | 26.8 |
| 3 | 0.82 | 1.3 | 6.4 |
| 4 | 0.78 | 1.7 | 9.5 |
| 5 | 0.67 | 2.8 | 23.3 |
| 6 | 0.63 | 3.5 | 30.2 |
| 7 | 0.77 | 1.6 | 10.1 |
| 8 | 0.73 | 2.0 | 12.7 |
| 9 | 0.58 | 3.8 | 31.6 |
| 10 | 0.79 | 1.5 | 8.1 |
| 11 | 0.68 | 3.0 | 30.8 |
| 12 | 0.81 | 1.6 | 12.7 |
| 13 | 0.83 | 1.3 | 9.2 |
| 14 | 0.77 | 1.5 | 9.3 |
| 15 | 0.67 | 2.7 | 19.1 |
| Median | 0.77 | 1.8 | 12.7 |
| Mean | 0.73 | 2.2 | 16.9 |
| SD | 0.07 | 0.8 | 8.9 |
Figure 7.

Illustration of auto-segmented contours (red) compared with manual contours (green) for one thoracic patient in several slices. Good agreement was observed in most of the slices.
Figure 8.
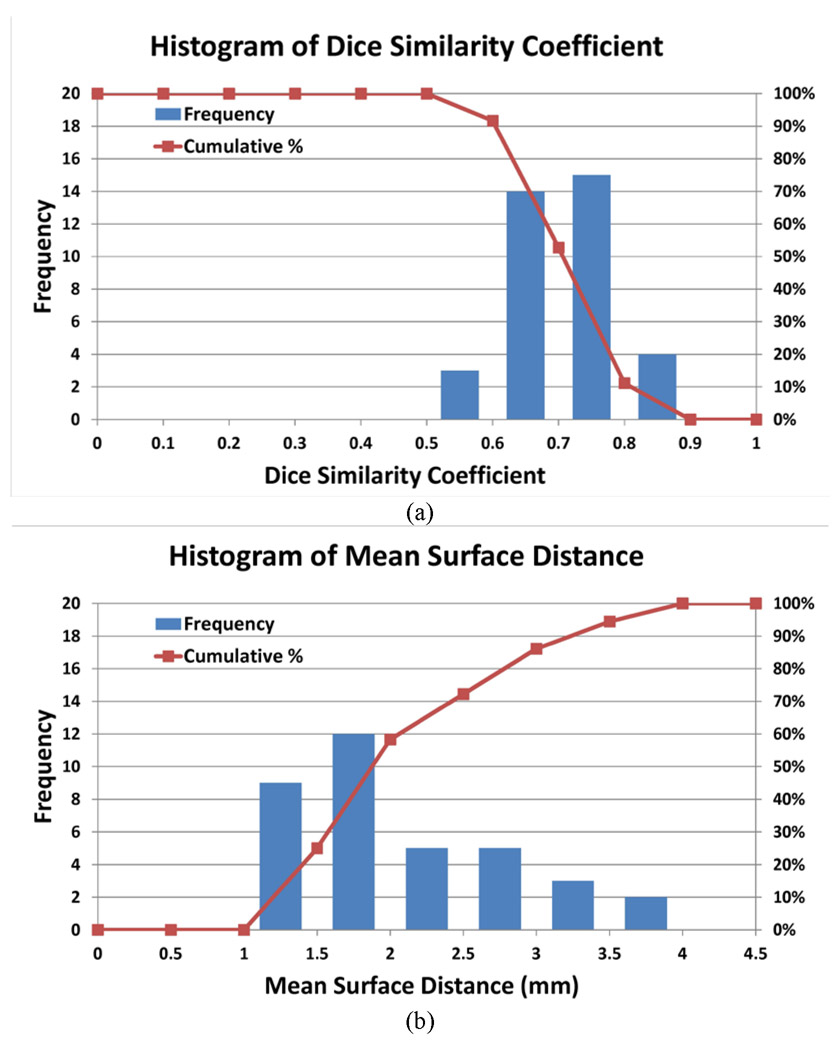
Histogram of (a) Dice similarity coefficient (DSC) and (b) mean surface distance (MSD) values of 36 tests in head and neck and thoracic cancer patients. The curve shows the cumulative histogram: for the DSC, the percentage of tests greater than or equal to a specific DSC value, and for MSD, the percentage of tests smaller than or equal to a specific MSD value.
3.4. Validation using external data
Of the 30 leave-one-out tests using the external data, the DSC values range from 0.585 to 0.817 with the median of 0.744 and an average of 0.728 ± 0.057; the MSD values range from 1.4 mm to 2.8 mm with the median of 1.9 mm and an average of 2.0 mm ± 0.4 mm; the HD values range from 7.9 mm to 27.1 mm with the median of 13.9 mm and an average of 14.5 mm ± 4.1 mm. Figure 9 shows the comparison between the auto-segmented contours and the expert-drawn contours for one of the test cases. Good agreement was observed. It is worth mentioning that the 30 external datasets are heterogeneous in terms of the scanning protocol, with both contrasted and noncontrasted scans and varied scanning extent, field of view, and slice spacing. They represents a good set of data to evaluate our proposed MAS-AS approach.
Figure 9.

Illustration of auto-segmented contours (red) compared with manual contours (yellow) on several slices for one test case in the external validation data.
We further compared our approach with other state-of-the-art methods in literature for esophagus segmentation. In particular, we compared with the level-set methods (Kurugol et al., 2010; Kurugol et al., 2011) and the probabilistic model based methods (Feulner et al., 2009; Feulner et al., 2011). The validation datasets and the evaluation results were listed in Table 4. The performance of these methods was comparable. Our proposed approach was slightly better than the level-set method (Kurugol et al., 2011) while slight inferior to the probabilistic model based method (Feulner et al., 2011). However, our proposed approach showed much smaller standard deviation than the probabilistic model based method; it was partially due to a smaller number of test cases, but our proposed approach potentially was more robust in handling extreme cases.
Table 4.
Comparison of our proposed multi-atlas segmentation with the online atlas selection (MAS-AS) method with other state-of-the-art methods in literature for esophagus segmentation. DSC = Dice similarity coefficient; MSD = mean surface distance; HD = Hausdorff distance.
| Method | Fully automatic |
Validation data | Metrics | ||||
|---|---|---|---|---|---|---|---|
| No. datasets |
Resolution (mm) |
Slice thickness (mm) |
DSC | MSD (mm) |
HD (mm) | ||
| Proposed MAS-AS | Yes | 30 | 0.57 – 0.96 | 0.7 – 3.0 | 0.73 ± 0.06 | 2.0 ± 0.4 | 14.5 ± 4.1 |
| (Kurugol et al., 2010) | No | 8 | 0.98 | 3.75 | unknown | 2.6 ± 2.1 | unknown |
| (Kurugol et al., 2011) | No | 8 | 0.98 | 3.75 | unknown | 2.1 ± 1.9 | unknown |
| (Feulner et al., 2009) | Yes | 117 | 0.72 | 5.0 | unknown | 2.3 ± 1.6 | 14.5 |
| (Feulner et al., 2011) | Yes | 144 | 0.7–0.8 | 5.0 | 0.74 ± 0.14 | 1.8 ± 1.2 | 12.6 ± 7.0 |
4. Discussion
In this study, we developed an atlas ranking and selection approach to be used together with multi-atlas segmentation for the automatic delineation of the esophagus on CT scans. This approach selects a subset of optimal atlas candidates from an atlas pool for multi-atlas segmentation on the basis of local anatomy, thus potentially reducing the adverse impact of inter-subject variability on multi-atlas segmentation and improving the segmentation accuracy. This approach was evaluated on esophagus segmentation for both head and neck and thoracic cancer patients with promising results. Our findings may have a positive impact on contouring for radiation treatment planning by saving clinicians’ time and improving contouring efficiency and consistency (Yang et al., 2012; Chao et al., 2007; Reed et al., 2009).
In our implementation, the segmentation was run on a Windows 7-based PC with an 8-core Intel Core i7 3.4-GHz CPU and 8 GB of memory. The deformable registration was performed independently on a Windows server with an 8-core 3-GHz Intel Xeon CPU and 8 GB of memory. Multithread computing was enabled in the deformable registration algorithm, and 2 registration tasks were allowed to be run simultaneously on the server. Each segmentation task required around 5 minutes to complete in a thoracic cancer patient and around 3 minutes in a head and neck cancer patient, with about half the time spent on deformable registration.
Our study showed that online atlas selection improved overall multi-atlas segmentation. The improvement in several poor cases was significant. For example, the MAS-AS results for patients 2, 6, 9, 10, and 11 showed significant improvement over the MAS results, as shown in Table 2. However, using online atlas selection did not result in improvement in every case. For example, the MAS-AS results for patients 4, and 8 were slightly inferior to the MAS results (Table 2). Nevertheless, online atlas selection improved the robustness of multi-atlas segmentation by preventing a worst-case scenario.
The cases showing inferior results for MAS-AS indicate that the atlas selection was not perfect. This was mostly due to the imperfect similarity metrics used to rank the atlases. For example, the cross-correlation coefficient used in the first phase of atlas selection is shift and rotation variant and is thus sensitive to misalignment. In addition, in our rigid alignment, we did not correct the rotation. The rotation variance may play down those atlases having similar local anatomy but different scanning positions, such as different neck flexion in the scanning set-up for head and neck cancer patients. This may explain why the overall evaluation in head and neck cancer patients (DSC = 0.70 ± 0.07) was slightly inferior to that in thoracic cancer patients (DSC = 0.73 ± 0.07).
In the second phase of atlas selection, the registration error may be a major obstacle for atlas selection. We used the histogram-based KL divergence metric to reduce the impact from the imperfect deformable registration. The histogram was created from a local region for calculating the KL divergence. Choosing the proper size of this region is critical to obtaining a correct atlas ranking. A larger region may better counteract the registration error but reduce atlas selection efficacy because unrelated anatomy may be included. In our study, we found that the local region, as defined by the union of the deformed contours, expanded by 1 mm, gave the best results in most cases, but we acknowledge that using a different size for the local region might result in better atlas selection in different cases.
Our study also found that the presence of air bubbles is one of the major obstacles in atlas-based segmentation of the esophagus. Several poor head and neck cancer cases, such as patients 5 and 10, were caused by the present of air bubbles. One potential solution to this issue is to detect air bubbles inside the esophagus (Fieselmann et al., 2008b). Once the air bubbles are detected, they can be replaced with similar intensity values of esophagus in the CT image; the modified CT image will be used for multi-atlas segmentation. On the other hand, we noticed that an air bubble can significantly change the similarity between the atlas and the test image in the atlas selection process. Performing atlas selection in local segments of the esophagus may resolve the air bubble issue. In addition, a similarity comparison using the entire long winding esophagus was not locally accurate in selecting the atlas. Therefore, optimal atlas selection within local segments of the esophagus is a subject of our future study.
In thoracic cancer patients, delineating the esophagus segment near the heart is most challenging for atlas-based segmentation. Neighboring structures such as the heart, lungs, and aorta may push or pull the esophagus, resulting in different shapes and locations from day to day and from patient to patient. In addition, the low contrast between the esophagus and the surrounding tissues makes it difficult to perform auto-segmentation. To assist esophagus segmentation near the heart, one can use a nearby structure as a constraint for segmentation (Yang et al., 2004; Gao et al., 2012).
The way of drawing manual contours might offset the evaluation of segmentation results. The manual contours were drawn in axial 2D slices, which created sharp edges at the top and bottom slices of the esophagus when it was viewed in 3D. However, the contour deformation was processed using a 3D mesh, which necessarily processed the 2 ends of esophagus to make it smooth. This may have created a discrepancy between auto-segmented and manual contours. We found disagreement in most slices at the two ends. In addition, in head and neck cancer patients, the manual contours of the inferior stopping slice may not have been consistent in different patients if the patients were positioned with different neck flexion. This potentially reduced the segmentation accuracy when these contours were used for evaluation.
5. Conclusions
Selecting a subset of optimal atlas candidates using local anatomy similarity improves multi-atlas segmentation. The proposed online atlas selection approach improved the robustness of multi-atlas segmentation of the esophagus from CT scans. In our future studies, we will explore more sophisticated image features for atlas ranking and selection, particularly the image texture and shape features that are commonly used for content-based image retrieval (Newsam and Kamath, 2005; Howarth and Rüger, 2004; Manjunath and Ma, 1996; Yang et al., 2008). Similarity evaluations based on intensity values may suffer from issues such as the shift and rotation variance and being sensitive to the local region selection. We expect that these issues will be mitigated when examining the similarity of image features extracted from the image contents.
Acknowledgments
Acknowledgements: This research was supported in part by a sponsored research grant from Varian Medical Systems, CPRIT (Cancer Prevention Research Institute of Texas) grant RP110562-P2, and MD Anderson support grant CA016672. The authors would like to thank Ann Sutton from the Department of Scientific Publication for reviewing the manuscript.
References
- Aljabar P, Heckemann R A, Hammers A, Hajnal J V and Rueckert D 2009. Multi-atlas based segmentation of brain images: Atlas selection and its effect on accuracy NeuroImage 46 726–38 [DOI] [PubMed] [Google Scholar]
- Chao KSC, Bhide S, Chen H, Asper J, Bush S, Franklin G, Kavadi V, Liengswangwong V, Gordon W, Raben A, Strasser J, Koprowski C, Frank S, Chronowski G, Ahamad A, Malyapa R, Zhang L and Dong L 2007. Reduce in Variation and Improve Efficiency of Target Volume Delineation by a Computer-Assisted System Using a Deformable Image Registration Approach International Journal of Radiation Oncology*Biology*Physics 68 1512–21 [DOI] [PubMed] [Google Scholar]
- Chen A, Niermann K J, Deeley MA and Dawant BM 2012. Evaluation of multiple-atlas-based strategies for segmentation of the thyroid gland in head and neck Physics in medicine and biology 57 93–111 [DOI] [PMC free article] [PubMed] [Google Scholar]
- Collier DC, Burnett SS, Amin M, Bilton S, Brooks C, Ryan A, Roniger D, Tran D and Starkschall G 2003. Assessment of consistency in contouring of normal-tissue anatomic structures Journal of Applied Clinical Medical Physics 4 17–24 [DOI] [PMC free article] [PubMed] [Google Scholar]
- Danielsson P-E 1980. Euclidean Distance Mapping Computer Graphics and Image Processing 14 227–48 [Google Scholar]
- Dice LR 1945. Measures of the Amount of Ecologic Association Between Species Ecology 26 297–302 [Google Scholar]
- Feulner J, Zhou S K, Cavallaro A, Seifert S, Hornegger J and Comaniciu D 2009. Fast Automatic Segmentation of the Esophagus from 3D CT Data Using a Probabilistic Model Medical Image Computing and Computer-Assisted Intervention – MICCAI 2009: 12th International Conference, London, UK, September 20-24, 2009, Proceedings, Part I 255–62 [DOI] [PubMed] [Google Scholar]
- Feulner J, Zhou S K, Hammon M, Seifert S, Huber M, Comaniciu D, Hornegger J and Cavallaro A 2011. A Probabilistic Model for Automatic Segmentation of the Esophagus in 3-D CT Scans IEEE Transactions On Medical Imaging 30 1252–64 [DOI] [PubMed] [Google Scholar]
- Fieselmann A, Lautenschläger S, Deinzer F, John M and Poppe B 2008a. Esophagus Segmentation by Spatially-Constrained Shape Interpolation. In: Bildverarbeitung für die Medizin 2008, ed Tolxdorff, et al. : Springer Berlin Heidelberg; ) pp 247–51 [Google Scholar]
- Fieselmann A, Lautenschläger S, F Deinzer and Poppe B 2008b. Automatic Detection of Air Holes Inside the Esophagus in CT Images. In: Bildverarbeitung für die Medizin 2008, ed Tolxdorff T, et al. : Springer Berlin Heidelberg; ) pp 397–401 [Google Scholar]
- Forsythe GE, Malcolm MA and Moler CB 1976. Computer Methods for Mathematical Computations (Englewood Cliffs, NJ: Prentice Hall; ) [Google Scholar]
- Gao Y, Kikinis R, Bouix S, Shenton M and Tannenbaum A 2012. A 3D interactive multi-object segmentation tool using local robust statistics driven active contours Medical Image Analysis 16 1216–27 [DOI] [PMC free article] [PubMed] [Google Scholar]
- Geets X, Daisne JF, Arcangeli S, Coche E, De Poel M, Duprez T, Nardella G and Gregoire V 2005. Inter-observer variability in the delineation of pharyngo-laryngeal tumor, parotid glands and cervical spinal cord: comparison between CT-scan and MRI Radiother Oncol 77 25–31 [DOI] [PubMed] [Google Scholar]
- Grosgeorge D, Petitjean C, Dubray B and Ruan S 2013. Esophagus Segmentation from 3D CT Data Using Skeleton Prior-Based Graph Cut Comput Math Method M [DOI] [PMC free article] [PubMed] [Google Scholar]
- Howarth P and Rüger S 2004. Proceedings of the International Conference on Image and Video Retrieval, ed Enser P, et al. : Springer Berlin Heidelberg; ) pp 326–34 [Google Scholar]
- Isgum I, Staring M, Rutten A, Prokop M, Viergever MA and van Ginneken B 2009. Multi-Atlas-Based Segmentation With Local Decision Fusion - Application to Cardiac and Aortic Segmentation in CT Scans IEEE Transactions on Medical Imaging 28 1000–10 [DOI] [PubMed] [Google Scholar]
- Kirisli H A, Schaap M, Klein S, Papadopoulou S L, Bonardi M, Chen CH, Weustink AC, Mollet NR, Vonken EJ, van der Geest RJ, van Walsum T and Niessen WJ 2010. Evaluation of a multi-atlas based method for segmentation of cardiac CTA data: a large-scale, multicenter, and multivendor study Med Phys 37 6279–91 [DOI] [PubMed] [Google Scholar]
- Klein S, van der Heide UA, Lips IM, van Vulpen M, Staring M and Pluim JPW 2008. Automatic segmentation of the prostate in 3D MR images by atlas matching using localized mutual information Medical Physics 35 1407–17 [DOI] [PubMed] [Google Scholar]
- Kurugol S, Bas E, Erdogmus D, Dy JG, Sharp GC and Brooks DH 2011. Centerline Extraction with Principal Curve Tracing to Improve 3D Level Set Esophagus Segmentation in CT Images Ieee Eng Med Bio 3403–6 [DOI] [PMC free article] [PubMed] [Google Scholar]
- Kurugol S, Ozay N, Dy JG, Sharp GC and Brooks DH 2010. Locally Deformable Shape Model to Improve 3D Level Set based Esophagus Segmentation. In: Proceedings of International Conference on Pattern Recognition, pp 3955–8 [DOI] [PMC free article] [PubMed] [Google Scholar]
- Langerak TR, van der Heide UA, Kotte ANTJ, Berendsen FF and Pluim JPW 2011. Local atlas selection and performance estimation in multi-atlas based segmentation. In: IEEE International Symposium on Biomedical Imaging: From Nano to Macro, pp 669–72 [Google Scholar]
- Langerak TR, van der Heide UA, Kotte ANTJ, Viergever MA, an Vulpen M and Pluim JPW 2010. Label Fusion in Atlas-Based Segmentation Using a Selective and Iterative Method for Performance Level Estimation (SIMPLE) IEEE Transactions on Medical Imaging 29 2000–8 [DOI] [PubMed] [Google Scholar]
- Lu WG, Olivera GH, Chen Q, Chen ML and Ruchala KJ 2006. Automatic re-contouring in 4D radiotherapy Physics in Medicine and Biology 51 1077–99 [DOI] [PubMed] [Google Scholar]
- Manjunath BS and Ma WY 1996. Texture Features for Browsing and Retrieval of Image Data IEEE Transactions on Pattern Analysis and Machine Intelligence 18 837–42 [Google Scholar]
- Newsam SD and Kamath C 2005. Comparing shape and texture features for pattern recognition in simulation data Proc. SPIE 5672, Image Processing: Algorithms and Systems IV 106–17 [Google Scholar]
- Ramus L and Malandain G 2010. Medical Image Analysis for the Clinic: A Grand Challenge, ed vanGinneken B, et al. pp 281–8 [Google Scholar]
- Reed VK, Woodward WA, Zhang L, Strom EA, Perkins GH, Tereffe W, Oh JL, Yu TK, Bedrosian I, Whitman GJ, Buchholz TA and Dong L 2009. Automatic Segmentation of Whole Breast Using Atlas Approach and Deformable Image Registration International Journal of Radiation Oncology*Biology*Physics 73 1493–500 [DOI] [PMC free article] [PubMed] [Google Scholar]
- Rohlfing T, Brandt R, Menzel R and Maurer Jr C R 2004. Evaluation of atlas selection strategies for atlas-based image segmentation with application to confocal microscopy images of bee brains NeuroImage 21 1428–42 [DOI] [PubMed] [Google Scholar]
- Rousson M, Bai Y, Xua C and Sauer F 2006. Probabilistic minimal path for automated esophagus segmentation. In: SPIE Medical Imaging, p 614449 [Google Scholar]
- Sabuncu MR, Yeo B T T, Van Leemput K, Fischl B and Golland P 2010. A Generative Model for Image Segmentation Based on Label Fusion IEEE Transactions on Medical Imaging 29 1714–29 [DOI] [PMC free article] [PubMed] [Google Scholar]
- Shen K, Bourgeat P, Dowson N, Meriaudeau Fand Salvado O Biomedical Imaging: From Nano to Macro, 2011 IEEE International Symposium on, March 30 2011-April 2 2011 2011), vol. Series) pp 1746–9 [Google Scholar]
- Sjoberg C, Lundmark M, Granberg C, Johansson S, Ahnesjo A and Montelius A 2013. Clinical evaluation of multi-atlas based segmentation of lymph node regions in head and neck and prostate cancer patients Radiation Oncology 8 229. [DOI] [PMC free article] [PubMed] [Google Scholar]
- Wang H, Dong L, Lii MF, Lee AL, de Crevoisier R, Mohan R, Cox JD, Kuban DA and Cheung R 2005. Implementation and validation of a three-dimensional deformable registration algorithm for targeted prostate cancer radiotherapy International Journal of Radiation Oncology*Biology*Physics 61 725–35 [DOI] [PubMed] [Google Scholar]
- Warfield SK, Zou KH and Wells WM 2004. Simultaneous truth and performance level estimation (STAPLE): an algorithm for the validation of image segmentation IEEE Trans Med Imaging 23 903–21 [DOI] [PMC free article] [PubMed] [Google Scholar]
- Wu M, Rosano C, Lopez-Garcia P, Carter CS and Aizenstein HJ 2007. Optimum template selection for atlas-based segmentation NeuroImage 34 1612–8 [DOI] [PubMed] [Google Scholar]
- Yang J, Amini A, Williamson R, Zhang L, Zhang Y, Komaki R, Liao Z, Cox J, Welsh J, Court L and Dong L 2013. Automatic contouring of brachial plexus using a multi-atlas approach for lung cancer radiation therapy Practical Radiation Oncology 3 e139–e47 [DOI] [PubMed] [Google Scholar]
- Yang J, Shen D, Davatzikos C and Verma R 2008. Diffusion Tensor Image Registration Using Tensor Geometry and Orientation Features Medical Image Computing and Computer-Assisted Intervention - MICCAI, Pt II, Proceedings 5242 905–13 [DOI] [PubMed] [Google Scholar]
- Yang J, Staib LH and Duncan JS 2004. Neighbor-constrained segmentation with level set based 3-D deformable models IEEE Transactions On Medical Imaging 23 940–8 [DOI] [PMC free article] [PubMed] [Google Scholar]
- Yang J, Wei C, Zhang L, Zhang Y, Blum RS and Dong L 2012. A statistical modeling approach for evaluating auto-segmentation methods for image-guided radiotherapy Comput Med Imaging Graph 36 492–500 [DOI] [PMC free article] [PubMed] [Google Scholar]
- Yang J, Woodward WA, Reed VK, Strom EA, Perkins GH, Tereffe W, Buchholz TA, Zhang L, Balter P, Court LE, Li X A and Dong L 2014. Statistical modeling approach to quantitative analysis of interobserver variability in breast contouring Int J Radiat Oncol Biol Phys 89 214–21 [DOI] [PMC free article] [PubMed] [Google Scholar]
- Yang J, Zhang Y, Zhang L and Dong L 2010. Medical Image Analysis for the Clinic: A Grand Challenge, ed vanGinneken, et al. pp 323–30 [Google Scholar]
- Zhou R, Liao Z, Pan T, Milgrom S A, Pinnix C C, Shi A, Tang L, Yang J, Liu Y, Gomez D, Nguyen QN, Dabaja BS, Court L and Yang J 2017. Cardiac atlas development and validation for automatic segmentation of cardiac substructures Radiother Oncol 122 66–71 [DOI] [PMC free article] [PubMed] [Google Scholar]