
Figure 1. KChIP3 levels regulate baseline MUC5AC secretion.
(A) KChIP3 RNA levels from undifferentiated (UD) and differentiated (DF) HT29-18N2 cells normalized by GAPDH values. (B) Control (black circles) and KChIP3 stable knockdown cells (KChIP3-KD) (blue squares) were differentiated and incubated for 30 min at 37°C in the absence or presence of 100 µM ATP. Secreted MUC5AC was collected and dot blotted with an anti-MUC5AC antibody. Data were normalized to actin levels. The y-axis represents normalized values relative to the values of untreated control cells. (C) ATP-dependent MUC5AC secretion was calculated from the data in (B) as the difference between normalized baseline secretion and stimulated secretion for each condition. (D) Secreted MUC5AC from differentiated control (black circles) and KChIP3 overexpressing cells (KChIP3-GFP) (red circles) in the absence or presence of 100 µM ATP. (E) ATP-dependent MUC5AC secretion calculated from the data in (D) for each condition. (F) Immunofluorescence Z-stack projections of control, KChIP3-KD and KChIP3-GFP differentiated HT29-18N2 cells with anti-MUC5AC antibody (green) and DAPI (red). Scale bar = 5 µm. (G) The number of MUC5AC granules for control (black circles), KChIP3-KD (blue squares) and KChIP3-GFP (red circles) cells was quantified from individual immunofluorescence stacks using 3D analysis FIJI software. The y-axis represents the number of 3-D objects detected by the software divided by the number of cells in each field. (H) Volume of control (black), KChIP3-KD (blue) and KChIP3-GFP (red) MUC5AC granules was calculated from individual immunofluorescence stacks using 3D analysis FIJI software. The y-axis represents the volume of the granules in µm3. Abbreviations: UD: Undifferentiated HT29-18N2 cells, DF: Differentiated HT29-18N2 cells. *p<0.05, **p<0.01.

Figure 1—figure supplement 1. KChIP expression levels in HT29-18N2 stable cell lines.
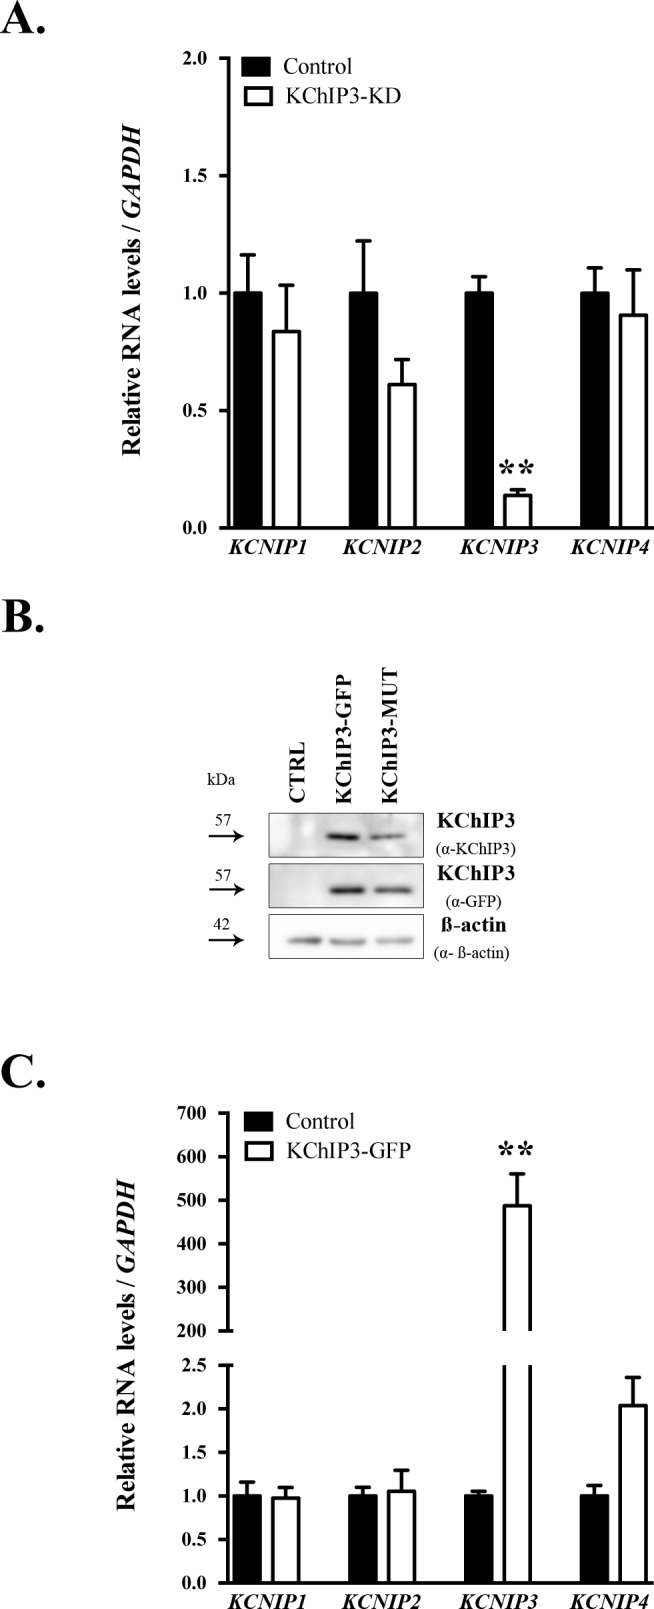
Figure 1—figure supplement 2. KChIP3 levels regulate MUC2 secretion.
