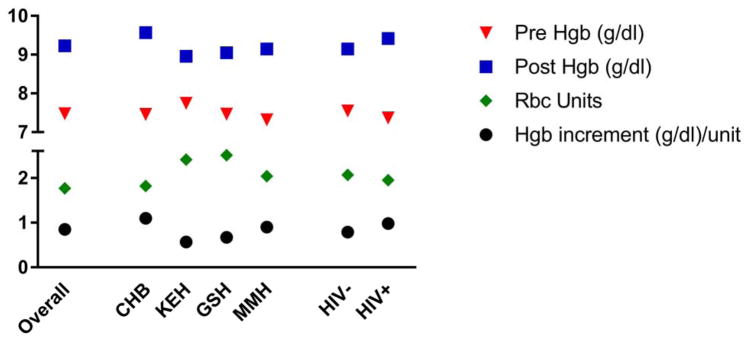
Figure 1.
Pre- and post- transfusion hemoglobin, number of units of RBCS, and hemoglobin increment divided by number of RBC units by hospital and HIV status. The Y axis indicates the mean hemoglobin (g/dL) for pre- and post- transfusion hemoglobin, the number of RBC units transfused and the hemoglobin increment divided by the number of RBC units transfused. The X-axis indicates participant subgroups: overall includes all transfused women, followed by hospital (CHB = Chris-Hani Baragwanath, KEH = King Edward VIII, GSH = Groote Schuur Hospital and MMH = Mowbray Maternity Hospital) and positive versus negative HIV status. Abbreviations: Hgb: hemoglobin Tx: Transfusion. The comparison of hemoglobin increment did not differ by HIV status (p=0.24).

