Abstract
Recently, deep learning based speech segregation has been shown to improve human speech intelligibility in noisy environments. However, one important factor not yet considered is room reverberation, which characterizes typical daily environments. The combination of reverberation and background noise can severely degrade speech intelligibility for hearing-impaired (HI) listeners. In the current study, a deep learning based time-frequency masking algorithm was proposed to address both room reverberation and background noise. Specifically, a deep neural network was trained to estimate the ideal ratio mask, where anechoic-clean speech was considered as the desired signal. Intelligibility testing was conducted under reverberant-noisy conditions with reverberation time T60 = 0.6 s, plus speech-shaped noise or babble noise at various signal-to-noise ratios. The experiments demonstrated that substantial speech intelligibility improvements were obtained for HI listeners. The algorithm was also somewhat beneficial for normal-hearing (NH) listeners. In addition, sentence intelligibility scores for HI listeners with algorithm processing approached or matched those of young-adult NH listeners without processing. The current study represents a step toward deploying deep learning algorithms to help the speech understanding of HI listeners in everyday conditions.
I. INTRODUCTION
Hearing loss is one of the most prevalent chronic health conditions, affecting approximately 10% of the population. A primary symptom of hearing-impaired (HI) listeners is reduced speech intelligibility in background interference. Although traditional speech enhancement methods fail to improve intelligibility, it has been recently established that supervised speech segregation based on deep neural networks (DNNs) can produce substantial intelligibility improvements. The first demonstration was provided by Healy et al. (2013), who employed an extended version of a DNN-based monaural segregation algorithm (Wang and Wang, 2013). The algorithm estimated the ideal binary mask (IBM) when provided only with features from speech mixed with noise. Considerable intelligibility improvements were found for HI listeners as well as for normal-hearing (NH) listeners in both steady (stationary) and modulated (nonstationary) noises, with the largest improvement occurring for HI listeners in modulated noise.
A series of subsequent studies have relaxed the matching requirements between training and test conditions, thus broadening the scope of generalization for supervised learning. In Healy et al. (2015), a DNN was trained using one segment of a nonstationary noise and tested using a new segment of the same noise type, which was considerably more challenging algorithmically than training and testing on overlapping noise segments, as in Healy et al. (2013). Intelligibility increases were again observed for HI listeners (Healy et al., 2015). Chen et al. (2016) employed large-scale training on a variety of noises and performed testing on entirely new noises. As for the previous studies, intelligibility increases were observed for HI listeners. Monaghan et al. (2017) evaluated a small DNN, and also found intelligibility improvements for HI listeners. Their study suggests that auditory-inspired features may be more effective than previously used features. More recently, Healy et al. (2017) proposed a DNN separation algorithm to deal with speaker segregation, where a target talker was presented with a competing talker. Once again, substantial intelligibility improvements for HI listeners were obtained. Furthermore, these studies have shown that DNN-based speech segregation produces larger speech intelligibility gains for HI listeners than for NH listeners. This result involving DNN-estimated time-frequency (T-F) masks is consistent with work involving HI and NH listeners hearing speech subjected to ideal (not estimated) T-F masks (Anzalone et al., 2006; Wang et al., 2009).
One important dimension of acoustic interference not considered previously is room reverberation, which is characteristic of daily environments. Room reverberation is caused by surface reflections of sound in an enclosed space. It smears the structure of speech and poses a major challenge for speech processing algorithms. Without background noise, human listeners can tolerate a fair amount of room reverberation, and their speech recognition is not substantially affected until the reverberation time (T60) becomes long. For HI listeners, T60 needs to be 1 s or longer before intelligibility drops to below 50% (Gelfand and Hochberg, 1976; Nábělek and Robinson, 1982; Helfer and Wilber, 1990); this is even true for cochlear implantees (Hu and Kokkinakis, 2014). For NH listeners, T60 needs to be at least 2 s before their recognition drops below 50% (Gelfand and Hochberg, 1976; Roman and Woodruff, 2013). However, in real listening environments, reverberation and background noise are often both present. In these conditions, speech intelligibility is severely degraded, particularly for HI listeners (George et al., 2010). Room reverberation and background noise have different corrupting effects, and their combined effect appears to surpass the sum of the two effects (Nábělek and Mason, 1981).
Han et al. (2014) proposed the first DNN model to perform speech dereverberation. They trained the DNN to map from the cochleagram of reverberant speech to that of anechoic speech. The spectral mapping approach was later extended to perform both dereverberation and denoising (Han et al., 2015), where the DNN was used to learn a mapping function from the log-magnitude spectrum of reverberant-noisy speech to that of the corresponding anechoic-clean speech. Although this model resulted in improvements in objective intelligibility metrics, informal listening indicated no intelligibility gain for HI listeners (Zhao et al., 2016). Subsequent work by Wu et al. (2017) showed that better dereverberation can be achieved by performing T60 specific training and using T60 estimation to select model parameters. A recent study by Santos and Falk (2017) used a recurrent neural network to better utilize temporal dependencies and reported a higher amount of speech dereverberation than that in Wu et al. (2017).
Aside from Han et al. (2015), few studies have addressed both reverberation and noise. Part of the difficulty in removing reverberation and noise from reverberant-noisy speech is the different natures of the two. Specifically, reverberation essentially involves convolution of a direct sound with a room impulse response (RIR), whereas background noise involves adding a signal to the target speech.
The segregation of speech from concurrent reverberation and noise is an important issue because of its relevance for everyday acoustic environments. But despite its importance, we are unaware of any demonstration of speech intelligibility improvements produced by a monaural segregation algorithm in reverberant-noisy conditions. The current study provides this demonstration. A DNN was trained to estimate the ideal ratio mask (IRM) of anechoic noise-free (clean) speech, when given only features from a reverberant-noisy mixture. The IRM (Wang et al., 2014) may be viewed as a soft version of the IBM (Wang, 2005), and ratio masking attenuates T-F units differently depending on their levels of corruption—units having greater corruption are attenuated more. With an estimated IRM and the reverberant-noisy phase, enhanced speech is resynthesized in the time domain. The proposed DNN model extends our previous study (Zhao et al., 2017); the differences are described in Sec. II C. Speech intelligibility testing was conducted on HI and NH listeners. The results clearly show that the DNN model produced substantial improvements for HI listeners and also some improvement for NH listeners.
II. METHOD
A. Listeners
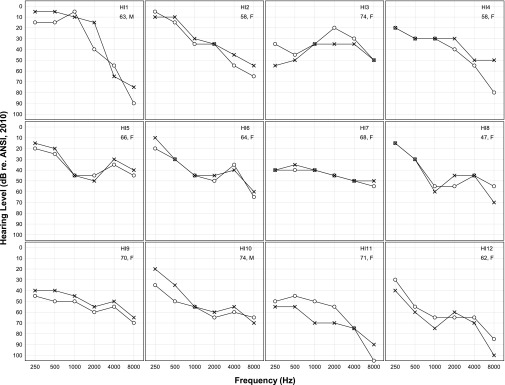
A first group of listeners consisted of 12 adults with bilateral sensorineural hearing impairment. All were bilateral hearing-aid wearers recruited from the Speech-Language-Hearing Clinic at The Ohio State University. These individuals ranged in age from 47 to 74 years (mean = 65 years), and 10 were female. Hearing was examined on the day of test using otoscopy, tympanometry (ANSI, 1987), and pure-tone audiometry (ANSI, 2004, 2010). Otoscopy was unremarkable, and middle-ear pressures and compliances were within normal limits. These listeners were recruited to represent typical HI individuals and, accordingly, were older and had a variety of hearing loss degrees and configurations. On average, they had moderate sloping hearing loss. Figure 1 displays audiograms for all 12 HI listeners, who were numbered in order of increasing pure-tone average (PTA), defined as the audiometric threshold averaged across 0.5, 1, 2, and 4 kHz and across ears.
FIG. 1.
Pure-tone air-conduction audiometric thresholds for the listeners with sensorineural hearing impairment. Right ears are represented by circles and left ears are represented by crosses. Also displayed are listener number, listener age in years, and gender. Listeners are numbered in order of increasing pure-tone average audiometric threshold.
A second group consisted of 10 listeners with normal hearing, defined by audiometric thresholds of 20 dB hearing level or better at octave frequencies from 250 to 8000 Hz (ANSI, 2004, 2010). They were recruited from courses at The Ohio State University. These individuals were aged 19 to 23 years (mean = 20 years), and all were female. All listeners received course credit or a cash incentive for participating. Care was taken to ensure that no listener had any prior exposure to any of the sentences employed for testing. Groups were not age matched since our goal was to compare typically aged HI listeners and “ideal” listeners (young-adult NH).
B. Stimuli
The stimuli consisted of sentences from the Institute of Electrical and Electronics Engineers (IEEE) corpus (Rothauser et al., 1969). This corpus consists of 72 lists, each containing 10 sentences. The 720 sentences were spoken by a female talker and recorded at 44.1 kHz with 16-bit resolution. They were down-sampled to 16 kHz for processing and presentation. The sentences have moderate to high semantic context, and each contains five key words for scoring intelligibility. Our preliminary data indicate that scores near 100% correct can be achieved by most but not all HI and NH listeners when these sentences are presented uncorrupted by noise or reverberation. Sentences were selected from lists 1–50, lists 68–72, and lists 51–66 for the training, validation, and test data, respectively.
An RIR generator (Habets, 2014) was used to synthesize RIRs, which were then convolved with the IEEE sentences to produce reverberant speech at specified locations in a given room. The software utilizes an image model (Allen and Berkley, 1979), which allows for systematic manipulations of source and microphone location, T60, and direct-to-reverberant energy ratio (DRR). The use of synthesized RIRs has been previously validated by comparing them with recorded RIRs (Hummersone et al., 2010; Han et al., 2015). In the current study, a simulated room with T60 = 0.6 s was selected, which covers a variety of real rooms (Kuttruff, 2000). The room size was 10 m × 7 m × 3 m. Inside the room, the speaker was placed 1 m from the microphone at the same height, producing a DRR of approximately −0.2 dB. Reverberant utterances were generated by placing each IEEE sentence at a random position on the horizontal circle having a 1-m radius around the fixed microphone. In the experiments, 30 different RIRs were generated by randomly choosing the position of the speaker.
Two background noises were used. One was speech-shaped noise (SSN) generated using VOICEBOX (Brookes, 2005). The other was 20-talker babble noise taken from an Auditec CD (St. Louis, MO). Each noise was approximately 10 min long, with the first 8 min used for training/validation and the remaining 2 for testing.
To generate reverberant-noisy speech, reverberant speech was mixed with same length random cuts of the SSN or babble noise at various signal-to-noise ratios (SNRs). No reverberation was added to the two types of background noise when generating reverberant-noisy speech, as is commonly done in monaural studies (Hazrati and Loizou, 2012; Yoshioka et al., 2012). Part of the reason is that it is not straightforward to spatialize a multisource noise such as the multitalker babble used in the current study. For each noise, three SNRs were created with reverberant speech considered as the signal in the SNR calculation. For SSN, the SNRs were 5, 0, and −5 dB; for babble, the SNRs were 10, 5, and 0 dB. These SNRs were selected to produce a range of unprocessed-stimuli intelligibility scores for the HI listeners, both above and below 50% correct. The HI listeners were tested using all the SNRs, whereas the NH listeners were tested using the two lower SNRs for each noise type, because their unprocessed scores were expected to reach ceiling levels at the highest SNRs.
C. Algorithm description
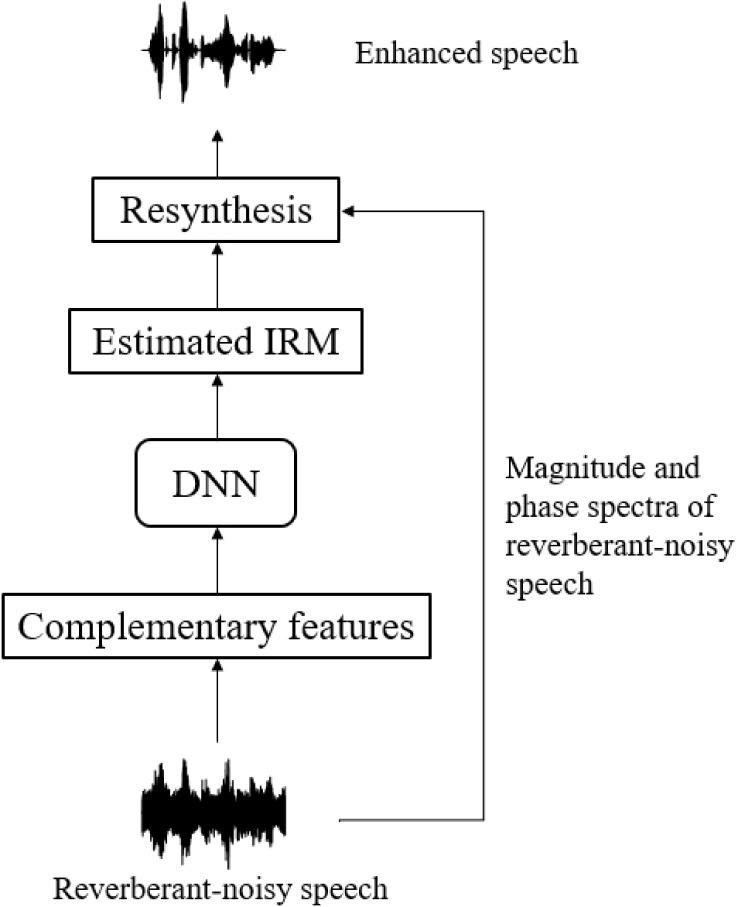
Figure 2 shows the system diagram of the proposed segregation algorithm. The 16 kHz signal was segmented using a 20-ms Hamming window with a 10-ms window shift. To obtain the T-F representation of the signal, a 320-point fast Fourier transform was applied to each frame, resulting in 161 frequency bins. As employed in our previous studies, a set of complementary features (Wang et al., 2013) was extracted from reverberant-noisy speech and fed to the DNN as input. Specifically, the feature set included 13-dimensional relative spectral transform perceptual linear prediction, 15-dimensional amplitude modulation spectrogram, 31-dimensional mel-frequency cepstral coefficients, 64-dimensional gammatone filterbank power spectra, and their deltas (i.e., differences between the feature vectors of consecutive frames) to capture the dynamic nature of these features. Thus, at each time frame, a 246-dimensional feature vector of reverberant-noisy speech was extracted. Moreover, a context window with 9 frames to each side of the current frame was utilized to incorporate temporal information of adjacent frames.
FIG. 2.
System diagram of the proposed DNN-based speech segregation algorithm for reverberant-noisy speech.
After feature extraction, a DNN was employed to estimate the IRM in order to remove room reverberation and background noise from the reverberant-noisy speech. At time frame t and frequency bin f, the IRM is defined as follows:
| (1) |
where X2(t, f) denotes the energy of anechoic-clean speech, and N2(t, f) denotes the combined energy of reverberation and background noise. The estimated IRM was applied to the magnitude spectrum of reverberant-noisy speech to get the enhanced magnitude spectrum. Finally, the enhanced time-domain signal was resynthesized using reverberant-noisy phase (see Fig. 2).
As described in Sec. II B, under each noise condition, there were 500 (sentences) × 30 (RIRs) × 3 (SNRs) = 45 000 reverberant-noisy utterances in the training set; 50 (sentences)× 30 (RIRs) × 3 (SNRs) = 4500 reverberant-noisy utterances in the validation set; and 160 (sentences) × 1 (RIRs) × 3 (SNRs) = 480 reverberant-noisy utterances in the test set. It is worth noting that noise segments, RIRs and sentences comprising the test data were all unseen during model training.
The DNN architecture included 4 hidden layers with 2048 exponential linear units (Clevert et al., 2015) in each layer, which led to better performance and faster convergence than commonly used rectified linear units (Glorot et al., 2011). To facilitate model training and improve the generalization ability of the trained model, batch normalization (Ioffe and Szegedy, 2015) and dropout regularization (Srivastava et al., 2014) techniques were employed. Specifically, in each hidden layer, batch normalization was performed before nonlinear activation. During training, each batch normalization layer kept exponential moving averages on the mean and standard deviation of each mini-batch (i.e., a subset of training samples). During testing, these statistics were fixed to perform normalization. Dropout regularization with a 0.2 dropout rate was adopted; in other words, 20% of the units in the input and hidden layers were randomly dropped out in each training iteration. Since the training target, the IRM, is bounded by [0,1], sigmoid units were employed in the output layer. For the input features, they were normalized to zero mean and unit standard deviation using the statistics of the training data. The system was trained with the Adam (Kingma and Ba, 2014) optimizer and mean squared error (MSE) loss.
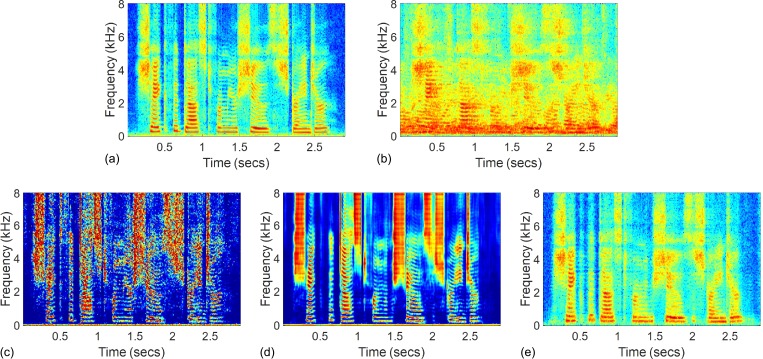
Figure 3 illustrates an example of the segregation algorithm for T60 = 0.6 s and the 0 dB SNR babble noise condition. Spectrograms of the anechoic-clean signal and the reverberant-noisy signal are given in Figs. 3(a) and 3(b), respectively. The IRM is shown in Fig. 3(c) and its estimate provided by the DNN is given in Fig. 3(d). The spectrogram of the enhanced signal is shown in Fig. 3(e), where additive noise and smearing effects caused by reverberation have been largely removed from the reverberant-noisy signal. Compared with the masking algorithm described in our earlier paper (Zhao et al., 2017), the main differences are the utilization of a larger context window and the introduction of batch normalization.
FIG. 3.
(Color online) Segregation of an IEEE sentence (“Shake the dust from your shoes, stranger”) from babble noise at 0 dB SNR with 0.6 s T60; (a) spectrogram of the anechoic-clean utterance, (b) spectrogram of the reverberant-noisy utterance, (c) IRM for this mixture, (d) estimated IRM, and (e) spectrogram of the segregated utterance by applying the estimated IRM to the reverberant-noisy utterance.
D. Procedure
There were 12 conditions for the HI listeners (2 noise types × 3 SNRs × 2 unprocessed/processed) and 8 conditions for the NH listeners (2 noise types × 2 SNRs × 2 unprocessed/processed). Half of the listeners in each group were tested using the SSN conditions before the babble conditions, and the other half were tested in the opposite order. The SNR conditions were blocked and randomized for each listener within each noise type. The presentation order for the unprocessed/processed conditions was randomized, but because it is the most critical comparison, they were juxtaposed for each noise type and SNR. Finally, the sentences were heard in a single fixed order, allowing the sentence-to-condition correspondence to be random. Each listener heard 13 sentences in each condition, for a total of 156 (HI) or 104 (NH) sentences. The subset of sentences heard by each NH listener was drawn randomly from the set heard by the HI listeners.
Testing began with brief practice in which listeners heard sentences not used in formal testing. The background noise was that used in the first test, and the SNR was the middle of the three HI test SNRs. Five sentences were presented unprocessed in quiet, followed by ten sentences algorithm processed, followed by ten unprocessed reverberant-noisy sentences. Exceptions were for the first three HI listeners run (HI7, HI10, and HI11), who heard five sentences at each practice stage. This practice was repeated halfway through the test session prior to switching noise type. New sentences and only the processed and unprocessed reverberant-noisy conditions were employed. Feedback was provided during practice but not during formal testing.
The stimuli were played from a PC, converted to analog form using an Echo Digital Audio (Santa Barbara, CA) Gina 3 G digital-to-analog converter, and presented diotically over Sennheiser HD 280 headphones (Wedemark, Germany). The presentation level was set at each earphone using a flat-plate coupler and sound level meter (Larson Davis AEC 101 and 824, Depew, NY). The presentation level was 65 dBA for NH listeners and 65 dBA plus individual frequency-specific gains as defined by the NAL-R hearing-aid prescription formula (Byrne and Dillon, 1986) for HI listeners. Hearing-impaired listeners were tested with hearing aids removed. Following the first several practice sentences, the HI listeners were asked if the signal was clearly audible and if it was too loud. Eight individuals responded that the stimuli were comfortable. Four (HI3, HI7, HI11, HI12) indicated that the speech sounded loud, and so the overall level was reduced by 5 dB. This subset of listeners included the two having the greatest hearing loss. After adjustment, three of these four listeners responded that the stimuli were comfortable. The fourth requested that slightly more gain be added back, and so the level was increased by 2 dB, after which it was judged to be comfortable. Overall presentation levels for the HI listeners following amplification by the NAL-R formula and adjustment ranged from 74 to 92 dBA (mean = 82.5 dBA).
Listeners were tested individually in a double-walled audiometric booth, seated with the experimenter. The experimenter controlled the presentation of sentences and recorded responses. The listeners were instructed to repeat the sentence back as best they could after hearing each and were encouraged to guess if unsure. No sentence was repeated for any listener. The total duration of testing was approximately 1.5 h for the HI listeners and less than 1 h for the NH listeners.
III. RESULTS AND DISCUSSION
A. Human performance
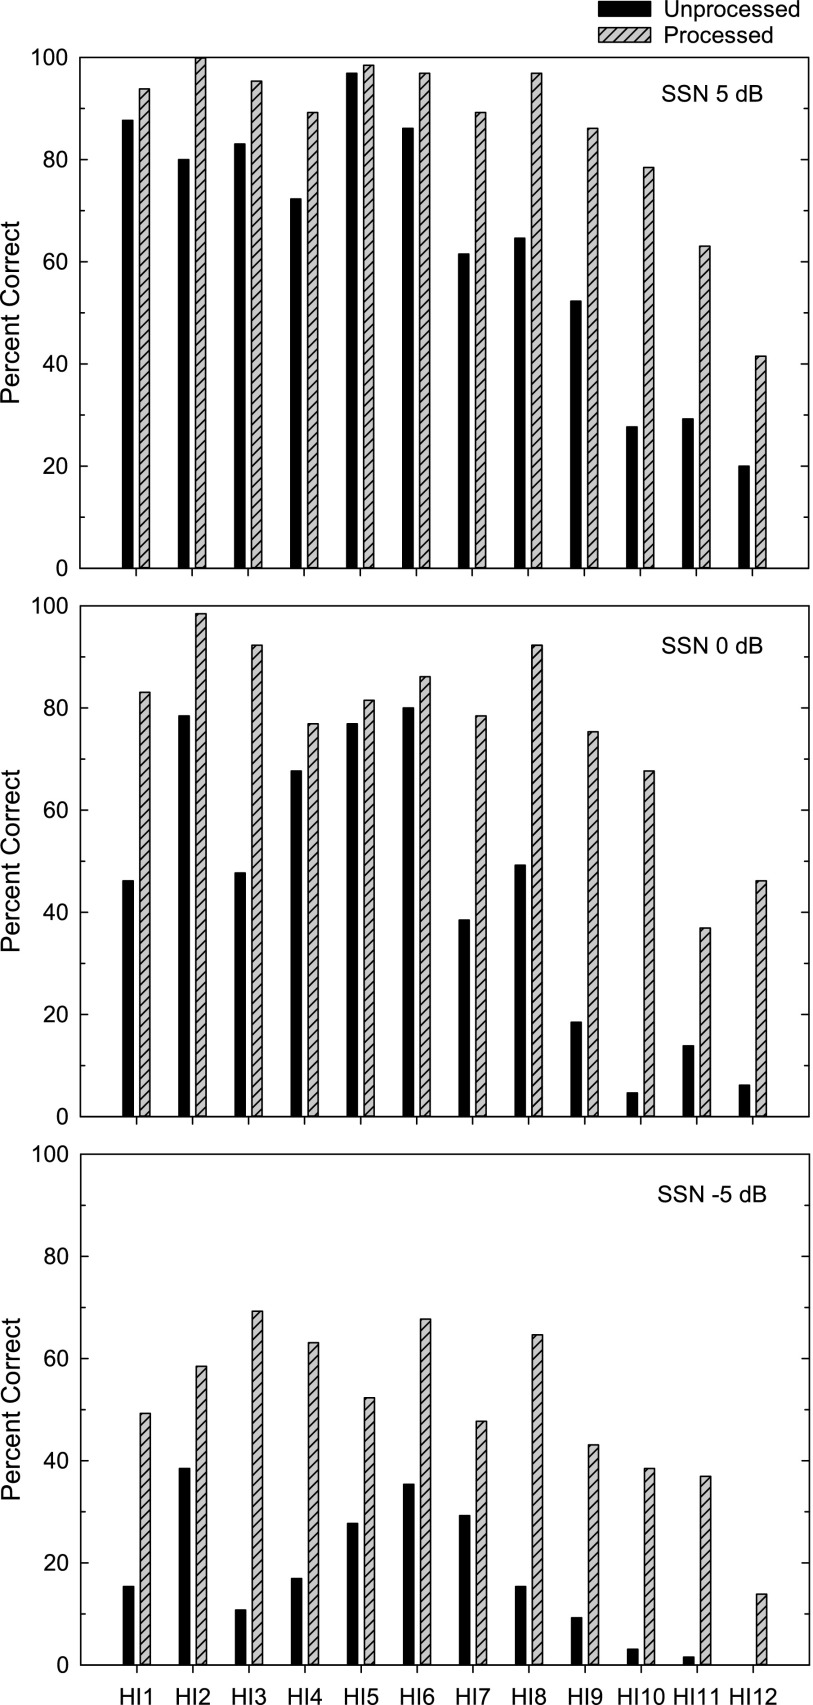
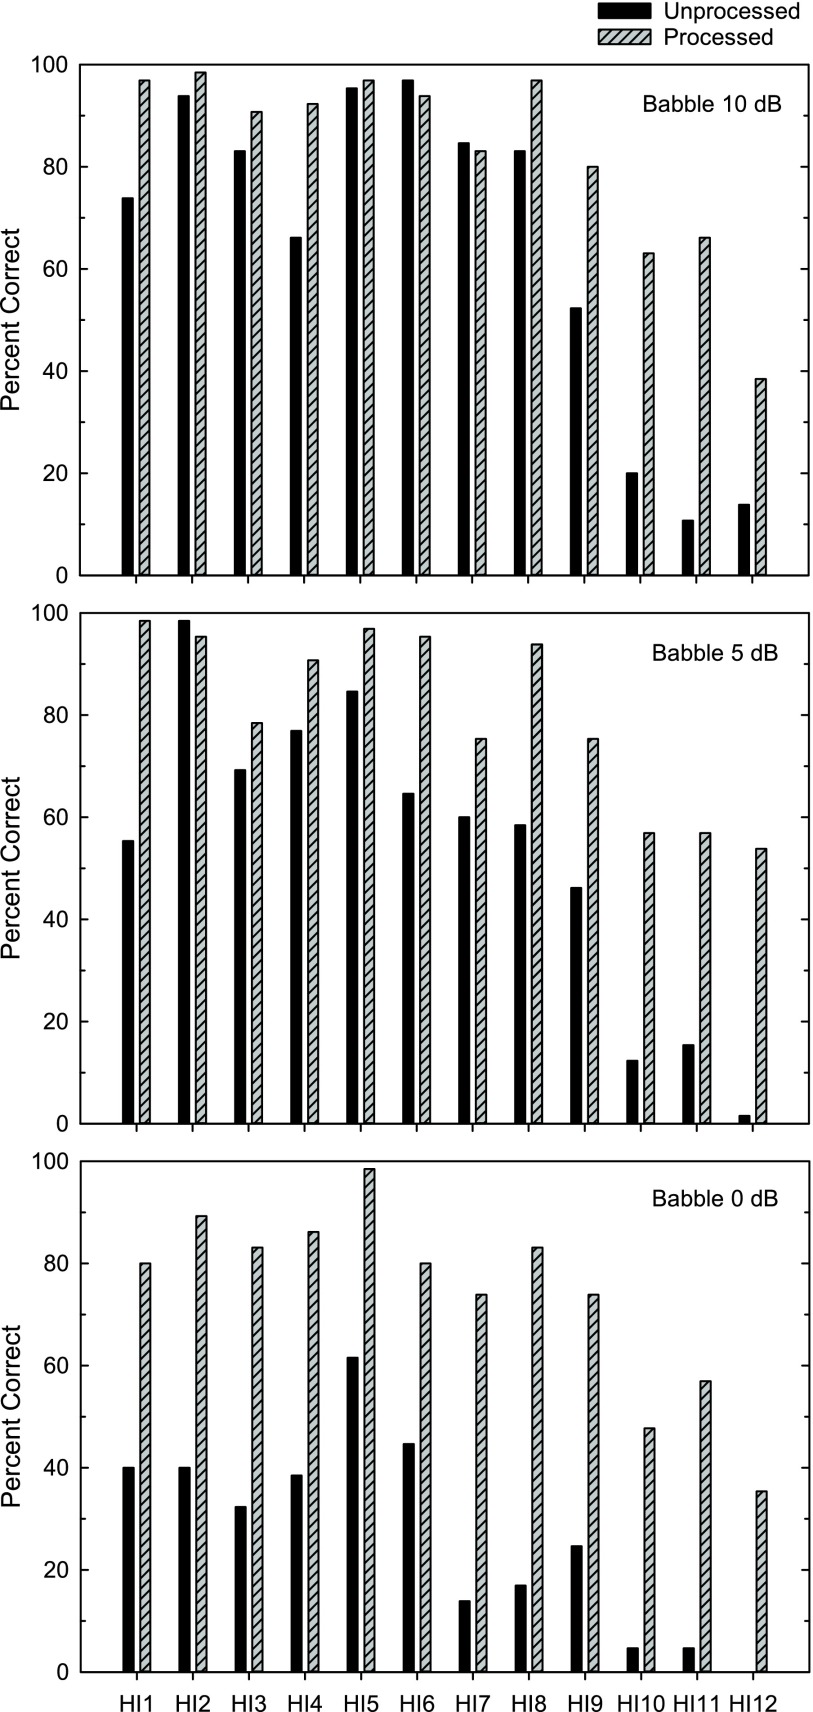
Intelligibility was based on percentage of sentence keywords reported. Figures 4 and 5 display intelligibility for each HI listener. Results for the reverberation plus SSN conditions are displayed in Fig. 4 and those for the reverberation plus babble conditions are displayed in Fig. 5. Each panel corresponds to a different SNR, which is indicated. The black columns represent scores for unprocessed reverberant-noisy speech, and the shaded hatched columns represent scores following algorithm processing. The algorithm benefit for each listener corresponds to the difference between these columns. As anticipated, scores for unprocessed signals generally decreased as HI listener number increased, reflecting poorer baseline performance for the individuals with greater hearing loss.
FIG. 4.
Intelligibility for individual hearing-impaired listeners in reverberation plus speech-shaped noise. The three panels represent the three SNR conditions. The black columns represent scores for unprocessed reverberant-noisy speech, and the shaded hatched columns represent scores following algorithm processing.
FIG. 5.
As Fig. 4, but for the reverberation plus babble conditions.
Apparent from Fig. 4 is that all HI listeners received benefit in all reverberation plus SSN conditions. At least half of the HI listeners received benefit exceeding 20, 40, and 30 percentage points for the SNRs of 5, 0, and −5 dB, respectively. The benefit in SSN exceeded 10 percentage points in over 85% of the 36 cases (12 HI subjects × 3 SNRs).
Apparent from Fig. 5 is that all HI listeners received benefit in the least-favorable babble SNR, and most also received benefit at the two more favorable SNRs. For the 3 exceptions (of 36 cases), unprocessed scores were high (98%, 97%, and 85% correct). At least half of the HI listeners received benefit exceeding 20, 30, and 45 percentage points for the SNRs of 10, 5, and 0 dB, respectively. The benefit in babble exceeded 10 percentage points in over 80% of the 36 cases.
Planned comparisons consisting of paired t-tests on rationalized arcsine units (RAUs, Studebaker, 1985) were conducted to examine algorithm benefit for the HI listeners in each condition displayed in Figs. 4 and 5. Tests comparing the unprocessed and processed scores were significant at each of the SSN SNRs [t(11) ≥ 6.0, p < 0.0001] and at each of the babble SNRs [t(11) ≥ 3.9, p < 0.005]. These significant results all survive Bonferroni correction.
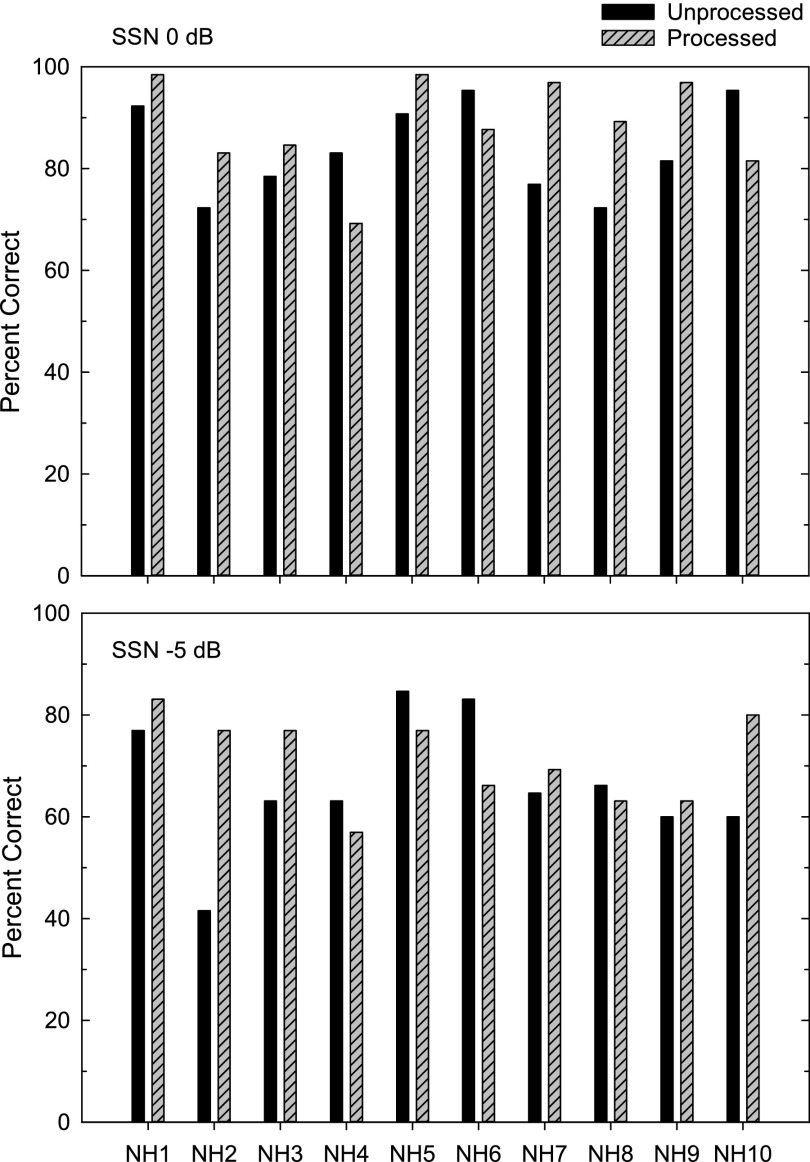
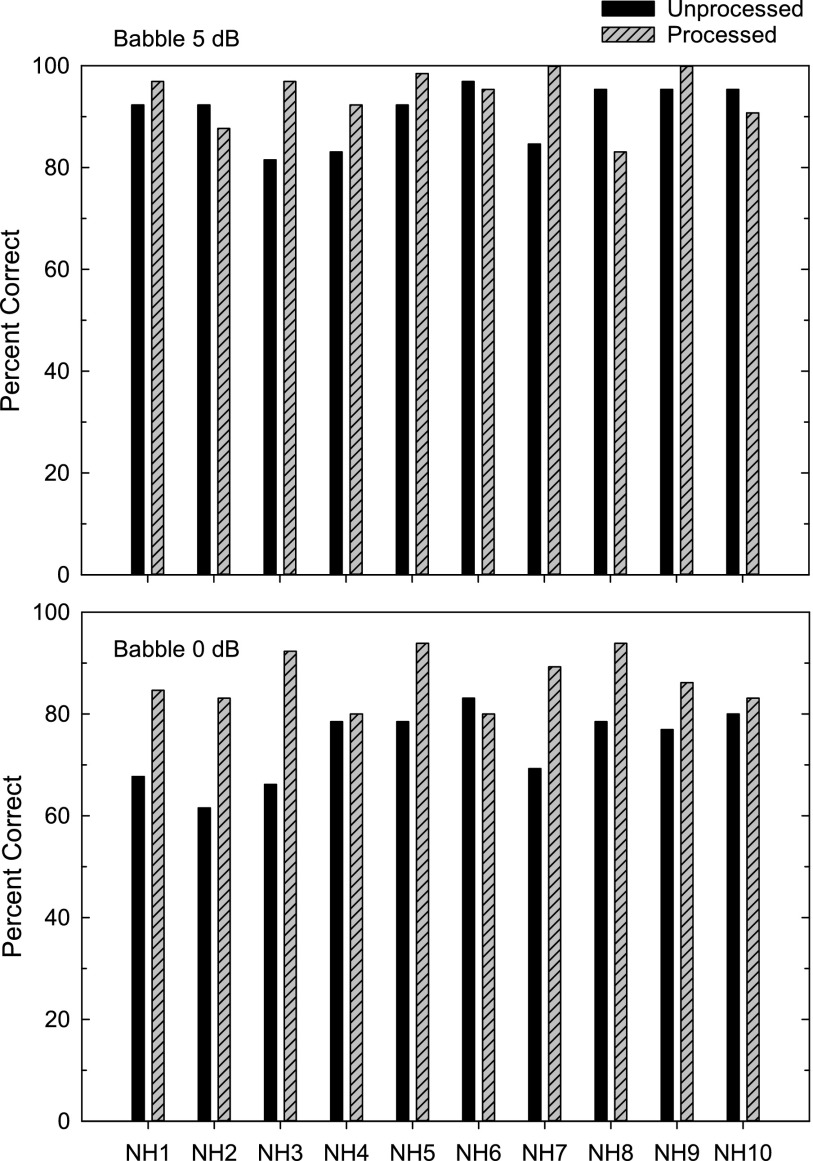
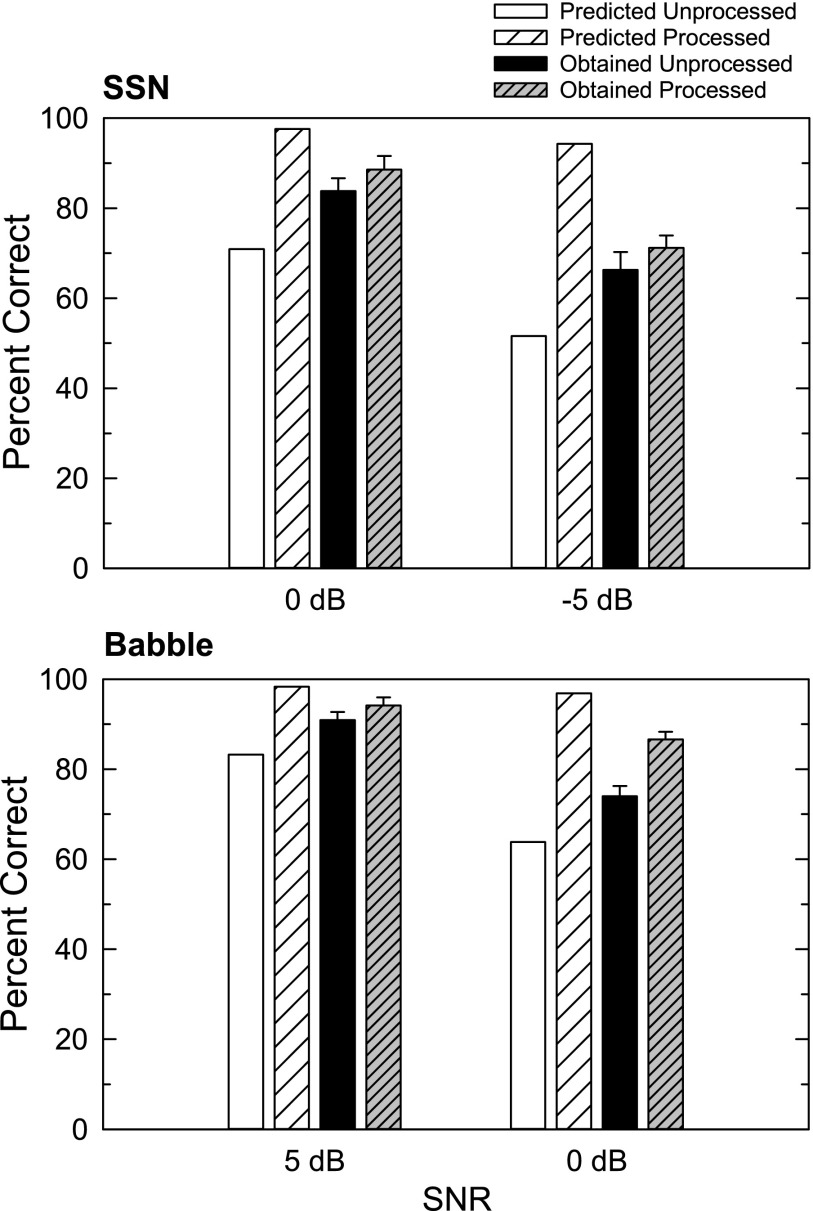
Figures 6 and 7 display intelligibility for the individual NH listeners. Results for the reverberation plus SSN conditions are displayed in Fig. 6 and those for the reverberation plus babble conditions are displayed in Fig. 7. As anticipated, the performance of the NH listeners for the unprocessed reverberant speech in noise was far better than that of their HI counterparts. The mean scores for unprocessed stimuli were 84% and 66% correct for the two SSN SNRs (0 and −5 dB), and 91% and 74% correct for the two babble SNRs (5 and 0 dB). Accordingly, the algorithm benefit was considerably smaller for the NH than for the HI listeners. But some benefit was observed in 65% of cases for SSN and 75% of cases for babble (10 NH listeners × 2 SNR conditions = 20 cases for each noise type).
FIG. 6.
Intelligibility for individual NH listeners in reverberation plus speech-shaped noise. The two panels represent the two SNR conditions. Otherwise, as Fig. 4.
FIG. 7.
As Fig. 6, but for the two reverberation plus babble conditions.
Planned comparisons consisting of paired t-tests on RAUs between unprocessed and processed scores for the NH listeners in each condition of Figs. 6 and 7 indicated that benefit was significant only for the lower SNR babble condition [t(9) = 4.2, p = 0.002]. This significant result survives Bonferroni correction.
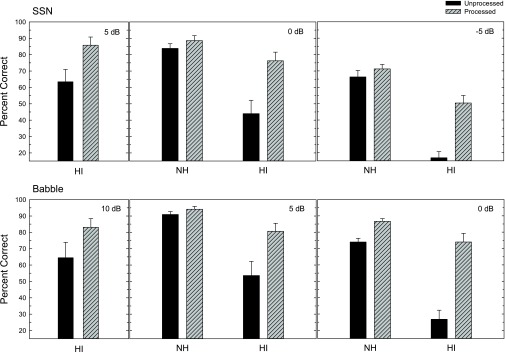
Figure 8 displays group-mean sentence intelligibility scores for both HI and NH listeners in each condition. The group-mean algorithm benefit for the HI listeners was 22, 32, and 33 percentage points for reverberation plus SSN at 5, 0, and −5 dB SNR and 19, 27, and 47 percentage points for reverberation plus babble at 10, 5, and 0 dB SNR. When benefit was expressed in RAUs to control for ceiling and floor effects, these values increased slightly to become 27, 35, and 37 units in reverberation plus SSN, and 21, 31, and 51 units in reverberation plus babble. Benefit for the HI listeners averaged across the three SNRs was 29 percentage points (32 RAUs) in reverberation plus SSN and 31 percentage points (34 RAUs) in reverberation plus babble. The figure also shows that the manipulation of SNR yielded the desired baseline (unprocessed) scores for the HI listeners. The mean baseline intelligibilities ranged from 17% to 63% correct for reverberation plus SSN and from 27% to 64% correct for reverberation plus babble. For the NH listeners, group-mean benefit values were 5 percentage points for both SSN SNRs, and 3 and 13 percentage points at the higher and lower babble SNRs, respectively. These values also increased slightly when expressed in RAUs, to 7 and 5 units at the higher and lower SSN SNRs and 7 and 15 units at the higher and lower babble SNRs.
FIG. 8.
Group-mean intelligibility scores (and standard errors) for HI and NH listeners for reverberant speech in speech-shaped noise (top), and in babble (bottom), at the SNRs indicated. The black columns represent scores for unprocessed reverberant-noisy speech, and the shaded hatched columns represent scores following algorithm processing.
Three-way mixed analyses of variance (ANOVAs) on RAU scores were conducted separately for the two noise types, on the SNRs common to both listener groups. Of primary interest for the SSN analysis (2 [SNR 0/–5 dB] × 2 [HI/NH] × 2 [unprocessed/algorithm]), was the significant main effect of processing [F(1,20) = 57.8, p < 0.0001], which indicated that scores were higher in algorithm-processed than in unprocessed conditions, and the significant interaction between listener type and processing [F(1,20) = 29.2, p < 0.0001], which indicated that benefit was larger for the HI than for the NH listeners. The remaining significant effects were those of listener type [F(1,20) = 24.6, p < 0.0001] and SNR [F(1,20) = 199.0, p < 0.0001], which simply reflected the higher overall scores of the NH listeners and more favorable SNRs. The pattern was similar for the babble analysis (2 [SNR 5/0 dB] × 2 [HI/NH] × 2 [unprocessed/algorithm]). Significant were the main effects of processing [F(1,20) = 119.3, p < 0.0001], the interaction between listener type and processing [F(1,20) = 38.8, p < 0.0001], and the main effects of listener type [F(1,20) = 16.6, p = 0.0006] and SNR [F(1,20) = 101.7, p < 0.0001]. Additional to this analysis was a significant interaction between SNR and processing [F(1,20) = 10.4, p = 0.004], which indicated that the HI listeners benefitted more as the SNR decreased.
Another comparison of interest involves the performance of the HI listeners following algorithm processing relative to the performance of young NH listeners without processing, in the conditions common to both groups. As Fig. 8 shows, the HI listeners matched the performance of the NH listeners in one condition (babble 0 dB SNR) and approached within 10 percentage points in two of the remaining three conditions. Additional planned comparisons (unpaired t-tests on RAUs) between the algorithm-processed scores for the HI listeners and the unprocessed scores for the NH listeners in the four common conditions indicated that differences were not significant (p > 0.05) at the higher SSN SNR and at both babble SNRs. The difference was significant only for the lower SSN SNR [t(20) = 2.5, p = 0.02], and it would become non-significant if corrected using Bonferroni.
A three-way mixed ANOVA (2 [SSN/babble] × 2 [HI/NH] × 2 [unprocessed/algorithm]) was performed on RAU scores in the common conditions of 0 dB SNR. Of primary interest, the main effect of processing [F(1,20) = 98.4, p < 0.0001] indicated that scores were higher in algorithm-processed than in unprocessed conditions, the interaction between listener type and processing [F(1,20) = 33.6, p < 0.0001] indicated that benefit was larger for the HI than for the NH listeners, and the interaction between noise type and processing [F(1,20) = 11.1, p = 0.003] indicated that benefit was larger in babble than in SSN. The main effects of noise type [F(1,20) = 18.3, p = 0.0004] and listener type [F(1,20) = 17.9, p = 0.0004] simply reflected the higher overall scores in the nonstationary background and for the NH listeners, respectively. The interaction between noise and listener type was non-significant (p > 0.05) as was the three-way interaction.
B. Objective measures of intelligibility
In this subsection, an intelligibility metric, the short-time objective intelligibility (STOI) (Taal et al., 2011) and its extention, extended STOI (ESTOI) (Jensen and Taal, 2016), were used to evaluate the proposed algorithm. These objective metrics provide intelligibility predictions based only on analysis of the acoustic signals. The comparison to the human intelligibility scores reported in the previous subsection should facilitate the development of accurate objective speech intelligibility metrics under reverberant-noisy conditions. Another benefit of providing these objective results is to help the interested reader in replicating the current speech-segregation results, as the correct replication will produce the same (or very close) objective scores. The value range of STOI/ESTOI is typically from 0 to 1, where higher values indicate better predicted intelligibility. Since both reverberation and noise are removed by the proposed algorithm, anechoic-clean speech was used as the reference signal when performing STOI/ESTOI evaluation.
Table I shows the average STOI scores for the sentences used in the intelligibility testing at different SNRs for reverberant-noisy speech and corresponding enhanced speech. ESTOI results are presented in Table II. Clearly, substantial STOI/ESTOI score improvements were produced by the proposed algorithm. In addition, as SNR increased, the predicted amount of improvement decreased. This is broadly consistent with human performance.
TABLE I.
Average STOI scores for reverberant-noisy speech (unprocessed) and enhanced speech (processed) from SSN and babble noise at the SNRs indicated.
| SSN | Babble | |||
|---|---|---|---|---|
| SNR (dB) | Unprocessed | Processed | Unprocessed | Processed |
| 10 | — | — | 0.719 | 0.866 |
| 5 | 0.673 | 0.843 | 0.664 | 0.842 |
| 0 | 0.611 | 0.812 | 0.588 | 0.799 |
| −5 | 0.551 | 0.755 | — | — |
TABLE II.
Average ESTOI scores for reverberant-noisy speech (unprocessed) and enhanced speech (processed) from SSN and babble noise at the SNRs indicated.
| SSN | Babble | |||
|---|---|---|---|---|
| SNR (dB) | Unprocessed | Processed | Unprocessed | Processed |
| 10 | — | — | 0.449 | 0.721 |
| 5 | 0.366 | 0.676 | 0.364 | 0.680 |
| 0 | 0.273 | 0.619 | 0.273 | 0.602 |
| −5 | 0.189 | 0.523 | — | — |
STOI/ESTOI scores do not directly correspond to intelligibility in percentage points. In order to obtain percent-correct numbers, the following logistic function was applied to map STOI/ESTOI numbers to predicted intelligibility scores (Taal et al., 2011; Jensen and Taal, 2016):
| (2) |
where a and b are fitted parameter values obtained using a least-squares method, and S is a STOI/ESTOI value. The parameter values obtained for the STOI mapping function in the current experiments were a = −14.23, b = 7.77. It should be mentioned that a reasonable logistic function for ESTOI mapping could not be obtained, so the same parameter values as for STOI mapping were utilized.
Since the STOI and ESTOI were developed for predicting the intelligibility for NH listeners, the following discussion is limited to the results for NH listeners and their corresponding test SNRs. The mean improvements in STOI-predicted intelligibility were 27 and 43 percentage points for SSN (0 and −5 dB SNR), and 15 and 33 percentage points for babble (5 and 0 dB SNR). Figure 9 compares STOI-predicted recognition scores and actual recognition scores. The actual improvements were substantially smaller than those predicted in all conditions. In general, these results suggest that the STOI tends to underestimate human performance for unprocessed reverberant-noisy speech and overestimate human performance for processed speech. The current observation is somewhat different from those for noisy speech enhancement, for which the STOI overpredicts intelligibility for both unprocessed and processed signals (Healy et al., 2015; Kressner et al., 2016).
FIG. 9.
Comparison of STOI-predicted and obtained NH percent-correct intelligibility scores, for unprocessed and algorithm-processed reverberant-noisy speech. The noise types and SNRs are indicated.
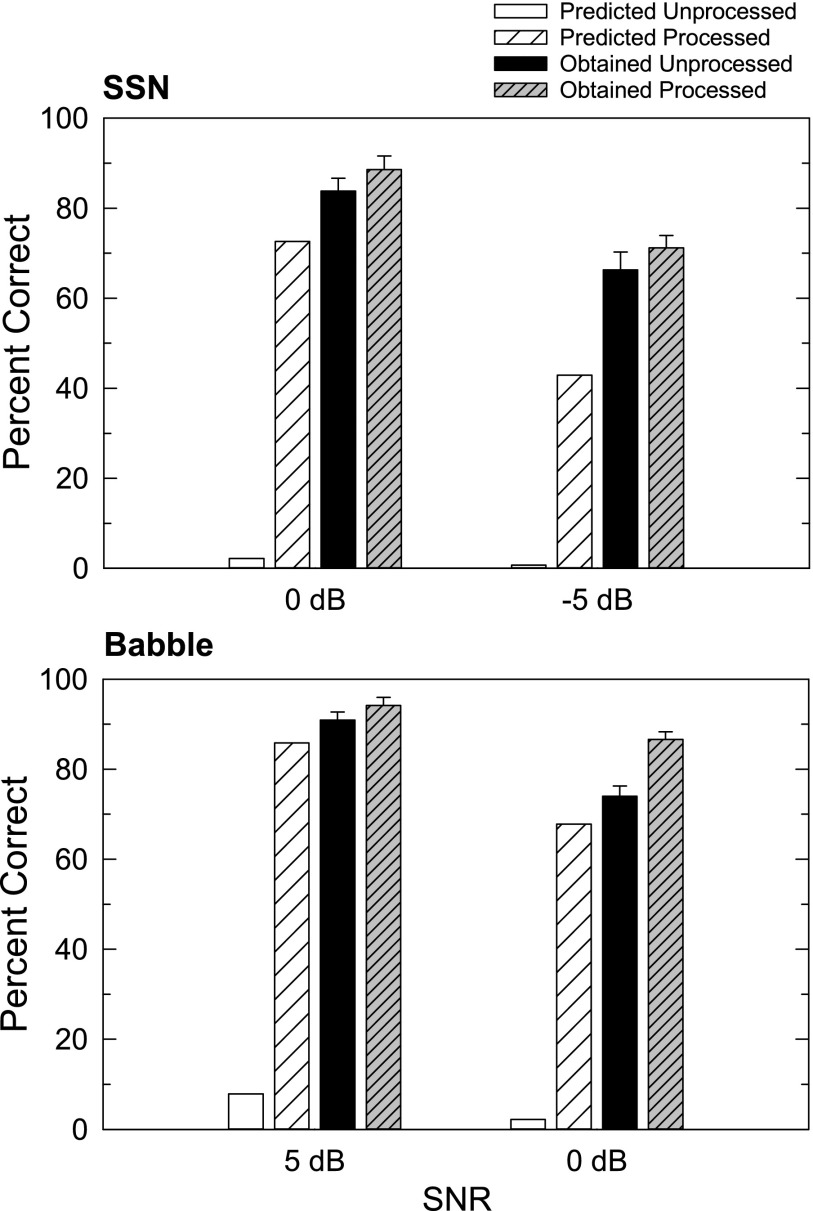
Figure 10 compares ESTOI-predicted recognition scores and actual recognition scores. The ESTOI underestimated the intelligibility of both unprocessed and processed speech, especially for unprocessed speech. Therefore, a better mapping function should be developed for ESTOI scores.
FIG. 10.
As Fig. 9, but for ESTOI-predicted intelligibility scores.
IV. GENERAL DISCUSSION AND CONCLUSION
The performance difference between HI listeners and their NH counterparts (particularly younger NH listeners) is evident in the current results, where different SNRs were required and different baseline (unprocessed) scores were obtained. Similar differences were found in our previous work, despite the variety of tasks employed (e.g., Healy et al., 2013; Healy et al., 2015; Chen et al., 2016; Healy et al., 2017). But a consistent result is that HI listeners with processing can approach or match the intelligibility demonstrated by young NH listeners without processing (see Fig. 8). This suggests that the proposed algorithm can be an effective approach for helping HI listeners in reverberant-noisy environments where the intelligibility gap relative to NH listeners is clearly large.
Figures 9 and 10 compare scores for the widely used objective intelligibility metric STOI and its updated version ESTOI with actual intelligibility scores obtained from human listeners for the same stimuli. Discrepancies were found between the predicted and obtained values. These discrepancies were particularly large for the ESTOI predictions of the current reverberant-noisy conditions. This suggests that, although STOI/ESTOI are widely used as indicators of human speech intelligibility, they cannot serve as a substitute for actual human-listener testing. The inclusion of reverberation in the current study appears to make these objective metrics even less accurate. Better metrics need to be developed that deal with both background noise and room reverberation, as well as the effects of hearing loss.
When the IRM is used for reverberant-noisy speech segregation, a key question involves what we should attempt to extract from the reverberant-noisy speech. Said differently, what mask should serve as the algorithm's training target? One straightforward choice is to remove both reverberation and noise so as to approximate anechoic-clean speech, as adopted currently. However, according to intelligibility studies using the IBM (Roman and Woodruff, 2011; Li et al., 2015), another reasonable choice would be to extract both the direct sound (anechoic speech) and its early reflections (e.g., those arriving within 50 ms after direct sound; see Roman and Woodruff, 2011). To compare these two choices, two different models were trained with the same underlying DNN structure but using either anechoic speech or direct sound plus early reflections as the desired signal. Both models also removed noise. Informal listening indicated that the first choice was no poorer than the second one, resulting in the current use of anechoic-clean speech as the target. Using anechoic-clean speech as the target signal in the IRM definition may also result in better speech quality, because more reverberation is removed.
Given the challenge of improving HI listeners' speech intelligibility in reverberant-noisy conditions, we prioritized performance over implementation issues such as amenability to real-time processing and computational efficiency. From the perspective of real-time processing, one limitation of the current DNN algorithm is its use of future frames in IRM estimation, making the algorithm non-causal. Although future frames clearly carry useful contextual information, it has been recently shown that recurrent neural networks encode past context better than the feedforward DNN used in the current study, resulting in a causal system with no poorer performance (Chen and Wang, 2017). Future work will investigate such causal methods. Shorter time frames and smaller networks will also reduce processing latency.
In conclusion, a DNN was trained to estimate the IRM for anechoic noise-free speech and was tested on reverberant-noisy speech. Substantial intelligibility benefit was obtained for HI listeners at T60 = 0.6 s for speech in both stationary and nonstationary noises at various SNRs. NH listeners also demonstrated some benefit. Further, the intelligibility obtained by the HI listeners after processing approached or matched that of their young NH counterparts before processing. To our knowledge, the current study provides the first evidence of speech intelligibility improvements produced by a monaural segregation algorithm in reverberant-noisy conditions.
ACKNOWLEDGMENTS
This work was supported in part by grants from the National Institute on Deafness and other Communication Disorders (R01 DC012048 to D.L.W. and R01 DC015521 to E.W.H.). We gratefully acknowledge data-collection assistance from Jordan Vasko, computing resources from the Ohio Supercomputer Center, and comments from Brian C.J. Moore.
References
- 1. Allen, J. B. , and Berkley, D. A. (1979). “ Image method for efficiently simulating small-room acoustics,” J. Acoust. Soc. Am. 65, 943–950. 10.1121/1.382599 [DOI] [Google Scholar]
- 2.ANSI (1987). S3.39 (R2012), Specification for Instruments to Measure Aural Acoustic Impedance and Admittance (Aural Acoustic Immittance) ( American National Standards Institute, New York: ). [Google Scholar]
- 3.ANSI (2004). S3.21 (R2009), American National Standard Methods for Manual Pure-Tone Threshold Audiometry ( American National Standards Institute, New York: ). [Google Scholar]
- 4.ANSI (2010). S3.6, American National Standard Specification for Audiometers ( American National Standards Institute, New York: ). [Google Scholar]
- 5. Anzalone, M. C. , Calandruccio, L. , Doherty, K. A. , and Carney, L. H. (2006). “ Determination of the potential benefit of time-frequency gain manipulation,” Ear Hear. 27, 480–492. 10.1097/01.aud.0000233891.86809.df [DOI] [PMC free article] [PubMed] [Google Scholar]
- 6. Brookes, M. (2005). “ VOICEBOX: Speech processing toolbox for MATLAB,” http://www.ee.ic.ac.uk/hp/staff/dmb/voicebox/voicebox.html (Last viewed 09/18/2018).
- 7. Byrne, D. , and Dillon, H. (1986). “ The National Acoustic Laboratories' (NAL) new procedure for selecting the gain and frequency response of a hearing aid,” Ear Hear. 7, 257–265. 10.1097/00003446-198608000-00007 [DOI] [PubMed] [Google Scholar]
- 8. Chen, J. , and Wang, D. L. (2017). “ Long short-term memory for speaker generalization in supervised speech separation,” J. Acoust. Soc. Am. 141, 4705–4714. 10.1121/1.4986931 [DOI] [PMC free article] [PubMed] [Google Scholar]
- 9. Chen, J. , Wang, Y. , Yoho, S. E. , Wang, D. L. , and Healy, E. W. (2016). “ Large-scale training to increase speech intelligibility for hearing-impaired listeners in novel noises,” J. Acoust. Soc. Am. 139, 2604–2612. 10.1121/1.4948445 [DOI] [PMC free article] [PubMed] [Google Scholar]
- 10. Clevert, D.-A. , Unterthiner, T. , and Hochreiter, S. (2015). “ Fast and accurate deep network learning by exponential linear units (ELUs),” arXiv:1511.07289.
- 11. Gelfand, S. A. , and Hochberg, I. (1976). “ Binaural and monaural speech discrimination under reverberation,” Audiology 15, 72–84. 10.3109/00206097609071765 [DOI] [PubMed] [Google Scholar]
- 12. George, E. L. J. , Goverts, S. T. , Festen, J. M. , and Houtgast, T. (2010). “ Measuring the effects of reverberation and noise on sentence intelligibility for hearing-impaired listeners,” J. Speech Hear. Res. 53, 1429–1439. 10.1044/1092-4388(2010/09-0197) [DOI] [PubMed] [Google Scholar]
- 13. Glorot, X. , Bordes, A. , and Bengio, Y. (2011). “ Deep sparse rectifier neural networks,” in International Conference on Artificial Intelligence and Statistics, pp. 315–323. [Google Scholar]
- 14. Habets, E. (2014). “ Room impulse response generator,” https://www.audiolabs-erlangen.de/fau/professor/habets/software/rir-generator (Last viewed 09/18/2018).
- 15. Han, K. , Wang, Y. , and Wang, D. L. (2014). “ Learning spectral mapping for speech dereverberation,” in IEEE International Conference on Acoustics, Speech and Signal Processing (ICASSP), pp. 4628–4632. [Google Scholar]
- 16. Han, K. , Wang, Y. , Wang, D. L. , Woods, W. S. , Merks, I. , and Zhang, T. (2015). “ Learning spectral mapping for speech dereverberation and denoising,” IEEE/ACM Trans. Audio Speech Lang. Proc. 23, 982–992. 10.1109/TASLP.2015.2416653 [DOI] [Google Scholar]
- 17. Hazrati, O. , and Loizou, P. C. (2012). “ The combined effects of reverberation and noise on speech intelligibility by cochlear implant listeners,” Int. J. Audiol. 51, 437–443. 10.3109/14992027.2012.658972 [DOI] [PMC free article] [PubMed] [Google Scholar]
- 18. Healy, E. W. , Delfarah, M. , Vasko, J. L. , Carter, B. L. , and Wang, D. L. (2017). “ An algorithm to increase intelligibility for hearing-impaired listeners in the presence of a competing talker,” J. Acoust. Soc. Am. 141, 4230–4239. 10.1121/1.4984271 [DOI] [PMC free article] [PubMed] [Google Scholar]
- 19. Healy, E. W. , Yoho, S. E. , Chen, J. , Wang, Y. , and Wang, D. L. (2015). “ An algorithm to increase speech intelligibility for hearing-impaired listeners in novel segments of the same noise type,” J. Acoust. Soc. Am. 138, 1660–1669. 10.1121/1.4929493 [DOI] [PMC free article] [PubMed] [Google Scholar]
- 20. Healy, E. W. , Yoho, S. E. , Wang, Y. , and Wang, D. L. (2013). “ An algorithm to improve speech recognition in noise for hearing-impaired listeners,” J. Acoust. Soc. Am. 134, 3029–3038. 10.1121/1.4820893 [DOI] [PMC free article] [PubMed] [Google Scholar]
- 21. Helfer, K. S. , and Wilber, L. A. (1990). “ Hearing loss, aging, and speech perception in reverberation and noise,” J. Speech Hear. Res. 33, 149–155. 10.1044/jshr.3301.149 [DOI] [PubMed] [Google Scholar]
- 22. Hu, Y. , and Kokkinakis, K. (2014). “ Effects of early and late reflections on intelligibility of reverberated speech by cochlear implant listeners,” J. Acoust. Soc. Am. 135, EL22–EL28. 10.1121/1.4834455 [DOI] [PMC free article] [PubMed] [Google Scholar]
- 23. Hummersone, C. , Mason, R. , and Brookes, T. (2010). “ Dynamic precedence effect modeling for source separation in reverberant environments,” IEEE Trans. Audio. Speech Lang. Proc. 18, 1867–1871. 10.1109/TASL.2010.2051354 [DOI] [Google Scholar]
- 24. Ioffe, S. , and Szegedy, C. (2015). “ Batch normalization: Accelerating deep network training by reducing internal covariate shift,” arXiv:1502.03167.
- 25. Jensen, J. , and Taal, C. H. (2016). “ An algorithm for predicting the intelligibility of speech masked by modulated noise maskers,” IEEE/ACM Trans. Audio Speech Lang. Proc. 24, 2009–2022. 10.1109/TASLP.2016.2585878 [DOI] [Google Scholar]
- 26. Kingma, D. , and Ba, J. (2014). “ Adam: A method for stochastic optimization,” arXiv:1412.6980.
- 27. Kressner, A. A. , May, T. , and Rozell, C. J. (2016). “ Outcome measures based on classification performance fail to predict the intelligibility of binary-masked speech,” J. Acoust. Soc. Am. 139, 3033–3036. 10.1121/1.4952439 [DOI] [PubMed] [Google Scholar]
- 28. Kuttruff, H. (2000). Room Acoustics, 4th ed. ( Spon Press, New York: ). [Google Scholar]
- 29. Li, J. , Xia, R. , Fang, Q. , Li, A. , Pan, J. , and Yan, Y. (2015). “ Effect of the division between early and late reflections on intelligibility of ideal binary-masked speech,” J. Acoust. Soc. Am. 137, 2801–2810. 10.1121/1.4919287 [DOI] [PubMed] [Google Scholar]
- 30. Monaghan, J. J. M. , Goehring, T. , Yang, X. , Bolner, F. , Wang, S. , Wright, M. C. M. , and Bleeck, S. (2017). “ Auditory inspired machine learning techniques can improve speech intelligibility and quality for hearing-impaired listeners,” J. Acoust. Soc. Am. 141, 1985–1998. 10.1121/1.4977197 [DOI] [PubMed] [Google Scholar]
- 31. Nábělek, A. K. , and Mason, D. (1981). “ Effect of noise and reverberation on binaural and monaural word identification by subjects with various audiograms,” J. Speech Hear. Res. 24, 375–383. 10.1044/jshr.2403.375 [DOI] [PubMed] [Google Scholar]
- 32. Nábělek, A. K. , and Robinson, P. K. (1982). “ Monaural and binaural speech perception in reverberation for listeners of various ages,” J. Acoust. Soc. Am. 71, 1242–1248. 10.1121/1.387773 [DOI] [PubMed] [Google Scholar]
- 33. Roman, N. , and Woodruff, J. (2011). “ Intelligibility of reverberant noisy speech with ideal binary masking,” J. Acoust. Soc. Am. 130, 2153–2161. 10.1121/1.3631668 [DOI] [PubMed] [Google Scholar]
- 34. Roman, N. , and Woodruff, J. (2013). “ Speech intelligibility in reverberation with ideal binary masking: Effects of early reflections and signal-to-noise ratio threshold,” J. Acoust. Soc. Am. 133, 1707–1717. 10.1121/1.4789895 [DOI] [PubMed] [Google Scholar]
- 35. Rothauser, E. H. , Chapman, W. D. , Guttman, N. , Nordby, K. S. , Silbiger, H. R. , Urbanek, G. E. , and Weinstock, M. (1969). “ IEEE recommended practice for speech quality measurements,” IEEE Trans. Audio Electroacoust. 17, 225–246. 10.1109/TAU.1969.1162058 [DOI] [Google Scholar]
- 36. Santos, J. F. , and Falk, T. H. (2017). “ Speech dereverberation with context-aware recurrent neural networks,” arXiv:1711.06309.
- 37. Srivastava, N. , Hinton, G. E. , Krizhevsky, A. , Sutskever, I. , and Salakhutdinov, R. (2014). “ Dropout: A simple way to prevent neural networks from overfitting,” J. Mach. Learn. Res. 15, 1929–1958. [Google Scholar]
- 38. Studebaker, G. A. (1985). “ A ‘rationalized’ arcsine transform,” J. Speech Hear. Res. 28, 455–462. 10.1044/jshr.2803.455 [DOI] [PubMed] [Google Scholar]
- 39. Taal, C. H. , Hendriks, R. C. , Heusdens, R. , and Jensen, J. (2011). “ An algorithm for intelligibility prediction of time–frequency weighted noisy speech,” IEEE Trans. Audio. Speech Lang. Proc. 19, 2125–2136. 10.1109/TASL.2011.2114881 [DOI] [PubMed] [Google Scholar]
- 40. Wang, D. L. (2005). “ On ideal binary mask as the computational goal of auditory scene analysis,” in Speech Separation by Humans and Machines, edited by Divenyi P. ( Kluwer, Norwell, MA: ), pp. 181–197. [Google Scholar]
- 41. Wang, D. L. , Kjems, U. , Pedersen, M. S. , Boldt, J. B. , and Lunner, T. (2009). “ Speech intelligibility in background noise with ideal binary time-frequency masking,” J. Acoust. Soc. Am. 125, 2336–2347. 10.1121/1.3083233 [DOI] [PubMed] [Google Scholar]
- 42. Wang, Y. , Han, K. , and Wang, D. L. (2013). “ Exploring monaural features for classification-based speech segregation,” IEEE Trans. Audio. Speech Lang. Proc. 21, 270–279. 10.1109/TASL.2012.2221459 [DOI] [Google Scholar]
- 43. Wang, Y. , Narayanan, A. , and Wang, D. L. (2014). “ On training targets for supervised speech separation,” IEEE/ACM Trans. Audio Speech Lang. Proc. 22, 1849–1858. 10.1109/TASLP.2014.2352935 [DOI] [PMC free article] [PubMed] [Google Scholar]
- 44. Wang, Y. , and Wang, D. L. (2013). “ Towards scaling up classification-based speech separation,” IEEE Trans. Audio. Speech Lang. Proc. 21, 1381–1390. 10.1109/TASL.2013.2250961 [DOI] [Google Scholar]
- 45. Wu, B. , Li, K. , Yang, M. , and Lee, C.-H. (2017). “ A reverberation-time-aware approach to speech dereverberation based on deep neural networks,” IEEE/ACM Trans. Audio Speech Lang. Proc. 25, 102–111. 10.1109/TASLP.2016.2623559 [DOI] [Google Scholar]
- 46. Yoshioka, T. , Sehr, A. , Delcroix, M. , Kinoshita, K. , Maas, R. , Nakatani, T. , and Kellermann, W. (2012). “ Making machines understand us in reverberant rooms: Robustness against reverberation for automatic speech recognition,” IEEE Sign. Proc. Mag. 29, 114–126. 10.1109/MSP.2012.2205029 [DOI] [Google Scholar]
- 47. Zhao, Y. , Wang, D. L. , Merks, I. , and Zhang, T. (2016). “ DNN-based enhancement of noisy and reverberant speech,” in IEEE International Conference on Acoustics, Speech and Signal Processing (ICASSP), pp. 6525–6529. [Google Scholar]
- 48. Zhao, Y. , Wang, Z.-Q. , and Wang, D. L. (2017). “ A two-stage algorithm for noisy and reverberant speech enhancement,” in IEEE International Conference on Acoustics, Speech and Signal Processing (ICASSP), pp. 5580–5584. [Google Scholar]


