

Abstract
Aim
Capillary refill time has been widely adopted for clinical assessment of the circulatory status of patients in emergency settings. We previously introduced quantitative capillary refill time and found a positive association between longer quantitative capillary refill time and higher lactate levels in the intensive care units, but not in the emergency department. In this study, we aimed to identify a quantitative and clinically applicable index of circulatory status (ΔA b) that can be measured with quantitative capillary refill time, then evaluated the linear association between this index and lactate levels in the emergency department.
Methods
We undertook a prospective single‐center observational study at a university hospital from November 2015 to July 2016. We included 139 patients with endogenous diseases to test the association between quantitative capillary refill time, ΔA b (measured with a pulse oximeter), and lactate levels.
Results
ΔA b was independently and significantly associated with high lactate levels (odds ratio [95% confidence interval]: 0.16 [0.05–0.45]).
Conclusions
We introduced ΔA b, measured using quantitative capillary refill time, as a surrogate index of lactate levels to overcome the shortcomings of capillary refill time. We showed that ΔA b is a feasible, non‐invasive, and rapid assessment of patients with high lactate levels in emergency primary care settings. Future multicenter studies with a longitudinal design should be undertaken to verify our findings.
Keywords: Blood gas analysis, emergency services, lactic acid, shock, triage
Introduction
Capillary refill time (CRT) has been widely adopted as a clinical assessment of circulatory status.1 Measuring CRT in emergency settings is beneficial for assessing disease severity in patients as testing is easy, rapid, and non‐invasive. However, data on the validity and reliability of CRT have been inconsistent,2, 3 and the main concerns include the lack of objectivity (e.g., time measurements are not automated) and dependence on visual assessments by examiners.2, 3
To overcome these limitations, we previously developed quantitative CRT (Q‐CRT).4 In that pilot study, we found a positive association between longer Q‐CRT and higher lactate levels in 23 patients in the intensive care unit.4 However, we did not show a linear relationship between an index of circulatory status and patient outcome variables in the emergency department. Also, a larger sample size was needed to reach adequate statistical power. We were able to measure transmitted light quantity through Q‐CRT; measuring transmitted light quantity might be more stable and objective than Q‐CRT itself because the former minimizes bias.
The purpose of this study was to introduce a quantitative and clinically applicable index of circulatory status that can be measured using Q‐CRT. We also carried out a prospective study to evaluate the linear association between Q‐CRT, the index of circulatory status, and lactate levels in a patient sample with sufficient statistical power.
Materials and Methods
Setting
This study was a prospective single‐center observational study undertaken at the Yokohama City University Hospital (Yokohama, Japan). The hospital's catchment area is the southern area of Yokohama City, which had an estimated population of 3.7 million in 2017.
Design
This study design was an observational prospective study, and no sample size calculation was carried out because it was an explanatory study. The study was approved by the Institutional Review Board of Yokohama City University. All patients gave informed consent to participate in the study.
Patients
Of 1,399 outpatients in our hospital's emergency department from November 2015 to July 2016, we were able to measure Q‐CRT in 168 patients (12%) because we used only a single Q‐CRT measuring device in the department. The emergency department consisted of two emergency physicians, a cardiologist, a respirologist, a gastroenterologist, an orthopedist, and a neurosurgeon, with only one of seven physicians working during the night shift. When either of the emergency physicians worked, we measured Q‐CRT. We excluded trauma patients, patients undergoing dialysis, and those with missing blood laboratory test data (n = 29). After applying these criteria, 139 patients with endogenous diseases were eligible for this study.
Measurement of quantitative capillary refill time and ∆A b
Figure 1 shows wearing of the apparatus for measuring Q‐CRT, Figure 2 depicts the schema of Q‐CRT measurements. Transmitted light quantity measured by a pulse oximeter equipped with an SpO2 sensor is related to blood volume, based on Lambert–Beer's law.5 Mechanical pressure with 500 mmHg lasting 5 s is applied to the index finger. This stops blood flow, and transmitted light quantity increases. When the pressure is removed, blood flow restarts, and transmitted light quantity decreases. In our previous study, we defined Q‐CRT as the time in seconds from the release of the pressure to the time when the blood flow reached 90% of the original flow, which was measured for 5 s at the beginning of the test before applying pressure.
Figure 1.
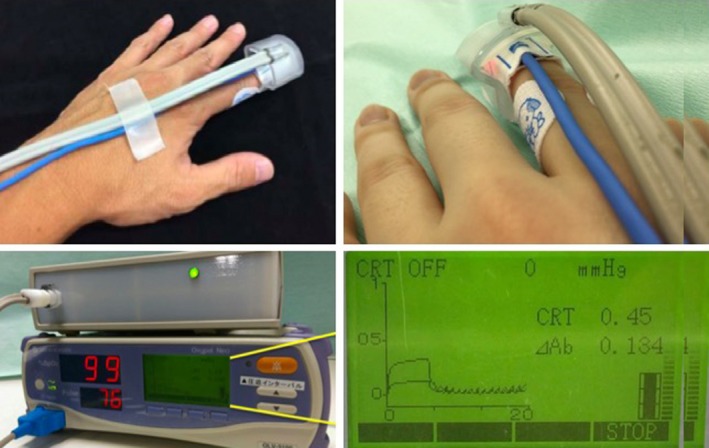
Wearing of the apparatus for measuring quantitative capillary refill time. Put the apparatus on the finger with a pulse oximeter.
Figure 2.
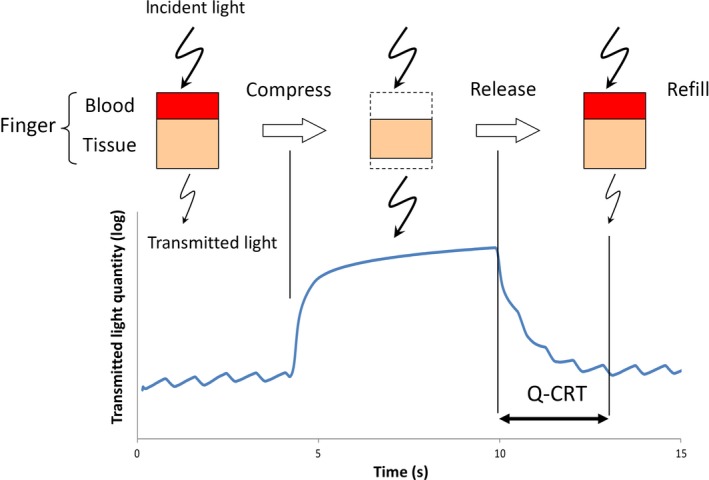
Schematic of quantitative capillary refill time measurements. Transmitted light quantity obtained by a pulse oximeter equipped with a hemoglobin saturation of oxygen sensor is related to blood volume, based on Lambert–Beer's law.5 Q‐CRT, quantitative capillary refill time.
Transmitted light quantity (A) measured by a pulse oximeter is defined by subtracting the light quantity input value from the output value, which is equivalent to the amount of light absorbed into finger tissue, and blood flow. Transmitted light quantity is then obtained through the following equation, based on Lambert–Beer's law:5
| (1) |
where L in is incident light intensity, L out is transmitted light intensity, A b is the degree of dimming by blood, A t is the degree of dimming by tissue without blood, E b is the absorptivity coefficient (dL/g*cm) of blood, H b is hemoglobin density (g/dL), D b is the thickness of tissue with blood flow (cm), Z t is the rate of the degree of dimming by tissue without blood, and D t is the thickness of tissue without blood (cm).
Transmitted light quantity through compression equals dimmed light quantity through absorption into the tissue and reduced blood thickness:
| (2) |
where A comp is transmitted light quantity when compressed, is transmitted light intensity when compressed, is transmitted light quantity through tissue without blood when compressed, and is the thickness of tissue without blood when compressed (cm).
Subtracting equation (2) from equation (1) provides equation (3), which measures changes in transmitted light quantity by compression and also represents the sum of the degree of dimming through blood and tissue without blood:
| (3) |
Because the pulse oximeter uses both red and infrared light, equations (1) and (2) can be expressed as:
| (4) |
| (5) |
where R denotes all indices and values obtained under red light and IR denotes all indices and values obtained under infrared light.
In equations (4) and (5), is considered equal to . The quantity of light dimmed by blood only defines ∆A b (delta A b), which is the difference between the quantity of light dimmed under infrared light and that dimmed under red light. The index is calculated by subtracting equation (4) from equation (5) (Fig. 3):
Figure 3.
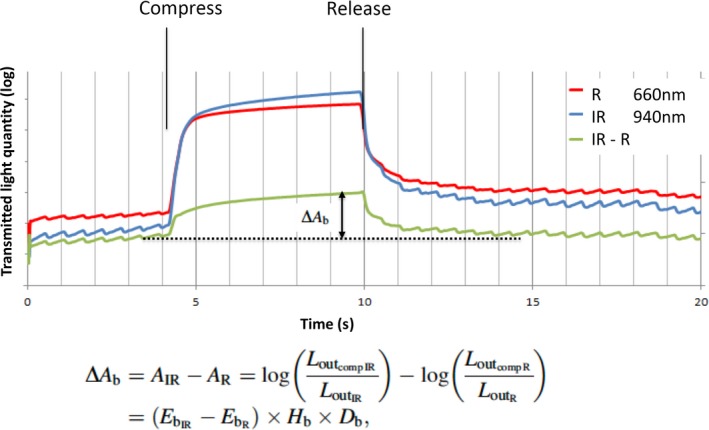
Calculation of the ∆A b index of circulatory status. Dimmed light quantity by blood alone defines ∆A b (delta A b), which is the difference between the degree of dimmed light under infrared light and under red light.
| (6) |
This equation shows ∆A b equal to (IR absorption coefficient − R absorption coefficient) × hemoglobin density × tissue thickness with blood flow. ∆A b is valid only for blood data.
Data collection and variables
We obtained data on the following patient characteristics and clinical information following arrival at the outpatient department: age (years), sex, body temperature (°C), systolic blood pressure (mmHg), heart rate (b.p.m.), respiratory rate (breaths/min), SpO2 (%), white blood cell count (×109/L), hemoglobin (g/dL), albumin (g/dL), blood urea nitrogen (mg/dL), creatinine (mg/dL), C‐reactive protein (mg/dL), sodium (Na; mEq/L), potassium (K; mEq/L), chloride (Cl; mEq/L), Q‐CRT (s), and ΔA b. We classified the main condition of a disease based on the International Statistical Classification of Diseases and Related Health Problems 10th Revision, version 2016, to classify patients as having the following conditions: “certain infectious and parasitic diseases”, “neoplasms”, “diseases of the blood and blood‐forming organs and certain disorders involving the immune mechanism”, “endocrine, nutritional and metabolic diseases”, “mental and behavioural disorders”, “diseases of the nervous system”, “diseases of the eye and adnexa”, “diseases of the ear and mastoid process”, “disease of the circulatory system”, “diseases of the respiratory system”, “diseases of the digestive system”, “diseases of the skin and subcutaneous tissue”, “disease of the musculoskeletal system and connective tissue”, ”diseases of the genitourinary system”, “pregnancy, childbirth and the puerperium”, “certain conditions originating in the perinatal period”, “congenital malformations, deformations and chromosomal abnormalities”, and “symptoms, signs, and abnormal clinical and laboratory findings, not elsewhere classified”, “injury, poisoning, and certain other consequences of external causes”.
Venous lactic acid concentration (mmol/L) was used as the outcome variable. Based on the reference value for lactic acid, we adopted 2 mmol/L as the cut‐off value.6, 7, 8 We assigned patients with a lactic acid level ≥2 mmol/L to the high lactate group, and those with lactate level <2 mmol/L to the normal lactate group.
Statistical analysis
First, to compare patient characteristics and laboratory data between the two groups, the Mann–Whitney U‐test and χ2‐test were used for continuous and categorical variables, respectively. Second, we categorized ΔA b into two groups based on the median value, as the value was expected to have an unknown distribution. Finally, we applied a multiple logistic regression model to test the association between ΔA b and the high lactate group. Covariates included patient characteristics and laboratory data. We also used the Hosmer–Lemeshow goodness‐of‐fit test to evaluate the validity of the regression model; P > 0.05 indicated model adequacy.9 Stata version 13.1 (StataCorp, College Station, TX, USA) was used for all analyses, and a two‐tailed P < 0.05 was considered statistically significant.
Results
Of the 139 eligible patients, 45 and 94 were classified to the high and normal lactate groups, respectively. Tables 1 and 2 show the results of the comparisons of patient characteristics and laboratory data between the high and normal lactate groups. ΔA b was significantly lower in the high lactate group (P < 0.001). For both the high and normal lactate groups, we observed higher rates of patients having “certain infectious and parasitic diseases”, “diseases of the respiratory system”, and “diseases of the digestive system”. However, no significant differences in the distribution of disease types were found between the two groups. We also found no significant associations between the other variables and the high lactate group.
Table 1.
Univariate associations between lactate levels and study variables among patients with endogenous diseases treated in an emergency department (n = 139)
| <2 mmol/L (n = 94) | ≥2 mmol/L (n = 45) | P‐value | |
|---|---|---|---|
| Age, years | 55 (13–94) | 60 (19–97) | 0.181 |
| Gender, femalea | 49 (−40%) | 18 (−40%) | 0.181 |
| BT, °C | 36.5 (35.1–39.7) | 36.5 (34.6–40.1) | 0.446 |
| SBP, mmHg | 133 (77–230) | 143 (97–220) | 0.185 |
| HR, b.p.m. | 83 (45–136) | 84 (51–144) | 0.874 |
| RR, breaths/min | 20 (12–38) | 20 (12–40) | 0.371 |
| SpO2, % | 98 (78–100) | 98 (86–100) | 0.506 |
| Hb, g/dL | 13.2 (7.1–16.5) | 13.5 (6.6–16.2) | 0.525 |
| WBC, /μL | 7700 (2500–22 200) | 7500 (4200–38 600) | 0.389 |
| Alb, g/dL | 4.1 (2.3–5.1) | 4 (2.1–4.9) | 0.716 |
| BUN, mg/dL | 14 (5–61) | 16 (7–74) | 0.161 |
| Crea, mg/dL | 0.73 (0.32–4.3) | 0.74 (0.43–2.84) | 0.412 |
| CRP, mg/dL | 0.12 (0.01–24.4) | 0.11 (0.01–46.70) | 0.776 |
| Na, mEq/L | 140 (133–144) | 140 (128–146) | 0.813 |
| K, mEq/L | 3.8 (2.1–4.7) | 3.8 (2.9–5.2) | 0.679 |
| Cl, mEq/L | 105 (97–112) | 104 (86–110) | 0.284 |
| Q‐CRT, s | 1.82 (0.57–6.80) | 2.32 (0.81–6.97) | 0.053 |
| ΔA b | 0.053 (−0.022 to 0.150) | 0.028 (−0.040 to 0.115) | <0.001 |
ΔA b, calculated index of circulatory status; Alb, albumin; BT, body temperature; BUN, blood urea nitrogen; Cl, chloride; Crea, creatinine; CRP, C‐reactive protein; Hb, hemoglobin; HR, heart rate; K, potassium; Na, sodium; Q‐CRT, quantitative capillary refill time; RR, respiratory rate; SBP, systolic blood pressure; SpO2, hemoglobin saturation; WBC, white blood cell.
Frequency (%); others represent: median (minimum–maximum).
Table 2.
Lactate levels and disease type based on ICD‐10a
| normal lactate group (n = 94) | high lactate group (n = 45) | |||
|---|---|---|---|---|
| Certain infectious and parasitic diseases | 21 | 22% | 4 | 9% |
| Neoplasms | 0 | 0% | 1 | 2% |
| Diseases of the blood and blood‐forming organs and certain disorders involving the immune mechanism | 1 | 1% | 0 | 0% |
| Endocrine, nutritional and metabolic diseases | 0 | 0% | 0 | 0% |
| Mental and behavioral disorders | 1 | 1% | 0 | 0% |
| Diseases of the nervous system | 7 | 7% | 2 | 4% |
| Diseases of the eye and adnexa | 0 | 0% | 0 | 0% |
| Diseases of the ear and mastoid process | 4 | 4% | 4 | 9% |
| Diseases of the circulatory system | 6 | 6% | 4 | 9% |
| Diseases of the respiratory system | 12 | 13% | 6 | 13% |
| Diseases of the digestive system | 16 | 17% | 11 | 24% |
| Diseases of the skin and subcutaneous tissue | 4 | 4% | 1 | 2% |
| Diseases of the musculoskeletal system and connective tissue | 6 | 6% | 1 | 2% |
| Diseases of the genitourinary system | 4 | 4% | 3 | 7% |
| Pregnancy, childbirth and the puerperium | 0 | 0% | 0 | 0% |
| Certain conditions originating in the perinatal period | 0 | 0% | 0 | 0% |
| Congenital malformations, deformations and chromosomal abnormalities | 0 | 0% | 0 | 0% |
| Symptoms, signs, and abnormal clinical and laboratory findings, not elsewhere classified | 7 | 7% | 4 | 9% |
| Injury, poisoning, and certain other consequences of external causes | 5 | 5% | 4 | 9% |
Fisher's exact test: P = 0.627
ΔA b was not normally distributed; therefore, we used the median ΔA b value of 0.0445 as the cut‐off for further analysis. In the multivariate analysis, we considered the model adequately fitted the data, as the Hosmer–Lemeshow goodness‐of‐fit test result was not significant (P = 0.972). After controlling for all other variables, ΔA b was independently and significantly associated with the high lactate group (odds ratio [95% confidence interval], 0.16 [0.05–0.45]; Table 3). The Na and Cl concentrations were also independently associated with the high lactate group (P = 0.049 and 0.030, respectively).
Table 3.
Association between higher severity and calculated index of circulatory status (ΔA b) based on multivariate analysis among patients with endogenous diseases treated in an emergency department (n = 139)
| Odds ratio | (95% CI) | P‐value | ||
|---|---|---|---|---|
| Age | 1.01 | (0.99–1.04) | 0.353 | |
| Gender | (0, female; 1, male) | 1.53 | (0.57–4.11) | 0.404 |
| BT | 0.74 | (0.45–1.19) | 0.211 | |
| SBP | 1.01 | (0.99–1.03) | 0.328 | |
| HR | 1.02 | (0.99–1.05) | 0.159 | |
| RR | 1.06 | (0.98–1.16) | 0.158 | |
| SpO2 | 1.15 | (0.93–1.42) | 0.208 | |
| Hb | 1.11 | (0.80–1.55) | 0.528 | |
| WBC | 1.00 | (1.00–1.00) | 0.622 | |
| Alb | 1.14 | (0.31–4.25) | 0.846 | |
| BUN | 1.02 | (0.94–1.11) | 0.631 | |
| Crea | 1.37 | (0.23–8.09) | 0.726 | |
| CRP | 0.99 | (0.88–1.12) | 0.908 | |
| Na | 1.28 | (1.00–1.63) | 0.049 | |
| K | 1.39 | (0.47–4.13) | 0.557 | |
| Cl | 0.81 | (0.67–0.98) | 0.03 | |
| ΔA b | (0, <0.0445; 1, ≥0.0445) | 0.16 | (0.05–0.45) | 0.001 |
| Hosmer–Lemeshow goodness‐of‐fit test (χ2‐test value [P‐value]) | 2.25 | −0.972 | ||
ΔAb, calculated index of circulatory status; Alb, albumin; BT, body temperature; BUN, blood urea nitrogen; CI, confidence interval; Crea, creatinine; Cl, chloride; CRP, C‐reactive protein; Hb, hemoglobin; HR, heart rate; K, potassium; Na, sodium; RR, respiratory rate; SBP, systolic blood pressure; SpO2, hemoglobin saturation; WBC, white blood cell.
Discussion
In this study, we devised ΔA b, based on our previous study on Q‐CRT, as an index of high lactate to overcome the shortcomings of CRT. In both univariate and multivariate analyses, a lower ΔA b, indicating lower blood flow, was independently and significantly associated with the high lactate group. Our findings have clinical implications because we showed that ΔA b is a feasible, non‐invasive, and rapid assessment method for high lactate in patients being examined in emergency primary care settings. A lower ΔA b indicates poor blood flow, and this allows physicians to immediately prepare for necessary treatments. The use of ΔA b for triage in the emergency department might help in the early detection of ill patients.
ΔA b values could predict a patient's lactate level, for which a cut‐off of 2 mmol/L was used in this study. Survivors among patients with shock showed a decrease in lactic acid levels of 10% per hour after the beginning of treatment.10 Also, survival in patients with sepsis was associated with early lactate normalization, defined as a decline to <2.0 mmol/L during the first 6 h of resuscitation or >50% lactate clearance, defined by dividing the difference between the initial lactic level and the level after 6 h by the initial level.11 Our finding of a significant association between a lower ΔA b and a lactic acid level >2 mmol/L indicates that ΔA b could be an adequate surrogate marker for high lactate.
There are four potential mechanisms associated with a decrease in ΔA b, based on equation (6). First, decreased oxidation might be related to a lower ΔA b. A decline in oxidized hemoglobin and oxygen saturation could cause a decreased absorptivity coefficient (E), which would then contribute to a lower ΔA b. Second, reduced hemoglobin and increased methemoglobin and carboxyhemoglobin levels could increase absorptivity coefficients, resulting in a lower ΔA b. Third, anemia and bleeding likely cause decreased hemoglobin levels, which again may result in a lower ΔA b. Finally, shock, strong and sharp pain, or hypothermia under certain conditions can cause decreased peripheral circulation blood volume and constricted peripheral arteries, causing lower ΔA b.12, 13, 14 Therefore, ΔA b could indicate the level of oxygen saturation and blood flow in a patient.
The Na and Cl concentrations were also independently associated with high lactate. High Na might result from dehydration,15 leading to high lactate levels, and low Cl might result from metabolic alkalosis,16 leading to high lactate levels.
Limitations
This study has several limitations. First, the lactic acid level (the outcome in our study) was measured in peripheral venous blood. Venous and arterial blood might show inconsistent lactic acid levels, pH, bicarbonate, and base excess in a blood gas analysis.17, 18, 19, 20 However, venous and arterial lactate acid levels were both significantly associated with poor outcomes in patients with shock.21 Second, we did not measure the tourniquet time and elapsed time, and the time until drawing blood after the Q‐CRT and ΔA b measurement. Potentially unequal timing of these measurements might have caused differences in Q‐CRT and ΔA b. However, as procedures in emergency outpatient departments are carried out systematically, a stable environment for measuring Q‐CRT would be provided. Third, patient characteristics and disease stages might have varied in our sample, although the distribution of diseases was not statistically different between the two groups. Fourth, we could not establish a causal relationship between ΔA b and lactic acid levels as this was an observational study. Fifth, we were only able to measure Q‐CRT in 12% of all outpatients in our department and measured by only emergency physicians. Even though the analyzed patients represented mostly day‐time outpatients, this low percentage might limit applying our findings to other facilities. Finally, this was a single‐center study; therefore, our findings might not apply to patients in other facilities and other regions, and might not be generalizable.
Conclusion
In conclusion, in this study, we introduced ΔA b, as assessed through Q‐CRT, as an index of lactate levels to overcome the shortcomings of Q‐CRT. We show that ΔA b is a feasible, non‐invasive, and rapid assessment of lactate levels in emergency primary care settings. Future multicenter studies with a longitudinal design are needed to verify our findings.
Funding information
This work was supported by the Japan Society for the Promotion of Science (KAKENHI Grant No. 15K10989), and this work was contracted research with Nihon Kohden Corporation.
Disclosure
Approval of the research protocol: The study was approved by the Institutional Review Board of Yokohama City University.
Informed consent: All patients have informed consent.
Registry and the registration no. of the study: B150601017. Registered with clinical trials of Yokohama City University Hospital.
Animal studies: N/A.
Conflict of interest: None declared.
Acknowledgements
We thank Jane Charbonneau, DVM, from Edanz Group for editing a draft of this manuscript.
References
- 1. Beecher HK, Simeone FA, Burnett CH, Shapiro SL, Sullivan ER, Mallory TB. The internal state of the severely wounded man on entry to the most forward hospital. Surgery 1947; 22: 672–711. [PubMed] [Google Scholar]
- 2. Schriger DL, Baraff LJ. Defining normal capillary refill: variation with age, sex, and tempreature. Ann. Emerg. Med. 1988; 17: 932–5. [DOI] [PubMed] [Google Scholar]
- 3. Schriger DL, Baraff LJ. Capillary refill‐ is it a useful predictor of hypovolemic status ? Ann. Emerg. Med. 1991; 20: 601–5. [DOI] [PubMed] [Google Scholar]
- 4. Morimura N, Takahashi K, Doi T et al A pilot study of quantitative capillary refill time to identify high blood lactate levels in critically ill patients. Emerg. Med. J. 2015; 32: 444–8. [DOI] [PubMed] [Google Scholar]
- 5. Aoyagi T. Pulse oximetry: its invention, theory, and future. J. Anesth. 2003; 17: 259–66. [DOI] [PubMed] [Google Scholar]
- 6. Bloom BM, Grundlingh J, Bestwick JP, Harris T. The role of venous blood gas in the emergency department: a systematic review and meta‐analysis. Eur. J. Emerg. Med. 2014; 21: 81–8. [DOI] [PubMed] [Google Scholar]
- 7. Nichol AD, Egi M, Pettila V et al Relative hyperlactatemia and hospital mortality in critically ill patients: a retrospective multi‐centre study. Crit. Care 2010; 14: R25. [DOI] [PMC free article] [PubMed] [Google Scholar]
- 8. Rishu AH, Khan R, Al‐Dorzi HM et al Even mild hyperlactatemia is associated with increased mortality in critically ill patients. Crit. Care 2013; 17: R197. [DOI] [PMC free article] [PubMed] [Google Scholar]
- 9. Hosmer DW, Lemeshow S, Sturdivant RX. Applied Logistic Regression. New York, NY: John Wiley & Sons, 2013. [Google Scholar]
- 10. Vincent JL, Dufaye P, Berre J, Leeman M, Degaute JP, Kahn RJ. Serial lactate determinations during circulatory shock. Crit. Care Med. 1983; 11: 449–51. [DOI] [PubMed] [Google Scholar]
- 11. Puskarich MA, Trzeciak S, Shapiro NI et al Whole blood lactate kinetics in patients undergoing quantitative resuscitation for severe sepsis and septic shock. Chest 2013; 143: 1548–53. [DOI] [PMC free article] [PubMed] [Google Scholar]
- 12. Brunauer A, Kokofer A, Bataar O et al Changes in peripheral perfusion relate to visceral organ perfusion in early septic shock: a pilot study. J. Crit. Care 2016; 35: 105–9. [DOI] [PubMed] [Google Scholar]
- 13. Lima A, Bakker J. Clinical assessment of peripheral circulation. Curr. Opin. Crit. Care 2015; 21: 226–31. [DOI] [PubMed] [Google Scholar]
- 14. Lima A, Jansen TC, van Bommel J, Ince C, Bakker J. The prognostic value of the subjective assessment of peripheral perfusion in critically ill patients. Crit. Care Med. 2009; 37: 934–8. [DOI] [PubMed] [Google Scholar]
- 15. Agrawal V, Agarwal M, Joshi SR, Ghosh AK. Hyponatremia and hypernatremia: disorders of water balance. J. Assoc. Physicians India 2008; 56: 956–64. [PubMed] [Google Scholar]
- 16. Galla JH, Gifford JD, Luke RG, Rome L. Adaptations to chloride‐depletion alkalosis. Am. J. Physiol. 1991; 261: 771–81. [DOI] [PubMed] [Google Scholar]
- 17. Theerawit P, Na Petvicharn C, Tangsujaritvijit V, Sutherasan Y. The correlation between arterial lactate and venous lactate in patients with sepsis and septic shock. J. Intensive Care Med. 2018; 33: 116–120. [DOI] [PubMed] [Google Scholar]
- 18. Gallagher EJ, Rodriguez K, Touger M. Agreement between peripheral venous and arterial lactate levels. Ann. Emerg. Med. 1997; 29: 479–83. [PubMed] [Google Scholar]
- 19. Khan ZH, Samadi S, Sadeghi M et al Prospective study to determine possible correlation between arterial and venous blood gas values. Acta Anaesthesiol. Taiwan. 2010; 48: 136–9. [DOI] [PubMed] [Google Scholar]
- 20. Kelly AM. Review article: can venous blood gas analysis replace arterial in emergency medical care. Emerg. Med. Australas. 2010; 22: 493–8. [DOI] [PubMed] [Google Scholar]
- 21. Broder G, Weil MH. Excess lactate: an index of reversibility of shock in human patients. Science 1964; 143: 1457–9. [DOI] [PubMed] [Google Scholar]