Abstract
Methods for joint activity reconstruction and attenuation reconstruction of time-of-flight (TOF) PET data provide an effective solution to attenuation correction when no (or incomplete or inaccurate) information on attenuation is available. One of the main barriers limiting use of these methods in clinical practice is their lack of validation in a relatively large patient database. In this contribution, we aim to validate reconstruction performed with maximum-likelihood activity reconstruction and attenuation registration (MLRR) in a whole-body patient dataset. Furthermore, a partial validation (because the scale problem of the algorithm is avoided for now) of reconstruction performed with maximum-likelihood activity and attenuation (MLAA) is also provided. We present a quantitative comparison between these 2 methods of joint reconstruction and the current clinical gold standard, maximum-likelihood expectation maximization (MLEM) with CT-based attenuation correction. Methods: The whole-body TOF PET emission data of each patient dataset were processed as a whole to reconstruct an activity volume covering all the acquired bed positions, helping reduce the problem of a scale per bed position in MLAA to a global scale for the entire activity volume. Three reconstruction algorithms were used: MLEM, MLRR, and MLAA. A maximum-likelihood scaling of the single-scatter simulation estimate to the emission data was used for scatter correction. The reconstruction results for various regions of interest were then analyzed. Results: The joint reconstructions of the whole-body patient dataset provided better quantification than the gold standard in cases of PET and CT misalignment caused by patient or organ motion. Our quantitative analysis showed a difference of −4.2% ± 2.3% between MLRR and MLEM and a difference of −7.5% ± 4.6% between MLAA and MLEM, averaged over all regions of interest. Conclusion: Joint reconstruction of activity and attenuation provides a useful means to estimate tracer distribution when CT-based-attenuation images are subject to misalignment or are not available. With an accurate estimate of the scatter contribution in the emission measurements, the joint reconstructions of TOF PET data are within clinically acceptable accuracy.
Keywords: quantitative analysis, joint reconstruction, time-of-flight PET
Because time-of-flight (TOF) PET data have been shown to provide information about the medium attenuating the emission data (1), several algorithms have been developed to exploit the added information available with TOF. Most newly developed methods have aimed at jointly reconstructing an activity image and an attenuation image from the TOF PET emission data (2–4). Furthermore, several methods have been proposed that avoid reconstruction of the attenuating medium and instead estimate the attenuation correction values, which more directly influence the TOF emission measurements (5–7). However, in event-based reconstruction methods that avoid the need for a sinogram (e.g., origin ensembles, list-mode reconstruction algorithms), the attenuation correction values cannot be estimated but their backprojection can (also commonly referred to as the sensitivity image) (8,9).
The attenuation information available in TOF emission data does not allow quantitative assessment of the reconstructed distribution of activity, because the TOF data determine the activity distribution only up to a constant scale. This limitation may be the main reason joint-reconstruction methods have not yet been clinically introduced. Recently, methods have been proposed that take advantage of the CT images commonly available in state-of-the-art TOF PET/CT scanners (10–12). Whereas the method proposed by Panin et al. (10) aims at completing the sinogram of the attenuation correction factors for planes for which no CT measurements are available, other methods aim at deforming the CT-based attenuation image to correct for any possible mismatch between the CT and PET acquisitions (11,12). Use of the energy-adjusted CT images in the joint-reconstruction framework automatically overcomes the scale problem. In addition to these methods using the added information from the CT image, other scale correction techniques for joint reconstruction of activity and attenuation can be found in the literature. These include methods using tissue-prior maps to optimize initialization of the joint-reconstruction algorithm (13), methods using an intensity prior for the expected values of the tissues being reconstructed (4,14), methods that attempt to solve the problem by adding transmission sources to the scanner (15,16) or by using the lutetium background radiation source as the transmission source (17), and methods that ambitiously try to determine the scale from the scattered events in the emission data (18).
Another factor limiting the clinical use of joint-reconstruction is the lack of comprehensive validation of these methods in a large patient database. Although studies have been performed on several patient datasets, these studies have been restricted mainly to 3-dimensional simulations, oftentimes even ignoring some data corrections that are routine in clinical practice (e.g., corrections for scatter and random events). In one initial study (19), after the scale problem had been taken into account, the results of the joint-reconstruction method were similar to the gold standard without the effects of motion. Three other studies (20–22) have found that joint-reconstruction methods outperformed methods using an MR-based scheme for attenuation correction of the TOF PET emission data. The studies demonstrated that the joint-reconstruction methods could remove MR-related artifacts that otherwise would propagate into the emission reconstruction. In a fourth, retrospective, study (23), a joint-reconstruction method was analyzed in a relatively larger dataset of cardiac patients. As expected, the proposed method could remove the possible PET/CT mismatch. The study also showed that the CT mismatch affected the scatter estimate, which in turn affected the final reconstruction. However, another study (24) found that in a collection of 18F-FDG brain scans, activity in the reconstructed activity images was more biased with the joint-reconstruction method than with an atlas-based correction of attenuation. Finally, there was a study (25) in which the accuracy of another joint-reconstruction method—maximum-likelihood attenuation correction factors—was analyzed on a set of patient brain scans. The authors reported that the joint reconstruction was comparable to the gold standard once a plane-dependent scaling of the activity had been applied.
In this study, we performed a quantitative analysis of a set of whole-body patient images obtained using 2 joint-reconstruction algorithms in comparison with the current clinical gold standard, MLEM with attenuation correction using a CT image adjusted to the 511-keV photon energy of PET.
MATERIALS AND METHODS
Data Acquisition and Processing
In total, 23 whole-body 18F-FDG patient scans were acquired on the Siemens Biograph mCT scanner (26) at the New York University Medical Center. The local institutional review board approved this study, and informed consent was obtained from all subjects. On average, each patient was injected with 550 MBq of the 18F-FDG tracer and scanned an hour after injection. The emission data were acquired at 5–8 different bed positions, each scanned for 120 s. The data were collected in 5-dimensional sinograms consisting of 400 radial bins of 2.005-mm width, 168 azimuth angles over 180°, a combined 621 planes of 2.027-mm width for the direct and oblique (segments ±1, ±2,…) planes, and 13 TOF bins of 312-ps width. The e7tools provided by Siemens were used to process the raw data and to generate the expected scatter and randoms contribution of the emission measurements independently for each bed position. Because the joint-reconstruction methods estimate more parameters than the standard MLEM algorithm, they tend to respond differently to data inconsistencies (supplemental material of Rezaei et al. (27)). This difference can lead to an underestimation of joint-reconstruction performance compared with gold-standard performance. Hence, as proposed by Rezaei et al. (27), a plane-dependent maximum-likelihood scaling of the single-scatter simulation (28) estimate was obtained from the emission data. This maximum-likelihood scaling of the single-scatter simulation estimate was used for scatter correction during reconstructions.
Reconstructions
The entire scanned part of the patient body was reconstructed into a single volume, using the TOF PET emission data from all bed positions simultaneously. The in-house projector still worked on a bed-by-bed basis, but the projections and backprojections were computed using a single whole-body volume. Before reconstruction, the data were mashed in the radial direction with a mashing factor of 2, and the activity and attenuation images were reconstructed into a 200 × 200 pixel grid of 4.0724-mm width transaxially and up to 543 planes of 2.007-mm width axially. The TOF resolution of the scanner was modeled as a gaussian that, after convolution with a top-hat binning window of 312 ps, gave an effective resolution of 580 ps in full width at half maximum.
Three algorithms were used to reconstruct the tracer distribution: MLEM; maximum-likelihood activity reconstruction and attenuation registration (MLRR) (11), which aims to reconstruct an activity image while deforming an available CT-based attenuation image such that the pair of images best fit the measurements; and maximum-likelihood activity and attenuation (MLAA) (3), which reconstructs an activity image together with an attenuation image directly from the emission data.
The MLEM reconstructions were performed after 3 iterations and 24 subsets. The MLRR reconstructions were performed with the same iteration scheme, and in each of these 72 subiterations the activity was updated once and the attenuation 3 times. A uniform-activity image inside the field of view was used to initialize the algorithm together with the zero-vector displacement field. The displacement field was updated only inside the patient support, was computed from the CT-based attenuation image, and was regularized by a fluidlike and diffusionlike regularization of the displacement field.
In the case of MLAA, the activity and attenuation reconstructions were performed after 5 iterations of 24 subsets, with the attenuation image being updated 3 times for each update of the activity reconstruction. The algorithm was initialized with uniform activity in the field of view and uniform tissue attenuation (0.095 cm−1) in the patient support. To eliminate any confounding effects of the scale factor in the reconstructions, the scale problem in MLAA was fixed by imposing the total activity of the MLEM reconstruction. The total activity of MLEM was computed within a volume inside the patient support, excluding regions that could be affected by patient motion, such as from the lungs and their neighboring regions, and the same volume was used to scale the MLAA image during iterations. A thresholding of the CT-based attenuation image was used to extract the patient lungs, followed by a morphologic dilation (with an elliptic neighborhood kernel of 2- and 3-cm radius in the transaxial and axial directions, respectively) of the mask to limit the influence of motion-affected regions.
Because the convergence of MLRR, MLAA, and MLEM may differ, standard activity images were produced by standard MLEM reconstructions (3 iterations of 24 subsets) using the MLRR and MLAA attenuation estimates. Here, we refer to these images as MLAA or MLRR activity reconstructions, although they actually are MLEM reconstructions obtained with the MLAA or MLRR attenuation map. In all cases, the final activity reconstruction was smoothed with a gaussian of 6 mm in full width at half maximum.
Image Analysis
The activity reconstructions were compared and evaluated in various regions of interest (ROIs). A separate mask was generated by segmenting the bladder, liver, heart, a lumbar vertebra, and some tumors or inflammatory lesions with high local uptake. These organ masks were generated by thresholding the MLAA reconstructed activity image. The CT-based attenuation image was also used for segmentation of the spinal region, providing an initial mask for delineation of the lumbar vertebrae. The bladder and lumbar vertebra regions were chosen to show the behavior of the algorithms in regions where no patient motion was expected. The liver region was chosen because its activity is typically used as a reference, and the dome of the liver occasionally suffers from attenuation correction errors due to breathing-induced mismatches between PET and CT. The heart region and the regions of the tumors and inflammatory lesions are the clinically relevant regions in patient studies, which are typically subject to in-scan patient motion.
In our comparative analysis, the mean difference between 2 activity reconstructions, X and Y, being compared was computed in all segmented regions of interest as follows:
| Eq. 1 |
where X is considered the reference method. Mean ± SD is reported. When differences between multiple regions or patients are combined, mean ± SD is reported for the absolute value of the region differences or patient differences.
RESULTS
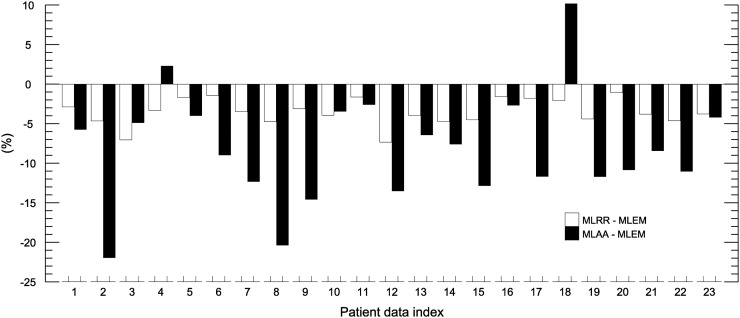
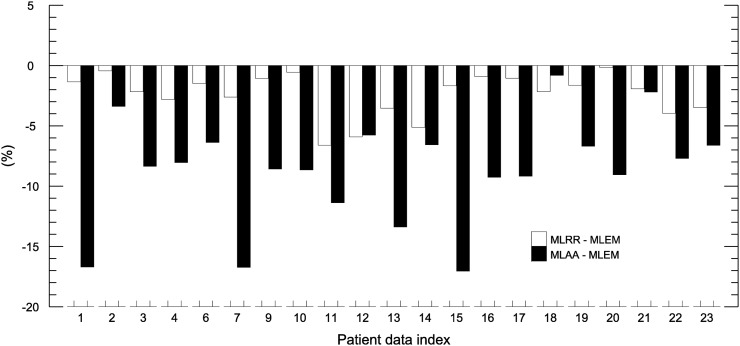
Figures 1 and 2 show the mean differences in activity between MLRR and MLEM and between MLAA and MLEM for the bladder and segmented vertebra regions, respectively. On average, MLRR and MLAA resulted in a relative difference of −3.6% ± 1.7% and −8.1% ± 7.0%, respectively, for the bladder region. For the segmented vertebra region, the average difference was −2.4% ± 1.8% and −8.7% ± 4.4% for MLRR and MLAA, respectively.
FIGURE 1.
Mean differences in bladder-region activity between MLRR and MLEM and between MLAA and MLEM. Bladder-to-liver ratios of our patient database are given in Supplemental Figure 1.
FIGURE 2.
Mean differences in segmented vertebra-region activity between MLRR and MLEM and between MLAA and MLEM. Vertebra-to-liver ratios of our patient database are given in Supplemental Figure 1.
To gain more insight into the differences observed for MLAA, a new set of MLAA activity images was reconstructed. This time, the MLAA attenuation image was initialized with the deformed CT-based attenuation image of MLRR, and the MLAA activity image was initialized with the corresponding MLEM activity image (i.e., MLEM of 3 iterations and 24 subsets using the deformed CT-based attenuation image). The mean difference between this new set of MLAA images and the MLEM images, and between this new set of MLAA images and the original MLAA images, was −8.5% ± 7.0% and −0.1% ± 1.1%, respectively, for the bladder region. Similar results were obtained for the vertebra region, with a difference of −7.6% ± 5.4% and 1.3% ± 1.1%, respectively. Furthermore, the likelihood was computed by forward projection of the reconstructions obtained with the CT-based, MLRR-based, and MLAA-based attenuation images. We found the likelihood of MLAA to be, on average, 2.7% higher than that of MLRR, which in turn was 4.2% higher than that of MLEM. This finding suggests that the observed differences were not related to the convergence of MLAA reconstructions. We believe that this increase in likelihood was due to data inconsistencies (e.g., the attenuation image or the scanner calibrations), which are better accounted for in MLAA than in MLRR and better accounted for in MLRR than in MLEM. The segmented bladder–to–liver contrast, as well as the average contrast of the segmented vertebra region to the liver, can be found in the supplemental materials (available at http://jnm.snmjournals.org).
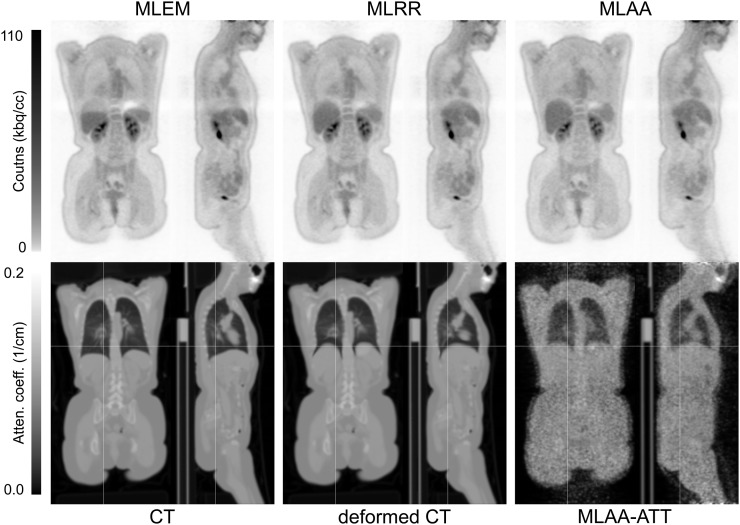
In standard practice, a volume of interest well within the liver region is segmented to quantify the activity concentration in the liver. However, the CT data are often acquired and reconstructed in a breathing phase that differs from the average breathing pose of the PET scan, a factor that can result in significant artifacts in activity reconstructions of the PET emission data. Figure 3 shows such a case in which the CT and PET data were acquired at different phases of the breathing cycle. Whereas MLEM was greatly affected by the between-scan mismatch, MLAA provided accurate values in the motion-affected area. Despite such extensive internal motion, MLRR was also able to produce a motion-corrected reconstruction using a deformed CT attenuation image.
FIGURE 3.
Activity (top) and attenuation (bottom) obtained using MLEM, MLRR, and MLAA for patient dataset in which CT and PET data were acquired at different phases of breathing cycle. (Reprinted with permission of (30).)
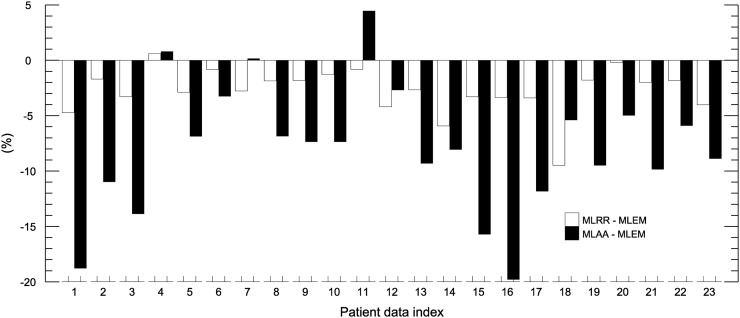
An initial naïve segmentation of the liver region (which included most of the liver and therefore possible motion-affected areas) was used to compare the activity reconstructions, showing a difference of 2.0% ± 18.5% between MLRR and MLEM and 0.4% ± 32.0% between MLAA and MLEM. Further improving the segmented liver region by avoiding the superior parts of the liver, which could be affected by motion, we found an average difference of −2.8% ± 2.1% between MLRR and MLEM over the entire patient database. For MLAA, the average difference from MLEM was −7.9% ± 5.9%. A bar plot of the quantification results for the segmented liver region is shown in Figure 4.
FIGURE 4.
Mean differences in segmented liver-region activity (avoiding superior parts of liver, which are expected to be affected by motion) between MLRR and MLEM and between MLAA and MLEM.
For the segmented heart region in 5 patient reconstructions (22%) with myocardial 18F-FDG uptake, the average relative differences between MLRR and MLEM and between MLAA and MLEM were −7.0% ± 3.1% and −2.7% ± 3.3%, respectively (Fig. 5).
FIGURE 5.
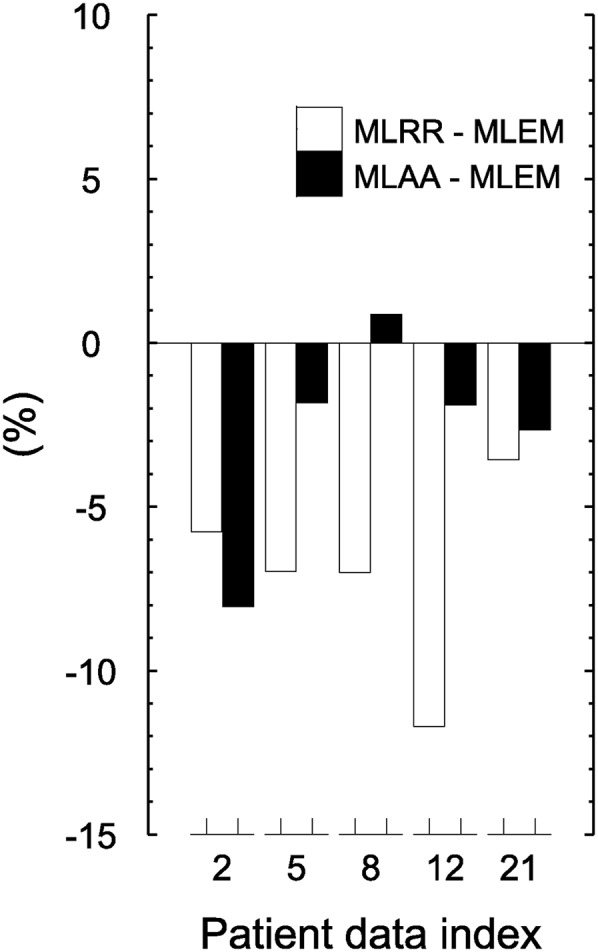
Mean differences in heart-region activity between MLRR and MLEM and between MLAA and MLEM.
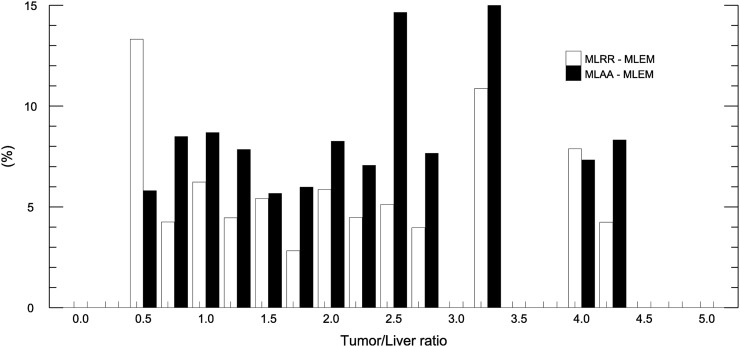
In total, 58 lesions with high local uptake were segmented, including tumors of various organs and inflammatory lesions. Only 15 (65%) of the 23 patient scans were used for this part of the study, because there were no such lesions in the other 8 scans. Also, a maximum of 5 lesions was selected for each patient. Whenever possible, lesions were selected from different organs and larger lesions were preferred to avoid problems related to partial volume effect. The average difference between MLRR and MLEM and between MLAA and MLEM was −5.3% ± 3.2% and −7.9% ± 5.4%, respectively. The quantification results for the tumors and inflammatory lesions are shown in Figure 6, and a histogram of the ratio of these high-activity lesions to liver activity can be found in the supplemental materials.
FIGURE 6.
Mean absolute differences in activity of segmented high-local-activity lesions between MLRR and MLEM and between MLAA and MLEM. Histogram of high-activity lesions classified on the basis of their tumor-to-liver ratios is provided in Supplemental Figure 2.
On the basis of their location, the segmented lesions were manually classified as being either more likely or less likely to be affected by motion. Lesions in the mediastinum, or within or near the lungs, were regarded as motion-affected lesion. Table 1 reports the results for these 2 classes of lesion, as well as the overall differences in all segmented regions.
TABLE 1.
Differences Between MLRR and MLEM and Between MLAA and MLEM for Tumors and Inflammatory Lesions with High Local Uptake
| Classification | MLRR – MLEM (%) | MLAA – MLEM (%) |
| All (n = 58) | −5.3 ± 3.2 | −7.9 ± 5.4 |
| Non–motion-affected (n = 35) | −4.4 ± 2.9 | −9.3 ± 6.0 |
| Motion-affected (n = 23) | −6.6 ± 3.3 | −5.7 ± 3.4 |
DISCUSSION
In this study, we tried to validate joint reconstruction of activity and attenuation using the MLRR and MLAA algorithms against the current clinical gold standard, activity reconstruction using MLEM. To ensure that the reconstructions would be compared at a similar convergence level, standard activity images were generated following the attenuation estimation of the joint-reconstruction methods. Although a slightly different noise structure was observed between the final MLAA activity reconstruction and the standard activity reconstruction, the difference was minimal in ROI-based quantifications. Therefore, in clinical practice this additional reconstruction would not be necessary. We found that in the case of a CT and PET mismatch, the attenuation values that were computed from the adjusted CT image could directly (and also possibly indirectly through the scatter shape) influence the quantification results.
In the bladder and lumbar vertebra results (regions not expected to be affected by motion), MLRR was quantitatively comparable to the gold standard. However, some discrepancies from the gold standard were observed for the MLAA activity distributions. Hence, MLAA was repeated with MLRR-based initialization to verify whether differences between MLAA and MLEM (or between MLAA and MLRR) could be due to convergence differences between the algorithms. We found that MLAA iterates away from the initial MLRR-based attenuation images and in all cases achieves a higher likelihood. We believe this issue to be fundamental because it shows that MLAA manages to find a solution better explaining the data (higher likelihood) that are outside the solution set available to MLEM and MLRR. We previously reported that when there are inconsistencies in data corrections, MLAA and MLEM converge to different solutions (27). Hence, the differences observed between the reconstruction methods hint at residual data inconsistencies that are making them converge to slightly different solutions.
MLRR and MLAA produced a very different attenuation correction near the dome of the liver, a finding that, based on visual analysis, was attributed to mismatches due to respiratory motion. When only the lower part of the liver was compared, agreement was, as expected, much better among all the algorithms, because attenuation of the lower part of the liver is much less affected by respiration. To quantify the indirect influence of the PET and CT mismatch through the estimated shape of the scatter as reported by Presotto et al. (23), we repeated all reconstructions with the MLRR-based scatter estimate. However, the effect on our comparative analysis was only marginal (data not shown).
The MLRR and MLAA results for the segmented heart region contrasted slightly with the other regions of interest. We believe this discrepancy can be explained in part by the inconsistencies in the emission data due to in-scan respiratory and cardiac motion (29). Although MLAA is free to assign and adjust the attenuation values of motion-affected regions, MLRR does not have this freedom and can manipulate only tissue boundaries. This consideration may also explain the higher differences in MLRR observed between the motion-affected and non–motion-affected inflammatory lesions of Table 1.
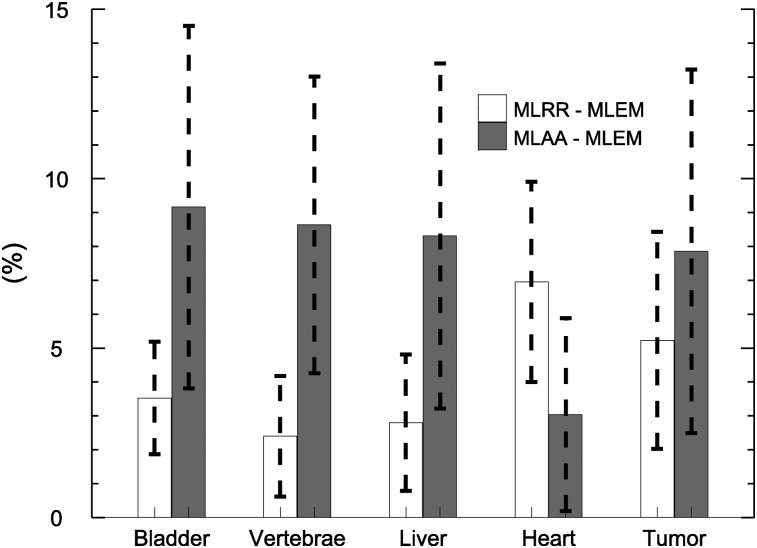
Our study focused on quantifying the similarities and differences between MLRR and the gold standard and between MLAA and the gold standard in the various regions of interest. Figure 7 shows the averages for these ROI-based differences. To avoid problems related to the scale in MLAA, the total activity of MLEM (in a reliable tissue region) was used to scale the MLAA activity reconstruction. In clinical practice, this step would not be possible if no CT image were available. Several methods have been proposed to determine the scale factor (10–18). The most practical way of obtaining quantitative MLAA reconstructions clinically would be a method that either limits the reconstructed attenuation values to predefined tissue attenuation values or encourages such a limitation (4). MLRR, however, does not have the scale problem. When the CT-based attenuation image is available, MLRR provides a better alternative to MLEM in regions expected to be affected by motion and is otherwise similar to MLEM. This is also somewhat reflected in Figure 7, which shows larger differences in the heart region, an area subject to between-scan and in-scan motion. Compared with MLRR, the differences between MLAA and MLEM were larger. We believe these differences were caused by data inconsistencies. These can be reduced by more accurately calibrating the scanner (crystal or geometric sensitivities, TOF resolutions or offsets), and in our ongoing work we have observed that doing so indeed reduces the differences between MLAA and MLEM activity reconstructions. Therefore, we postulate that the differences observed in our study were due mostly to residual inconsistencies caused by inaccuracies in the corrections applied during reconstruction.
FIGURE 7.
Mean differences in activity of all ROIs between MLRR and MLEM and between MLAA and MLEM.
CONCLUSION
To validate 2 methods (MLRR and MLAA) of joint activity reconstruction and attenuation reconstruction of TOF PET emission data, we quantitatively analyzed whole-body patient scans reconstructed using these methods and compared them with the current clinical gold standard (MLEM). We found that in the presence of patient motion—and provided that an accurate estimate of scatter was available—the tracer distribution was more accurately reflected by the joint reconstructions than by the gold standard. In regions not affected by motion, differences between MLRR and MLEM were small (typically <5%). Differences between MLAA and MLEM were larger, exceeding 10% in several cases. We believe that these differences were at least partly caused by data inconsistencies, and it is therefore not yet clear which of these joint-reconstruction methods is the more accurate one. The problem of obtaining an accurate scale for the joint reconstruction is eliminated in the case of MLRR when CT-based attenuation information is available.
DISCLOSURE
This work was supported in part by Research Foundation Flanders (FWO) project G.0275.14N, FWO postdoctoral project 12T7118N, and the Center for Advanced Imaging Innovation and Research, a National Institute for Biomedical Imaging and Bioengineering Biomedical Technology Resource Center (NIH P41 EB017183). No other potential conflict of interest relevant to this article was reported.
Supplementary Material
REFERENCES
- 1.Defrise M, Rezaei A, Nuyts J. Time-of-flight PET data determine the attenuation sinogram up to a constant. Phys Med Biol. 2012;57:885–899. [DOI] [PubMed] [Google Scholar]
- 2.Salomon A, Goedicke A, Schweizer B, Aach T, Schulz V. Simultaneous reconstruction of activity and attenuation for PET/MR. IEEE Trans Med Imaging. 2011;30:804–813. [DOI] [PubMed] [Google Scholar]
- 3.Rezaei A, Defrise M, Bal G, et al. Simultaneous reconstruction of activity and attenuation in time-of-flight PET. IEEE Trans Med Imaging. 2012;31:2224–2233. [DOI] [PubMed] [Google Scholar]
- 4.Mehranian A, Zaidi H. Joint estimation of activity and attenuation in whole-body TOF PET/MRI using constrained gaussian mixture models. IEEE Trans Med Imaging. 2015;34:1808–1821. [DOI] [PubMed] [Google Scholar]
- 5.Rezaei A, Defrise M, Nuyts J. ML-reconstruction for TOF-PET with simultaneous estimation of the attenuation factors. IEEE Trans Med Imaging. 2014;33:1563–1572. [DOI] [PubMed] [Google Scholar]
- 6. Li H, El Fakhri G, Li Q. Direct MAP estimation of attenuation sinogram using TOF PET data and anatomical information. In: 2013 Fully Three-Dimensional Image Reconstruction in Radiology and Nuclear Medicine: Proceedings. Fully3D website. http://www.fully3d.org/show-7-12-1.html. Accessed August 15, 2018.
- 7.Salvo K, Defrise M. sMLACF: a generalized expectation-maximization algorithm for TOF-PET to reconstruct the activity and attenuation simultaneously. Phys Med Biol. 2017;62:8283–8313. [DOI] [PubMed] [Google Scholar]
- 8.Rezaei A, Bickell M, Fulton R, Nuyts J. Joint activity and attenuation reconstruction of listmode TOF-PET data. In: 2015 IEEE Nuclear Science Symposium and Medical Imaging Conference (NSS/MIC). Piscataway, NJ: IEEE; 2015. [Google Scholar]
- 9.Herraiz JL, Sitek A. Sensitivity estimation in time-of-flight list-mode positron emission tomography. Med Phys. 2015;42:6690–6702. [DOI] [PMC free article] [PubMed] [Google Scholar]
- 10.Panin VY, Defrise M, Nuyts J, Rezaei A, Casey ME. Reconstruction of uniform sensitivity emission image with partially known axial attenuation information in PET-CT scanners. In: 2012 IEEE Nuclear Science Symposium and Medical Imaging Conference Record (NSS/MIC). Piscataway, NJ: IEEE; 2012:2166–2173. [Google Scholar]
- 11.Rezaei A, Michel C, Casey ME, Nuyts J. Simultaneous reconstruction of the activity image and registration of the CT image in TOF-PET. Phys Med Biol. 2016;61:1852–1874. [DOI] [PubMed] [Google Scholar]
- 12.Bousse A, Bertolli O, Atkinson D, et al. Maximum-likelihood joint image reconstruction/motion estimation in attenuation-corrected respiratory gated PET/CT using a single attenuation map. IEEE Trans Med Imaging. 2016;35:217–228. [DOI] [PubMed] [Google Scholar]
- 13.Cheng J-C, Salomon A, Yaqub M, Boellaard R. Investigation of practical initial attenuation image estimates in TOF-MLAA reconstruction for PET/MR. Med Phys. 2016;43:4163–4173. [DOI] [PubMed] [Google Scholar]
- 14.Ahn S, Cheng L, Shanbhag D, Wiesinger F, Manjeshwar R. Joint reconstruction of activity and attenuation using MR-based priors: application to clinical TOF PET/MR. In: 2015 IEEE Nuclear Science Symposium and Medical Imaging Conference (NSS/MIC). Piscataway, NJ: IEEE; 2015. [Google Scholar]
- 15.Panin VY, Aykac M, Casey ME. Simultaneous reconstruction of emission activity and attenuation coefficient distribution from TOF data, acquired with rotating external line source. In: 2011 IEEE Nuclear Science Symposium Conference Record. Piscataway, NJ: IEEE; 2011:4329–4336. [Google Scholar]
- 16.Mollet P, Keereman V, Clementel E, Vandenberghe S. Simultaneous MR-compatible emission and transmission imaging for PET using time-of-flight information. IEEE Trans Med Imaging. 2012;31:1734–1742. [DOI] [PubMed] [Google Scholar]
- 17.Rothfuss H, Panin V, Moor A, et al. LSO background radiation as a transmission source using time of flight. Phys Med Biol. 2014;59:5483–5500. [DOI] [PubMed] [Google Scholar]
- 18.Berker Y, Kiessling F, Schulz V. Scattered PET data for attenuation-map reconstruction in PET/MRI. Med Phys. 2014;41:102502. [DOI] [PubMed] [Google Scholar]
- 19.Hamill JJ, Panin VY. TOF-MLAA for attenuation correction in thoracic PET/CT. In: 2012 IEEE Nuclear Science Symposium and Medical Imaging Conference Record (NSS/MIC). Piscataway, NJ: IEEE; 2012:4040–4047. [Google Scholar]
- 20.Boellaard R, Hofman MBM, Hoekstra OS, Lammertsma AA. Accurate PET/MR quantification using time of flight MLAA image reconstruction. Mol Imaging Biol. 2014;16:469–477. [DOI] [PubMed] [Google Scholar]
- 21.Lougovski A, Schramm G, Maus J, Hofheinz F, van den Hoff J. Preliminary evaluation of the MLAA algorithm with the Philips Ingenuity PET/MR [abstract]. EJNMMI Phys. 2014;1(suppl 1):A33. [DOI] [PMC free article] [PubMed] [Google Scholar]
- 22.Mehranian A, Zaidi H. Clinical assessment of emission- and segmentation-based MR-guided attenuation correction in whole-body time-of-flight PET/MR imaging. J Nucl Med. 2015;56:877–883. [DOI] [PubMed] [Google Scholar]
- 23.Presotto L, Busnardo E, Perani D, Gianolli L, Gilardi MC, Bettinardi V. Simultaneous reconstruction of attenuation and activity in cardiac PET can remove CT misalignment artifacts. J Nucl Cardiol. 2016;23:1086–1097. [DOI] [PubMed] [Google Scholar]
- 24.Mehranian A, Arabi H, Zaidi H. Quantitative analysis of MRI-guided attenuation correction techniques in time-of-flight brain PET/MRI. Neuroimage. 2016;130:123–133. [DOI] [PubMed] [Google Scholar]
- 25.Bal H, Panin VY, Platsch G, et al. Evaluation of MLACF based calculated attenuation brain PET imaging for FDG patient studies. Phys Med Biol. 2017;62:2542–2558. [DOI] [PubMed] [Google Scholar]
- 26.Jakoby BW, Bercier Y, Conti M, Casey ME, Bendriem B, Townsend DW. Physical and clinical performance of the mCT time-of-flight PET/CT scanner. Phys Med Biol. 2011;56:2375–2389. [DOI] [PubMed] [Google Scholar]
- 27.Rezaei A, Salvo K, Vahle T, et al. Plane-dependent ML scatter scaling: 3D extension of the 2D simulated single scatter (SSS) estimate. Phys Med Biol. 2017;62:6515–6531. [DOI] [PMC free article] [PubMed] [Google Scholar]
- 28.Watson CC. Extension of single scatter simulation to scatter correction of time-of-flight PET. IEEE Trans Nucl Sci. 2007;54:1679–1686. [Google Scholar]
- 29. Rezaei A, Nuyts J, Defrise M. The effect of motion on joint estimates of activity and attenuation from time-of-flight PET data. In: 2013 Fully Three-Dimensional Image Reconstruction in Radiology and Nuclear Medicine: Proceedings. Fully3D website. http://www.fully3d.org/show-7-12-1.html. Accessed August 15, 2018.
- 30.Delso G, Nuyts J. PET/MRI: attenuation correction. In: Iagaru A, Hope T, Veit-Haibach P, eds. PET/MRI in Oncology. New York, NY: Springer; 2018:53–75. [Google Scholar]
Associated Data
This section collects any data citations, data availability statements, or supplementary materials included in this article.


