Abstract
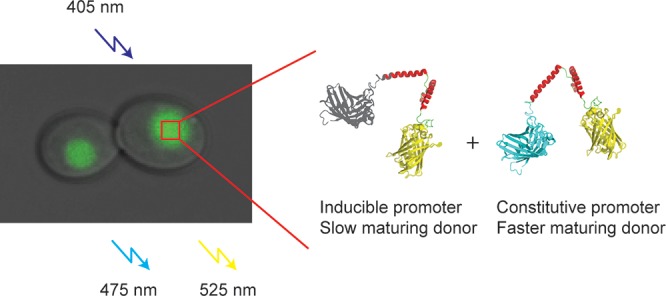
Förster resonance energy transfer (FRET)-based sensors are a valuable tool to quantify cell biology, yet it remains necessary to identify and prevent potential artifacts in order to exploit their full potential. We show here that artifacts arising from slow donor mCerulean3 maturation can be substantially diminished by constitutive expression in both prokaryotic and eukaryotic cells, which can also be achieved by incorporation of faster-maturing FRET donors. We developed an improved version of the donor mTurquoise2 that matures faster than the parent protein. Our analysis shows that using equal maturing fluorophores in FRET-based sensors or using constitutive low expression conditions helps to reduce maturation-induced artifacts, without the need of additional noise-inducing spectral corrections. In general, we show that monitoring and controlling the maturation of fluorescent proteins in living cells is important and should be addressed in in vivo applications of genetically encoded FRET sensors.
Keywords: macromolecular crowding, Förster resonance energy transfer, FRET sensors, fluorescent protein maturation, biosensors
Sensors based on FRET provide precise readout in space and time, and molecular engineering allows an impressive control over selectivity, sensitivity, and spatiotemporal localization of the probes. When these sensors contain fluorescent proteins as FRET donor and acceptor, they are expressed directly inside the living cell, allowing relatively unperturbed FRET measurements in real-time. Consequently, a large toolbox of FRET sensors is available, generating a plethora of insights in cell biology.1−3 The use of fluorescent proteins in FRET sensors is not without artifacts. Parameters such as pH,4 fluorescent protein maturation,5 fluorescent protein oligomerization,6 sensor proteolysis, and other physical chemical effects such as nonspecific analyte binding7 and macromolecular crowding8 can induce systematic errors and need to be taken into account. Although the premier method to test for inaccuracies would be a measurement based on another technology, this is not always possible. Instead, artifacts may be identified, for example, by the construction of sensors with a nonfunctional sensing domain. In cell calibration of the sensors, fluorescent protein engineering, or spectral corrections9,10 can, for example, resolve inaccuracies in the measurement.
Because an unequal number of donor and acceptor affect the FRET readout, fully mature fluorescent proteins would greatly improve accuracy. The synthesis of GFP-type fluorescent proteins goes through several stages of processing, including folding, cyclization, dehydration, and aerial oxidation.11,12 More complicated maturation kinetics can occur due to additional oxidations, cis–trans isomerization, or rearrangement of amino acids near the fluorophore. The in vivo maturation time of commonly used fluorescent proteins ranges widely from 5 min to >200 min in Escherichia coli and often depends on the cell type.13 The fluorescent protein maturation can vary with growth rate; doubling the growth rate of E. coli resulted in a 1.4 times longer maturation time, possibly due to a lower oxygen availability in the cell.14
Previously, we developed probes that sense macromolecular crowding inside living cells, containing mCerulean315 as a donor and mCitrine as an acceptor, and a flexible linker in between (crGE, Figure 1).16,17 The sensors detect changes in the excluded volume (or in general terms macromolecular crowding) after an osmotic upshift in both bacterial and mammalian cells by a change in FRET efficiency. When applying the sensors under different expression conditions, however, we measured increasing FRET ratios with increasing inducer concentration; the FRET signal is stable under constitutive expression. Here, we show that this dependence is caused by a difference in maturation of the fluorescent proteins. We find that the high FRET is caused by slow mCerulean3 maturation in combination with acceptor cross-excitation. We alleviate these issues by constitutive expression in both prokaryotic and eukaryotic cells and using faster-maturing donors such as mTurquoise218 and mTurquoise2.1.
Figure 1.
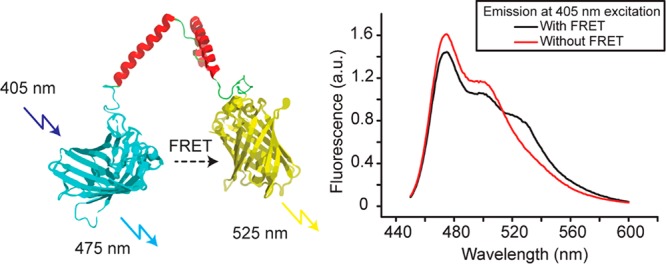
Structure of the FRET sensor with mCerulean3 as donor and mCitrine as acceptor, and a flexible linker connecting the two proteins. Upon excitation at 405 nm the sensor emits fluorescence with a maximum at 475 nm for mCerulean3, and a maximum at 525 nm for mCitrine due to FRET. The sensor gives rise to a FRET efficiency of ∼10%, which increases with macromolecular crowding. The spectra displayed are in 10 mM NaPi, pH 7.4, without macromolecular crowding. The spectrum without FRET is after linker cleavage with proteinase K.
Experimental Section
Plasmid Construction in E. coli
Plasmids bearing crGE, crGEs, and crcpGE in pRSET A were described previously.16,17 crGE containing silent mutations, to introduce additional restriction sites, was obtained from GeneArt and subcloned into pACYC in between SalI and BamHI sites. To remove an unintended ribosome-binding site in this construct, that induced high acceptor only expression, we use the QuickChange protocol to mutate M363G and V364G with forward primer GAGGTAGCGGTGGGTCCGGTGGGAGTAAAGGTGAGGAAC and reverse primer GTTCCTCACCTTTACTCCCACCGGACCCACCGCTACCTC. DNA encoding mTurquoise2 (PMK plasmid, GeneArt) was cloned with NsiI and BamHI into pRSET A, carrying the gene for the crGE probe. mTurquoise2.1 was obtained by QuickChange site-directed mutagenesis with forward primer GCCGGATAATCATTATCTGAGCATTCAGAGCAAACTGAGC and reverse primer GCTCAGTTTGCTCTGAATGCTCAGATAATGATTATCCGGC on mTurquoise2 in the PMK plasmid as template. PCR products were treated with Dpn1 for 1 h at 37 °C, transformed into E. coli MC1061, and cells were plated on LB agar plates. The T203I mutant was subcloned into pRSET A as above. To obtain cytoplasmic maltose-binding protein (cyMBP), we removed the signal sequence from the malE gene in the pACYC vector, using the USER cloning protocol, with forward primer ACCATGAAAAUCGAAGAAGGTAAACTGGTAATCTGG and reverse primer ATTTTCATGGUCGACCACCTCCTG.
Plasmid Construction for Saccharomyces cerevisiae
For GAL1-regulated expression of the crGE-NLS, the S. cerevisiae codon-optimized gene of the crGE sequence in pYES2 (GeneArt, Invitrogen) was amplified together with pGAL1 and CYC1 by PCR with the forward primer GGTGCCGTAAAGCAG and reverse primer ATCGGTCGACCCCAATACGCAAACCGC, introducing a SalI site downstream of the terminator. The sequence was subcloned into a pRS303 yeast integrative vector in between SpeI and SalI sites to achieve chromosomal integration in the HIS3 locus. All cloning steps were carried out in pYES2 template, and consecutively amplified using the above-mentioned primers to integrate the gene into pRS303. pTEF1 was amplified by PCR from pYM-N1819 with forward primer CGAGCTACTAGTCATAGCTTCAAAATGTTTCTACTCC, introducing a SpeI site upstream of the promoter, and reverse primer GTGCAGAAGCTTCTTAGATTAGATTGCTATGC, introducing a HindIII site downstream for integration in pYES2-pGAL1-crGE-NLS. The resulting construct was subcloned in pRS303 for chromosomal integration. All pRS303 crGE-NLS constructs were sequenced to confirm that no additional mutations originated because of the multiple PCR steps.
Yeast Strains and Growth Conditions
All yeast strains were constructed in the BY4741 genetic background (his3Δ1, leu2Δ0, met15Δ0, ura3Δ0).20 Yeast cells were grown at 30 °C, 200 rpm. For strains expressing the crGE-NLS sensor under the GAL1 promoter, the cells were pre-cultured in Synthetic Dropout medium without histidine (SD-his), 2% (w/v) glucose and grown overnight. On the next day the cells were diluted 100× in 10 mL of SD-his 2% raffinose and 0.1% glucose. After 7 h of incubation appropriate dilutions were made in SD-his 2% raffinose to obtain cultures in the exponential growth phase on the third day (OD600 = 0.4–0.8). The induction time was ∼2.5 h. For mixed medium conditions, the same pre-culturing steps were followed in SD-his 2% galactose and 0.2% glucose containing medium. Strains expressing the crGE-NLS sensor under the TEF1 promoter were pre-grown under the same scheme of dilutions, but in SD-his and 2% glucose for all steps.
Protein Expression and Purification
E. coli BL21(DE3) pLysS with the pRSET A vector containing the desired sensor was grown to OD600 = 0.6 in LB medium (10 g/L tryptone, 5 g/L yeast extract, 10 g/L NaCl), and induced with 1 mM isopropyl β-d-1-thiogalactopyranoside (IPTG) overnight at 25 °C. The cells were spun down at 3000g for 30 min, resuspended in buffer A (10 mM sodium phosphate (NaPi), 100 mM NaCl, 0.1 mM phenylmethylsulfonyl fluoride (PMSF), pH 7.4), and lysed in a TissueLyser LT (QIAGEN). The lysate was cleared by centrifugation (5 min, 10000g), and the supernatant was supplemented with 10 mM imidazole. Subsequently, the proteins were purified by nickel–nitrilotriacetic acid Sepharose (NTA-Sepharose) chromatography (wash/elution buffer: 20/250 mM imidazole, 50 mM NaPi, 300 mM NaCl, pH 7.4). The constructs were further purified by Superdex 200 10/300GL size-exclusion chromatography (Amersham Biosciences) in 10 mM NaPi 100 mM NaCl, pH 7.4. The expression and purification were analyzed by 12% SDS-PAGE, and the bands were visualized by in-gel fluorescence and subsequent Coomassie staining. Fractions containing pure protein were aliquoted and stored at −80 °C.
To obtain mCerulean3 and mCitrine separately, the crGE sensor, bound to NTA-Sepharose, was treated on-column with proteinase K (Sigma) for 5 min. The mixture was first washed with 20 mM imidazole, 50 mM NaPi, 300 mM NaCl, pH 7.4, to collect mCitrine, and then washed with 250 mM imidazole, 50 mM NaPi, 300 mM NaCl, pH 7.4, to collect mCerulean3. The fractions containing a single fluorescent protein were further purified by size-exclusion chromatography and analyzed as above.
Maturation Measurements with Chloramphenicol
E. coli BL21(DE3) strain, without pLysS, with pRSET A containing the gene encoding the corresponding probe, was inoculated in 10 mL of filter-sterilized MOPS minimal medium21 containing 20 mM glucose at 30 °C. The culture was grown to OD600 = 0.1–0.2, and treated with 200 μg/mL chloramphenicol to stop protein synthesis. The fluorescence emission spectra (λEx = 405 nm for CFPs, and λEx = 515 for YFPs) were recorded every 30 min after the addition of chloramphenicol, and the spectra were corrected for OD600. The spectra were corrected for background fluorescence by subtraction of spectra of the same strain without plasmid but treated in the same manner. The data were fitted to a single exponential to determine the maturation characteristics.
Confocal Fluorescence Microscopy (Imaging of E. coli)
Ratiometric FRET measurements of E. coli by scanning confocal fluorescence microscopy were carried out as reported previously.16 Briefly, the culture was grown in MOPS minimal medium containing 20 mM glucose to OD600 = 0.1–0.2. In parallel, the same E. coli strain with the pRSET A plasmid containing monomeric streptavidin served as background. For both cultures, the proteins were constitutively expressed, i.e., in the absence of inducer. The cells were combined in a 1:1 ratio and washed by centrifugation and resuspension in MOPS minimal medium with the desired amount of NaCl, but without potassium phosphate and glucose to minimize adaptation of the cells to the osmotic stress imposed by the addition of NaCl. Next, 10 μL of this mixture was added to a coverslip modified with (3-aminopropyl)triethoxysilane (Aldrich).17 The coverslip was placed on a 40× water immersion objective lens on a laser-scanning confocal microscope (Zeiss LSM 710). For imaging, we used a 405 nm diode laser for excitation and the emission was split into the 450–505 nm and 505–797 nm channels. For following IPTG overexpression, cells were grown overnight at 30 °C, and when achieving an OD600 of 0.05, they were incubated for 1 h with shaking at 20 °C. After 1 h, 1 mM IPTG was added, and the cultured were measured every hour thereafter.
To quantify bleed through and cross excitation, a droplet (20 μL, 10 mM NaPi, 2 mg/mL BSA, 100 mM NaCl, pH 7.4.) containing either purified crGE, mCerulean3, or mCitrine was placed on the coverslip, and the fluorophores were excited at 405 nm and the emission was split into the 405–505 nm and 505–797 nm channels. The fluorescent proteins were then excited at 488 nm, and the emission was collected between 505 and 797 nm.
To determine ratiometric FRET during IPTG overexpression in confocal microscopy, the measurements were carried out as above, with the exception that after growth at 30 °C to OD600 = 0.1, cells were left growing at 20 °C for 1 h to allow cells to adapt to the lower temperature, prior to addition of 1 mM IPTG. Samples were measured from the liquid culture shaking at 20 °C every hour.
Wide-Field Fluorescence Microscopy: Imaging of S. cerevisiae
All in vivo experiments were performed at 30 °C. Images were acquired using a DeltaVision Elite imaging system (Applied Precision (GE), Issaquah, WA, USA) composed of an inverted microscope (IX-71; Olympus) equipped with a UPlanSApo 100× (1.4 NA) oil immersion objective, InsightSSI solid-state illumination, excitation and emission filters for CFP and YFP, ultimate focus, and a PCO sCMOS camera. Excitation and emission wavelengths for CFP were 438/24 (middle wavelength/bandpass) and 475/24 nm, and for YFP 513/17 and 543/22 nm. Stacks of 30 images with 0.2 μm spacing were taken at an exposure time of 25 ms. The images were taken for the CFP, YFP, and FRET channels. For the FRET channel the excitation wavelength was 438/24 nm (CFP channel), and the emission was measured at 543/22 nm (YFP channel).
Processing of all images was performed using Fiji (ImageJ, National Institutes of Health). For each image, the z-stack with the highest fluorescence intensity was selected. For each channel, the background was measured from a region outside the cell and subtracted before the FRET/CFP and YFP/CFP ratios were derived.
To quantify FRET/CFP and YFP/CFP ratios of the purified sensor, a droplet (20 μL, 10 mM NaPi, 0.1 mg/mL BSA, 100 mM NaCl, pH 7.4) containing 16 ng/mL crGE was imaged at 20°C with 30 z-stacks of 1 μm spacing. In parallel, buffer without protein content was imaged to determine the background. The obtained values were subtracted from the sensor measurements before FRET/CFP and YFP/CFP ratios were derived.
Results
Slow Donor Maturation Gives Artificially High FRET Ratios with Expression from an Inducible Promoter
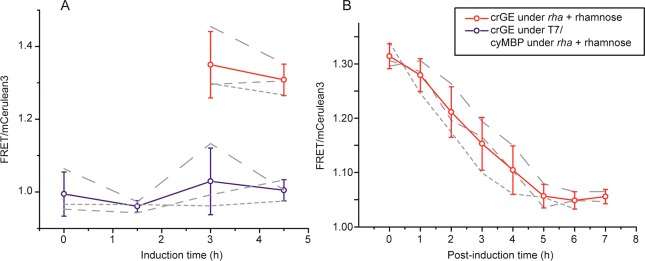
To quantify macromolecular crowding with the crGE sensor in E. coli, we previously expressed the crowding sensor with a constitutive promoter, that is, uninduced (“leaky”) expression from the T7 promoter in the pRSET A plasmid, and observed consistently FRET/donor ratios of 1.05 ± 0.04.16 However, addition of 1 mM IPTG leads to a ratio of ∼1.15 after 0.5 h, while fluorescent inclusion bodies start to appear at the poles after ∼1 h due to overexpression of the sensor. To obtain more control over the expression levels, we placed the sensor in the pACYC plasmid under a rhamnose promoter (rha), which provides tight control over expression and results in lower sensor concentrations. Surprisingly, we observe that also under these conditions the FRET ratios are higher than constitutive expression, and they resulted in a ratio of ∼1.3 after overnight expression. Further, subsequent removal of the inducer, rhamnose, after the overnight expression, reduced the ratios from ∼1.3 after induction to ∼1.05 upon a ∼4-h post-induction period. This ratio is the same as under constitutive expression, indicating that the high apparent FRET ratios are related to the inducible expression.
To verify that protein synthesis from an inducible promoter does not increase the macromolecular crowding, we expressed a nonfluorescent protein (maltose-binding protein, cyMBP) in the cytoplasm of E. coli (Figure 2). We simultaneously monitored crowding with the crGE sensor under constitutive expression. The FRET ratios are ∼1.05 and independent of cyMBP expression, suggesting that the high FRET ratios are an artifact of the sensor. Expression from an inducible promoter did not cause sensor truncation, because this would retain the high FRET ratios in a post-induction experiment. Increased intermolecular FRET would be an alternative mechanism that could explain sensitivity to the expression conditions; in this case, we would expect a relation between the intensity and the FRET observed. We do not see this relation when comparing cells with different amounts of the sensor from the same promoter, and neither when comparing the fluorescence obtained from the rha promoter with the constitutive T7 promoter.
Figure 2.
Expression of crGE from an inducible promoter increases the FRET signal independent of the crowding of E. coli. (A) Red circles: crGE sensor under the rha promoter after induction with 0.2% rhamnose. The cells became sufficiently fluorescent after 3 h to determine the FRET/mCerulean3 ratio. Blue circles: cells containing two plasmids, one to express cytoplasmic maltose-binding protein (cyMBP) from the rha promoter (induced at t = 0) and the other to express crGE from the T7 promoter, which gives constitutive (leaky) expression. (B) A post-induction period after overnight expression decreases FRET/CFP levels back to those under constitutive expression. The crGE sensor was expressed from the rha promoter in the presence of 0.1% (w/v) rhamnose in Mops medium supplemented with 20 mM glucose; the induction was halted at t = 0 by removal of rhamnose. Three biological replicates were tested for each condition. Error bars are the standard deviation over the biological replicates (gray dashed lines). Individual measurements across about 100 E. coli cells yielded a standard deviation of 0.05 and a standard error of the mean of <0.01.
In a separate experiment, we obtained higher apparent FRET ratios with an additional ribosome-binding site (RBS) in the linker region, yielding high amounts of mCitrine compared to mCerulean3 due to translation initiation in the middle of the sensor gene, at −10 bases from mCitrine. Subsequent removal of the RBS led to intact sensor with FRET ratios as before. The observation that a higher concentration of mCitrine leads to higher apparent FRET ratios leads us to hypothesize that the high ratios from an inducible promoter could be caused by a very slow maturing mCerulean3, hence a relatively high acceptor concentration.
To confirm that the mCerulean3 indeed matures more slowly, we quantified its maturation in vivo. We added chloramphenicol to a culture of cells that expressed the crowding sensor under a constitutive promoter (T7, Figure 3) and measured samples at regular time intervals by fluorometry. Arresting protein synthesis results in an increase in fluorescence due to maturation of the remaining immature fluorescent protein. The percentage increase would be higher with slow maturing fluorescent proteins. We find that in the first 30 min the fluorescence increase of mCitrine (10–20% (n = 3)) is less than that of mCerulean3 (30–40% (n = 3)), and mCitrine reaches maximum maturation after 30 min while it takes ∼100 min for mCerulean3, and mCitrine/mCerulean3 ratios only stabilize after ∼100 min, which is consistent with a recent study.13 After longer incubation times with chloramphenicol we observed a slow decrease in fluorescence, possibly caused by degradation or changes in the fluorophore. Altogether, we conclude that mCerulean3 matures slowly and is the likely cause of the higher FRET/CFP ratios when an inducible promoter is used.
Figure 3.
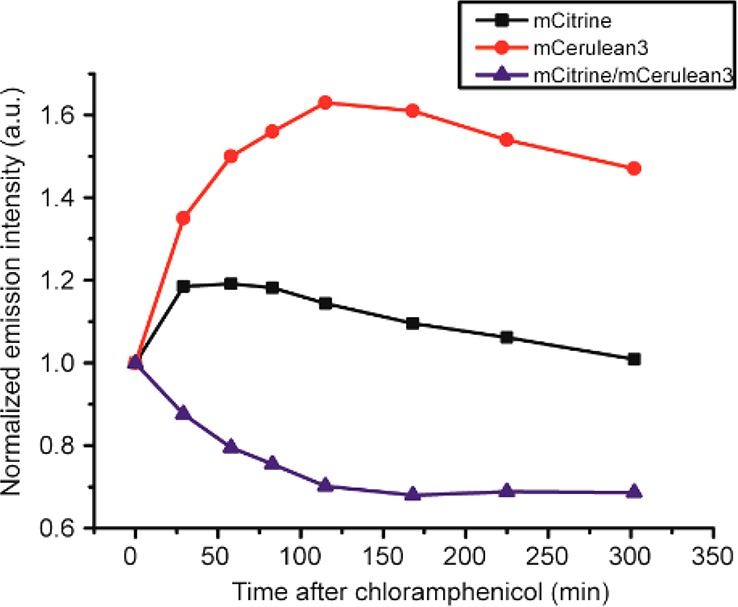
Determination of maturation of the fluorescent proteins in crGE by chloramphenicol addition, showing that mCerulean3 matures much slower than mCitrine. The mCitrine/mCerulean3 decreases because of slower maturation of mCerulean3. The sensor was constitutively expressed from the T7 promoter in pRSET A in E. coli BL21(DE3) pLysS grown in MOPS-minimal medium at 30 °C, and chloramphenicol (200 μg/mL) was added at t = 0 at OD600 ≈ 0.1. The increase in fluorescence of both donor and acceptor from maturation of immature protein was determined by fluorometry. The data were normalized to t = 0. Representative data are displayed; biological replicates are shown in Figure S2.
Expression Conditions Affect Fluorescent Protein Maturation in Yeast
To assess whether the dependence on the expression method is not exclusive to E. coli, we assessed the sensor performance in S. cerevisiae. The sensor was directed to the nucleus of S. cerevisiae by fusing a nuclear localization signal at the C-terminus, and the gene was integrated into the genome to remove expression heterogeneity caused by variation in plasmid copy number. We compared the expression from the galactose-inducible GAL1 promoter and a constitutive TEF1 promoter. In all cases, we observe localization of the sensor in the nucleus of S. cerevisiae. As in E. coli, we find that expression from an inducible promoter provides higher FRET/mCerulean3 ratios compared to constitutive expression (Figure 4). This increase in FRET/mCerulean3 follows the maturation of mCerulean3: When comparing the fluorescence of the mCerulean3 and mCitrine, each excited separately, we find that expression under an inducible promoter gives higher mCitrine/mCerulean3 ratios (mCitrine/mCerulean3 = 1.2 ± 0.13) than constitutive expression (mCitrine/mCerulean3 0.77 ± 0.08). The mCitrine/mCerulean3 under constitutive expression is closer to that of the isolated sensor in buffer, which is 0.56, indicating that under constitutive conditions the maturation is maximized.
Figure 4.
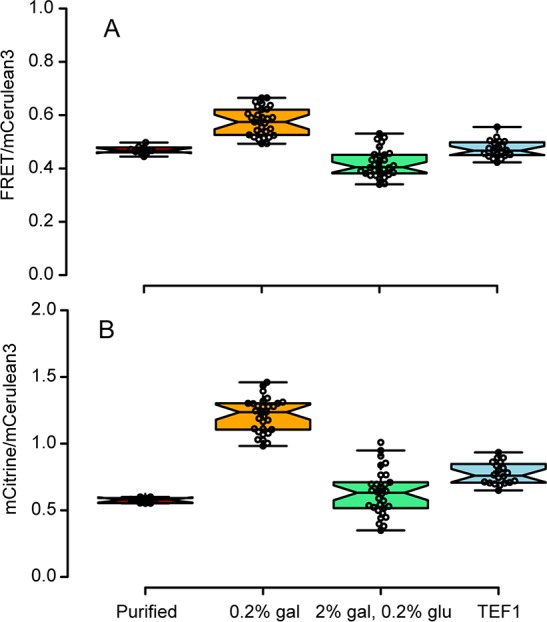
Maturation in S. cerevisiae depends on the expression method and affects FRET, as determined by wide-field fluorescence microscopy. The FRET values are lower than in, e.g., in Figure 2, because those were measured on a confocal microscope. (A) Comparison of the FRET/mCerulean3 ratios of the different expression conditions from data presented in Figure S3. (B) mCitrine/mCerulean3 ratios show that maturation affects the accuracy of the crowding read-out.
To reduce the expression from the GAL1 promoter, we added 0.2% glucose.22 Indeed, by addition of a repressor, the sensors appeared to age sufficiently to provide the FRET/mCerulean3 and mCitrine/mCerulean3 ratios as under constitutive expression. The combination of an inducer and repressor creates a somewhat larger variation between the cells.
We conclude that donor maturation and the FRET ratios can be tuned by varying the expression conditions, where constitutive expression allows reliable FRET measurements in both yeast and bacteria, and we speculate this may be true for other cell types as well.
Replacement with Faster-Maturing Donors Relieves Expression Sensitivity
Next, we reduced the expression dependence by increasing the maturation rate of the FRET donor. The FRET probe senses crowding by a polymer-type compression in crowded environments, due to its flexible linker with freely rotating fluorescent proteins,17,23 and the sensor is therefore independent of the identity of the fluorescent protein. Indeed, we made several constructs with varying donors and acceptors, and found that they were all compressed by the presence of Ficoll 70 (Figure S4). Crowding also compresses sensors with the combinations EGFP-mCherry,24 and Clover-mRuby2,25 as well as polymers equipped with synthetic dyes.26 All sensors based on CFP-YFP function in E. coli: osmotic upshift increases the FRET ratios, and calibration provides crowding values in percentages of Ficoll equivalents (Figure S4). The mTurquoise2-mCitrine combination (crTC2) provides lower FRET ratios than crGE in cells, but calibration with purified protein provides the same weight percentage of Ficoll equivalents. Hence, the nature of the fluorescent protein does not play a role in the crowding sensor, that is, under constitutive expression.
We replaced the mCerulean3 with mTurquoise2, because it is the brightest cyan fluorescent protein to date.18 We mutated a single amino acid in mTurquoise2, in an attempt to increase its maturation rate. Because the reaction with oxygen is a rate-determining step (although folding contributes as well),27 we reasoned that if we could force the desired conformation onto the tyrosine side chain to undergo the reaction with oxygen, generating the planar alkene of the fluorophore, we would accelerate maturation. Residue 203 can interact with the tyrosine phenol,28,29 and we mutated the threonine 203 to an isoleucine, which is nonpolar and would lead to a net increase in attraction with the nonpolar aromatic ring, and thus perhaps assist in the maturation reaction by directing the tyrosine. When the sensors were expressed in E. coli, we found that the T203I mutation provides a sensor (crTC2.1) with brightness similar to that of the parent fluorophore; both in E. coli and as isolated sensors, all three CFPs provided similar mCitrine/CFP ratios. The isolated crTC2.1 showed excitation and emission characteristics similar to those of the other two sensors (Figures S5 and S6), albeit with a small red-shift of 6 nm in both the excitation and emission maxima, likely caused by the altered polarizability of the fluorophore environment, which was previously seen for other 203 mutations in GFP.28,29 All constructs display similar FRET efficiencies of ∼10% as determined by linker cleavage (Figure S7). The small red shift does not increase the overlap between donor emission and acceptor absorption sufficiently to provide a measurable FRET efficiency increase. When we compare the relative brightness of the cleaved CFPs with respect to direct excitation of mCitrine, we find a mCitrine/CFP ratio of ∼0.9 for crTC, ∼1.1 for crGE, and ∼1.5 for crTC2.1. We name the new fluorescent protein mTurquoise2.1.
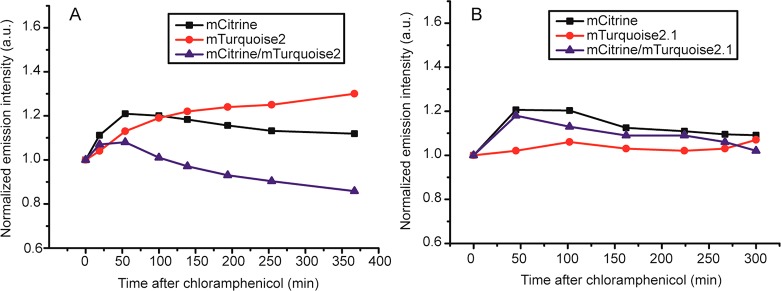
We measured the maturation efficiency of crTC2 and crTC2.1 in the same manner as before for crGE (Figure 5). The maturation of the mCitrine was not affected by the donor identity, while the maturation of mTurquoise2 was faster than mCerulean3: mTurquoise2 matures an additional 20% after treatment of the cells with chloramphenicol, which is equal to mCitrine, while mCerulean3 matures an additional 40%. The fluorescence of mTurquoise2 increases somewhat after ∼100 min, possibly due to more complicated maturation kinetics, as postulated before.13 It was recently reported that mTurquoise2 matures indeed faster than mCerulean3,13 in line with our findings here. When performing the same experiment with crTC2.1, we did not observe a measurable increase in fluorescence for the mTurquoise2.1, while mCitrine displayed a similar increase as before. Hence, the mTurquoise2.1 has reached maximal maturity under constitutive expression, indicative of a very fast maturation.
Figure 5.
Chloramphenicol inhibition of (A) crTC2 and (B) crTC2.1 expression, showing that replacement of mCerulean3 by mTurquoise2 or mTurquoise2.1 leads to more equal maturation rates between donor and acceptor. The sensors were constitutively expressed from the T7 promoter in pRSET A in E. coli BL21(DE3) pLysS grown in MOPS minimal medium at 30 °C, and chloramphenicol (200 μg/mL) was added at t = 0 at OD600 ≈ 0.1. The increase in fluorescence of both donor and acceptor from maturation of immature protein was determined by fluorometry. The data were normalized to t = 0. Representative curves are shown; biological replicates are shown in Figure S2.
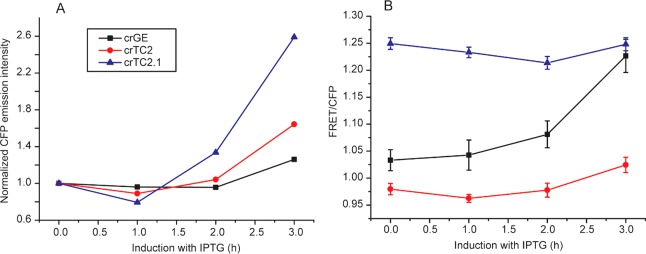
Next, we verified whether the faster donor maturation would improve the robustness of the sensors by relieving the dependence on the inducer conditions. We added 1 mM IPTG to the sensors controlled by the T7 system in pRSET A. In these experiments, we lowered the expression temperature to 20 °C, to prevent inclusion body formation at high sensor concentrations. We observed that the relative increase in fluorescence emission intensity of the cyan fluorescent proteins upon addition of IPTG followed the order of maturation mCerulean3 < mTurquoise2 < mTurquoise2.1 (Figure 6A), as shown by fluorescence spectroscopy (Figure S8). Also the FRET efficiencies upon IPTG induction reflect the donor maturation rates: the mCerulean3-containing sensor is highly dependent on the induction of the promoter, while the mTurquoise2-based sensor only shows a marginal increase. The fastest-maturing donor, mTurquoise2.1, shows a small decrease. This decrease may tentatively be explained by a dependence on acceptor maturation, that now matures more slowly. Hence, both the mTurquoise2 and the mTurquoise2.1 alleviate most of the dependence on the expression conditions.
Figure 6.
Induction of sensors with IPTG affects sensors with mCerulean3, but less so with mTurquoise2 and mTurquoise2.1, as measured by fluorescence confocal microscopy. (A) Median emission intensities of the cyan fluorescent proteins excited at 405 nm and monitored between 450 and 505 nm; the data are normalized for comparison. The actual intensities for crTC2 and crTC2.1 are ∼10× higher than for crGE. (B) Comparison of the FRET/CFP (780–505/450–505 nm, excited at 405 nm) ratio over time, showing a strong increase for crGE, a small increase for crTC2, and a small decrease for crTC2.1. Error bars show error in the linear fits of FRET versus CFP from over 100 cells.
A Model That Captures Donor Maturation Dependence
To better understand the dependence on donor maturation, we constructed a model that predicts the FRET/mCerulean3 ratio, taking into account incomplete donor or acceptor maturation. We use eq 1 to quantify the effect of maturation on the FRET ratio, which is derived in the Supporting Information.
| 1 |
In eq 1, macceptor and mdonor are the percentage matured acceptor and donor, respectively. The equation takes into account donor bleed-through in the acceptor channel, which is determined with purified mCerulean3, the FRET efficiency, which was determined previously in living E. coli cells, and the acceptor cross-excitation, determined with purified mCitrine. The maximum maturity that a purified sensor will reach is ∼80%.30 Therefore, the maturation is scaled to this maximum; the model is calibrated with purified sensor. The model allows facile assessment of the dependence of the ratiometric FRET of the crGE at a given FRET efficiency on the maturation efficiency of the donor and acceptor (Figure 7).
Figure 7.
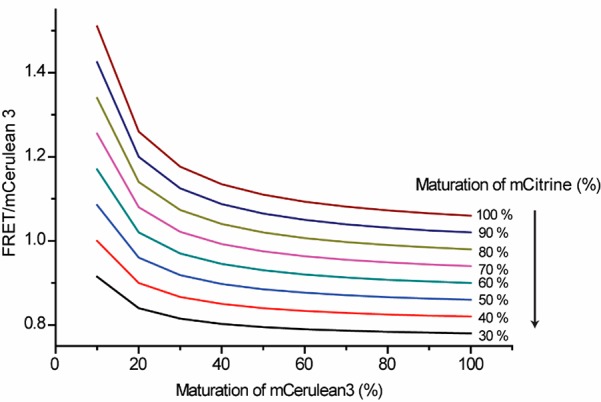
Effect of maturation of fluorescent proteins on FRET sensor read-out at 12 ± 2% FRET efficiency as obtained from eq 1.
This analysis suggests that a steep dependence of the ratiometric FRET on the maturation of mCerulean3 occurs at maturation levels lower than ∼30%. Under constitutive expression, ∼60% of the maximum maturation is reached (as determined after chloramphenicol inhibition of protein synthesis), and little effect of the maturation of the donor on the FRET ratio is expected. Indeed, if acceptor cross-excitation would not occur, probes with immature donors would not be detected, reducing the dependence on donor maturation. Acceptor cross excitation only becomes significant with a large excess of acceptor; this could in principle occur with expression from an inducible promoter and an acceptor that matures faster than the donor, as in the case of mCerulean3. The faster-maturing fluorophores mTurquoise2 and mTurquoise2.1 would not reach such low levels of maturation under these conditions. In contrast to the donor maturation, the FRET ratio linearly dependent on the maturation of the acceptor; the higher the maturation, the higher the FRET ratio. Obviously, FRET would not occur in sensors without an acceptor, reducing the overall FRET efficiency. Hence, this analysis shows that a model that includes acceptor cross excitation can at least partially account for the FRET sensitivity with overexpression.
Discussion
Macromolecular crowding is an important parameter governing the biochemical organization inside living cells. Quantification of macromolecular crowding, actually the excluded volume of a cell, with FRET probes provides information on cell physiology that cannot be obtained with other methods. Therefore, it is essential that the readouts are reliable. We find that FRET ratios obtained with slow maturing donors suffer from sensitivity to expression conditions. We can alleviate this dependence by creating relatively constant sensor concentrations by constitutive expression, which provides the time for the fluorescent proteins to mature sufficiently. Alternatively, or additionally, sensor readouts become more robust when the faster-maturing donors mTurquoise2 and mTurquoise2.1 are used to avoid problems with cross-excitation.
It is not surprising that fluorescent protein maturation influences FRET, and it has been stated previously on various occasions that fast-maturing proteins are required, with an acceptor that matures faster than the donor.1,30 This scenario is favored because donor excitation in the absence of an acceptor abolishes FRET, while the absence of a donor renders the sensor invisible, besides cross excitation of the acceptor. Yet, to our knowledge a detailed assessment of this effect on FRET has not been reported to date, and the connection to the expression conditions has not been made. Our findings support previous statements, and importantly, we provide insight into the extent to which these statements hold and how artifacts can be minimized.
Besides the use of faster-maturing fluorescent proteins and constitutive expression, additional spectral corrections would allow to account for incomplete maturation by extracting the real FRET in the presence of unequal number of acceptor and donor.9,10,31 These procedures require additional knowledge on for example the bleed through, cross excitation, or extinction coefficients, which can be obtained by measuring the individual fluorophores. Linear unmixing of FRET with tandem constructs such as the crowding sensors requires calibration with cells expressing either donor or acceptor, and additional information on various spectral parameters from in vivo measurements.10 We find that measuring FRET in small compartments such as the E. coli cytoplasm and subsequent spectral corrections is challenging due to the introduction of significant noise, which originates from separate excitations using multiple lasers and filters on small (femtoliter) cell volumes. We find that if the fluorescent proteins are well folded and have matured, as proposed by our methodology, such spectral corrections are not required anymore.
Donor maturation plays less of a role in donor-only FRET measurements. Especially donor lifetime measurements would allow extraction of only those sensors with intact donor and acceptor, albeit with a decreased time resolution compared to sensitized emission and a more complicated analysis procedure. Acceptor photobleaching is also not sensitive to donor maturation but is dependent on acceptor maturation. Additionally, acceptor photobleaching has a lower resolution in time and/or space. Because ratiometric FRET measurements are straightforward to perform and provide high spatiotemporal resolution, we chose to develop probes and protocols for determination of changes in excluded volume with this method rather than donor-only measurements.
Although we find very slow maturation for the FRET donor in crGE, this does not compromise the macromolecular crowding sensing ability of the sensors under previously published conditions, which was under constitutive expression. However, for future measurements to quantify crowding, we strongly recommend to use either the crTC2 or crTC2.1 probes, especially when employing an inducible promoter. Determining protein maturation is recommended for new growth conditions, combined with fast-maturing proteins, constitutive expression conditions, and spectral corrections of FRET when measuring larger volumes. These findings also apply to other FRET sensors, especially where slower maturing fluorescent proteins are used: Widely used orange/red fluorescent proteins as acceptors mature generally slower than the green/yellow donors,13 and the influence of immature acceptors weighs in more heavily (Figure 6). Maturation times of fluorescent proteins vary significantly between 7 and 500 min,13 and small mutations in the fluorescent proteins or growth conditions could have a significant contribution to the maturation. The discovery and further testing of the new donor mTurquoise2.1 will certainly aid in the development of more robust FRET sensors, in combination with new generations of fast-maturing acceptors such as Gamillus32 and Clover.33
Conclusion
FRET measurements require control over protein maturation in order to increase the robustness of fluorescence-based sensors. We show that artifacts arising from slow fluorescent protein maturation can be substantially diminished by constitutive expression in both prokaryotic and eukaryotic cells, which can also be achieved by incorporation of faster-maturing donors. We therefore developed an improved version of mTurquoise2 that matures faster but has a similar brightness compared to the parent fluorophore. These findings provide insight into how insufficient maturation plays a role in FRET and the necessity to control for these artifacts when employing FRET sensors in living cells.
Acknowledgments
This work was supported by the China Scholarship Council grant to B.L., The Netherlands Organization for Scientific Research program grant TOP-PUNT (project number 13.006) and an ERC Advanced Grant (ABCVolume) to B.P., and The Netherlands Organization for Scientific Research Vidi grant (723.015.002) to A.J.B.
Supporting Information Available
The Supporting Information is available free of charge on the ACS Publications website at DOI: 10.1021/acssensors.8b00473.
Derivation of eq 1, statistics of maturation determination by chloramphenicol treatment of the fluorescent proteins, fluorescence emission of crGE in yeast, sensor characterization in buffer, excitation and emission spectra of the FRET probes, FRET efficiency determination, fluorescence during sensor overexpression by fluorescence spectrometry, and emission characteristics of purified fluorophores analyzed by confocal microscopy (PDF)
Author Contributions
† B.L. and S.N.M. are co-first authors.
Author Contributions
B.L. performed and analyzed E. coli experiments and made the model. S.N.M. performed and analyzed yeast experiments. J.v.d.B. performed and analyzed initial maturation experiments. S.K.K. performed maturation experiments and developed TC2.1. L.M. performed DNA cloning and expression experiments. L.M.V. analyzed and supervised yeast experiments. B.P. and A.J.B. analyzed and supervised the research. All authors designed the research and all contributed to writing of the paper.
The authors declare no competing financial interest.
Supplementary Material
References
- Bajar B. T.; Wang E. S.; Zhang S.; Lin M. Z.; Chu J. A Guide to Fluorescent Protein FRET Pairs. Sensors 2016, 16, 1488. 10.3390/s16091488. [DOI] [PMC free article] [PubMed] [Google Scholar]
- Lindenburg L.; Merkx M. Engineering genetically encoded FRET sensors. Sensors 2014, 14, 11691–11713. 10.3390/s140711691. [DOI] [PMC free article] [PubMed] [Google Scholar]
- Hochreiter B.; Garcia A. P.; Schmid J. A. Fluorescent proteins as genetically encoded FRET biosensors in life sciences. Sensors 2015, 15, 26281–26314. 10.3390/s151026281. [DOI] [PMC free article] [PubMed] [Google Scholar]
- Betolngar D. B.; Erard M.; Pasquier H.; Bousmah Y.; Diop-Sy A.; Guiot E.; Vincent P.; Merola F. pH sensitivity of FRET reporters based on cyan and yellow fluorescent proteins. Anal. Bioanal. Chem. 2015, 407, 4183–4193. 10.1007/s00216-015-8636-z. [DOI] [PubMed] [Google Scholar]
- Scott B. L.; Hoppe A. D. Optimizing fluorescent protein trios for 3-Way FRET imaging of protein interactions in living cells. Sci. Rep. 2015, 5, 10270. 10.1038/srep10270. [DOI] [PMC free article] [PubMed] [Google Scholar]
- Cranfill P. J.; Sell B. R.; Baird M. A.; Allen J. R.; Lavagnino Z.; de Gruiter H. M.; Kremers G. J.; Davidson M. W.; Ustione A.; Piston D. W. Quantitative assessment of fluorescent proteins. Nat. Methods 2016, 13, 557–562. 10.1038/nmeth.3891. [DOI] [PMC free article] [PubMed] [Google Scholar]
- Moussa R.; Baierl A.; Steffen V.; Kubitzki T.; Wiechert W.; Pohl M. An evaluation of genetically encoded FRET-based biosensors for quantitative metabolite analyses in vivo. J. Biotechnol. 2014, 191, 250–259. 10.1016/j.jbiotec.2014.07.007. [DOI] [PubMed] [Google Scholar]
- Groen J.; Foschepoth D.; te Brinke E.; Boersma A. J.; Imamura H.; Rivas G.; Heus H. A.; Huck W. T. Associative Interactions in Crowded Solutions of Biopolymers Counteract Depletion Effects. J. Am. Chem. Soc. 2015, 137, 13041–13048. 10.1021/jacs.5b07898. [DOI] [PubMed] [Google Scholar]
- Xia Z.; Liu Y. Reliable and global measurement of fluorescence resonance energy transfer using fluorescence microscopes. Biophys. J. 2001, 81, 2395–2402. 10.1016/S0006-3495(01)75886-9. [DOI] [PMC free article] [PubMed] [Google Scholar]
- Wlodarczyk J.; Woehler A.; Kobe F.; Ponimaskin E.; Zeug A.; Neher E. Analysis of FRET Signals in the Presence of Free Donors and Acceptors. Biophys. J. 2008, 94, 986–1000. 10.1529/biophysj.107.111773. [DOI] [PMC free article] [PubMed] [Google Scholar]
- Tsien R. Y. The green fluorescent protein. Annu. Rev. Biochem. 1998, 67, 509–544. 10.1146/annurev.biochem.67.1.509. [DOI] [PubMed] [Google Scholar]
- Remington S. J. Fluorescent proteins: maturation, photochemistry and photophysics. Curr. Opin. Struct. Biol. 2006, 16, 714–721. 10.1016/j.sbi.2006.10.001. [DOI] [PubMed] [Google Scholar]
- Balleza E.; Kim J. M.; Cluzel P. Systematic characterization of maturation time of fluorescent proteins in living cells. Nat. Methods 2018, 15, 47–51. 10.1038/nmeth.4509. [DOI] [PMC free article] [PubMed] [Google Scholar]
- Hebisch E.; Knebel J.; Landsberg J.; Frey E.; Leisner M. High variation of fluorescence protein maturation times in closely related Escherichia coli strains. PLoS One 2013, 8, e75991. 10.1371/journal.pone.0075991. [DOI] [PMC free article] [PubMed] [Google Scholar]
- Markwardt M. L.; Kremers G. J.; Kraft C. A.; Ray K.; Cranfill P. J.; Wilson K. A.; Day R. N.; Wachter R. M.; Davidson M. W.; Rizzo M. A. An improved cerulean fluorescent protein with enhanced brightness and reduced reversible photoswitching. PLoS One 2011, 6, e17896. 10.1371/journal.pone.0017896. [DOI] [PMC free article] [PubMed] [Google Scholar]
- Boersma A. J.; Zuhorn I. S.; Poolman B. A sensor for quantification of macromolecular crowding in living cells. Nat. Methods 2015, 12, 227–29. ff 10.1038/nmeth.3257. [DOI] [PubMed] [Google Scholar]
- Liu B.; Aberg C.; van Eerden F. J.; Marrink S. J.; Poolman B.; Boersma A. J. Design and Properties of Genetically Encoded Probes for Sensing Macromolecular Crowding. Biophys. J. 2017, 112, 1929–1939. 10.1016/j.bpj.2017.04.004. [DOI] [PMC free article] [PubMed] [Google Scholar]
- Goedhart J.; von Stetten D.; Noirclerc-Savoye M.; Lelimousin M.; Joosen L.; Hink M. A.; van Weeren L.; Gadella T. W. Jr.; Royant A. Structure-guided evolution of cyan fluorescent proteins towards a quantum yield of 93%. Nat. Commun. 2012, 3, 751. 10.1038/ncomms1738. [DOI] [PMC free article] [PubMed] [Google Scholar]
- Janke C.; Magiera M. M.; Rathfelder N.; Taxis C.; Reber S.; Maekawa H.; Moreno-Borchart A.; Doenges G.; Schwob E.; Schiebel E.; Knop M. A versatile toolbox for PCR-based tagging of yeast genes: new fluorescent proteins, more markers and promoter substitution cassettes. Yeast 2004, 21, 947–962. 10.1002/yea.1142. [DOI] [PubMed] [Google Scholar]
- Brachmann C. B.; Davies A.; Cost G. J.; Caputo E.; Li J.; Hieter P.; Boeke J. D. Designer deletion strains derived from Saccharomyces cerevisiae S288C: a useful set of strains and plasmids for PCR-mediated gene disruption and other applications. Yeast 1998, 14, 115–132. . [DOI] [PubMed] [Google Scholar]
- Neidhardt F. C.; Bloch P. L.; Smith D. F. Culture medium for enterobacteria. J. Bacteriol. 1974, 119, 736–747. [DOI] [PMC free article] [PubMed] [Google Scholar]
- Escalante-Chong R.; Savir Y.; Carroll S. M.; Ingraham J. B.; Wang J.; Marx C. J.; Springer M. Galactose metabolic genes in yeast respond to a ratio of galactose and glucose. Proc. Natl. Acad. Sci. U. S. A. 2015, 112, 1636–1641. 10.1073/pnas.1418058112. [DOI] [PMC free article] [PubMed] [Google Scholar]
- Currie M.; Leopold H.; Schwarz J.; Boersma A. J.; Sheets E. D.; Heikal A. A. Fluorescence Dynamics of a FRET Probe Designed for Crowding Studies. J. Phys. Chem. B 2017, 121, 5688–5698. 10.1021/acs.jpcb.7b01306. [DOI] [PubMed] [Google Scholar]
- Sukenik S.; Ren P.; Gruebele M. Weak protein-protein interactions in live cells are quantified by cell-volume modulation. Proc. Natl. Acad. Sci. U. S. A. 2017, 114, 6776–6781. 10.1073/pnas.1700818114. [DOI] [PMC free article] [PubMed] [Google Scholar]
- Gnutt D.; Brylski O.; Edengeiser E.; Havenith M.; Ebbinghaus S. Imperfect crowding adaptation of mammalian cells towards osmotic stress and its modulation by osmolytes. Mol. BioSyst. 2017, 13, 2218–2221. 10.1039/C7MB00432J. [DOI] [PubMed] [Google Scholar]
- Gnutt D.; Gao M.; Brylski O.; Heyden M.; Ebbinghaus S. Excluded-volume effects in living cells. Angew. Chem., Int. Ed. 2015, 54, 2548–2551. 10.1002/anie.201409847. [DOI] [PMC free article] [PubMed] [Google Scholar]
- Bandyopadhyay B.; Goldenzweig A.; Unger T.; Adato O.; Fleishman S. J.; Unger R.; Horovitz A. Local energetic frustration affects the dependence of green fluorescent protein folding on the chaperonin GroEL. J. Biol. Chem. 2017, 292, 20583–20591. 10.1074/jbc.M117.808576. [DOI] [PMC free article] [PubMed] [Google Scholar]
- Sawano A.; Miyawaki A. Directed evolution of green fluorescent protein by a new versatile PCR strategy for site-directed and semi-random mutagenesis. Nucleic Acids Res. 2000, 28, E78. 10.1093/nar/28.16.e78. [DOI] [PMC free article] [PubMed] [Google Scholar]
- Jung G.; Wiehler J.; Zumbusch A. The photophysics of green fluorescent protein: influence of the key amino acids at positions 65, 203, and 222. Biophys. J. 2005, 88, 1932–1947. 10.1529/biophysj.104.044412. [DOI] [PMC free article] [PubMed] [Google Scholar]
- Hoefig H.; Otten J.; Steffen V.; Pohl M.; Boersma A. J.; Fitter J. Genetically Encoded Förster Resonance Energy Transfer-Based Biosensors Studied on the Single-Molecule Level. ACS Sensors 2018, 3, 1462. 10.1021/acssensors.8b00143. [DOI] [PubMed] [Google Scholar]
- Hoppe A.; Christensen K.; Swanson J. A. Fluorescence resonance energy transfer-based stoichiometry in living cells. Biophys. J. 2002, 83, 3652–3664. 10.1016/S0006-3495(02)75365-4. [DOI] [PMC free article] [PubMed] [Google Scholar]
- Shinoda H.; Ma Y.; Nakashima R.; Sakurai K.; Matsuda T.; Nagai T. Acid-Tolerant Monomeric GFP from Olindias formosa. Cell. Chem. Biol. 2018, 25, 330–338. 10.1016/j.chembiol.2017.12.005. [DOI] [PubMed] [Google Scholar]
- Lam A. J.; St-Pierre F.; Gong Y.; Marshall J. D.; Cranfill P. J.; Baird M. A.; McKeown M. R.; Wiedenmann J.; Davidson M. W.; Schnitzer M. J.; Tsien R. Y.; Lin M. Z. Improving FRET dynamic range with bright green and red fluorescent proteins. Nat. Methods 2012, 9, 1005–1012. 10.1038/nmeth.2171. [DOI] [PMC free article] [PubMed] [Google Scholar]
Associated Data
This section collects any data citations, data availability statements, or supplementary materials included in this article.


