Abstract
Purpose of review
The use of quantitative analysis in single photon emission computed tomography (SPECT) and positron emission tomography (PET) has become an integral part of current clinical practice and plays a crucial role in the detection and risk stratification of coronary artery disease. Emerging technologies, new protocols, and new quantification methods have had a significant impact on the diagnostic performance and prognostic value of nuclear cardiology imaging, while reducing the need for clinician oversight. In this review, we aim to describe recent advances in automation and quantitative analysis in nuclear cardiology.
Recent Findings
Recent publications have shown that fully automatic processing is feasible, limiting human input to specific cases where aberrancies are detected by the quality control software. Furthermore, there is evidence indicating that fully quantitative analysis of myocardial perfusion imaging is feasible and can achieve at least similar diagnostic accuracy as visual interpretation by an expert clinician. In addition, the use of fully automated quantification in combination with machine learning algorithms can provide incremental diagnostic and prognostic value over the traditional method of expert visual interpretation.
Summary
Emerging technologies in nuclear cardiology focus on automation and the use of artificial intelligence as part of the interpretation process. This review highlights the benefits and limitations of these applications, and outlines future directions in the field.
Keywords: Myocardial perfusion imaging, coronary artery disease, ejection fraction, prognosis, diagnosis, machine learning, quantitative analysis
INTRODUCTION
Single photon emission computed tomography (SPECT) myocardial perfusion imaging (MPI) remains the most widely used non-invasive technique for the detection and risk assessment of patients with coronary artery disease (CAD).(1) To that end, positron emission tomography (PET) applications in MPI and coronary flow assessment are emerging as techniques with even greater diagnostic and prognostic value. (2–4) One of the most important advantages of these methods over other modalities, such as echocardiography and magnetic resonance imaging, is the ability to obtain objective and reproducible quantitative data.(5, 6) Most of the published literature on diagnostic and prognostic value of SPECT and PET has been based on semi-quantitative assessment of perfusion. However, recent advances in software development and emerging artificial intelligence technologies have indicated that it is feasible to obtain at least similar diagnostic accuracy with better reproducibility when fully automated, quantitative assessment is used.(7, 8) This approach has the potential to improve the efficiency of image interpretation while reducing the inter- and intra-observer variability.(9) Current analysis methods are employed in left ventricle segmentation, motion correction, myocardial perfusion, myocardial blood flow assessment, left ventricular function quantification, and evaluation of mechanical dyssynchrony. Emerging technologies include the use of artificial intelligence in machine learning and deep learning algorithms.
ADVANCES IN IMAGE PROCESSING
Left Ventricular Segmentation
Adequate segmentation of the left ventricle (LV) with proper delineation of LV contours is required for a reliable quantitative assessment of MPI. Myocardial segmentation can be particularly difficult in certain circumstances, such as increased extra-cardiac radiotracer uptake, large and severe perfusion defects, and the presence of significant image noise. These scenarios can lead to errors in LV contour selection and incorrect definition of the mitral valve plane, in which cases, operator supervision is required to verify and correct myocardial segmentation.
In recent years, different software tools that optimize the automatic segmentation process have been developed. One of these methods checks the automatically obtained contours to derive two quality control (QC) scores which define the probability of segmentation failure. One of these scores detects mask-failure (incorrect LV shape) known as “shape flag” and the other one is related to inadequate position of mitral valve known as “valve-plane flag”. In a recent study, this QC software method produced similar results to expert readers in identification of segmentation failures and significantly decreased the amount of operator oversight required for image processing. (10)
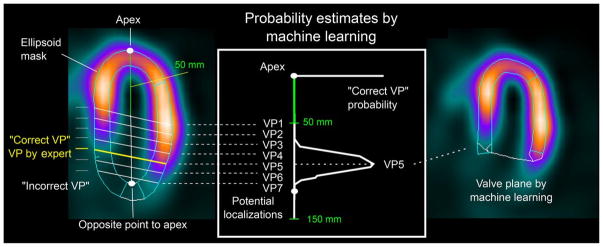
Another method that has been recently used is “same patient processing”, in which segmentation mask location is obtained from multiple data sets (with the higher quality ones given higher weight) and applied to cases flagged as possible failure by the algorithm. This processing method improves contour detection by avoiding inter-study inconsistencies. However, this can only be applicable in patients with multiple MPI studies. (11) Most recently, machine learning algorithms have been included in the process of automatic valve plane localization through the use of support vector machines (Figure 1), demonstrating that the machine learning model was as effective as expert operator in localizing the valve plane and had equivalent diagnostic accuracy.(12) These findings suggest that full automation in the segmentation process is feasible with the use of QC software in combination with machine learning algorithms. These methods will lead to higher efficiency in data processing and better allocation of human resources.
Figure 1. Automatic Valve Plane Localization by Machine Learning.
Two-class support vector machine (SVM) model trained from valve plane positioning verified by 2 experts is used to estimate the most likely valve plane localization in left ventricle. Reproduced from research originally published in JNM. Betancur J, Rubeaux M, Fuchs TA, Otaki Y, Arnson Y, Slipczuk L, et al. Automatic Valve Plane Localization in Myocardial Perfusion SPECT/CT by Machine Learning: Anatomic and Clinical Validation. J Nucl Med. 2017;58(6):961–7. © by the Society of Nuclear Medicine and Molecular Imaging, Inc. With permission.
Motion Correction
Motion during image acquisition could be related to the cardiac contraction, respiration, or patient movement. Motion from any source can produce significant image degradation. Patient motion correction algorithms have been applied for years. More recently, different methods have been proposed to decrease the effect of cardiac and respiratory motion.
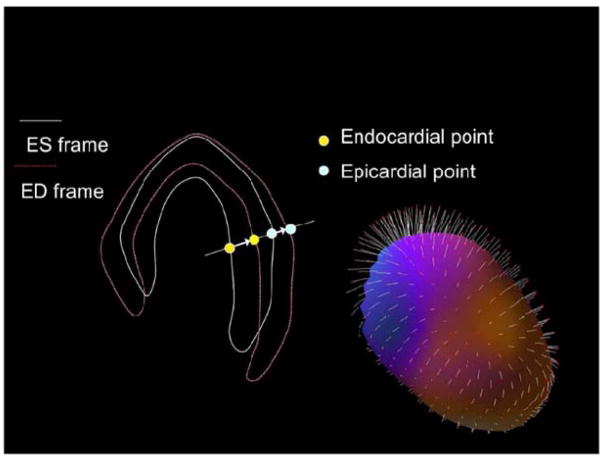
To avoid the degrading effects of cardiac motion and myocardial wall thickening on perfusion images, analysis of end-diastolic images only has been suggested, particularly in patients with small hearts.(13) However, routine use of only end-diastolic frames is not practical due to reduced count statistics. More recently, a new “motion-frozen” technique has been developed. This method employs the detection and tracking of the endocardial as well as epicardial borders of the left ventricle in all the gated frames using a contour extraction algorithm; then, image warping is applied to the gated data to match the diastolic position, and finally these warped images are added, creating motion frozen perfusion images (Figure 2). (14)
Figure 2. The Principle of Motion-Frozen Technique.
Three-dimensional left ventricular contours are identified on images from different cardiac phases. End-systolic (ES – white) and end-diastolic (ED – red) frames are shown on the left. 3D phase to phase motion vectors are derived by sampling epi- and endocardial surfaces. 3D motion vectors are shown on the right, superimposed on epicardial surface of the left ventricle. A non-linear image warping is then applied to warp all image phases to fit the ED phase. Reproduced from Motwani M, Berman DS, Germano G, Slomka P. Automated Quantitative Nuclear Cardiology Methods. Cardiol Clin. 2016;34(1):47–57. With permission.
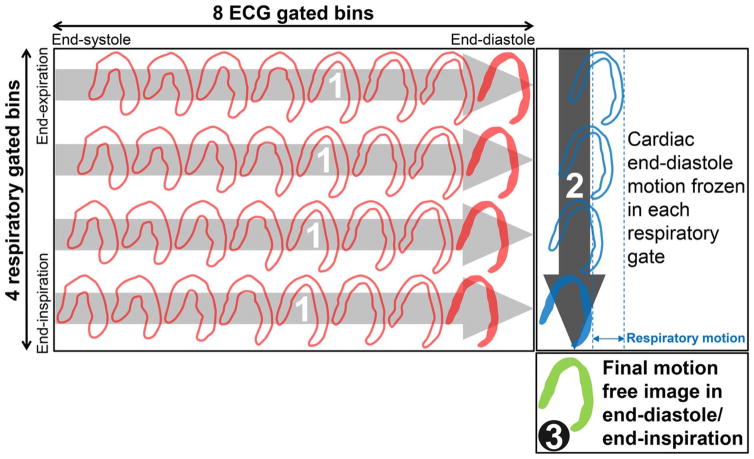
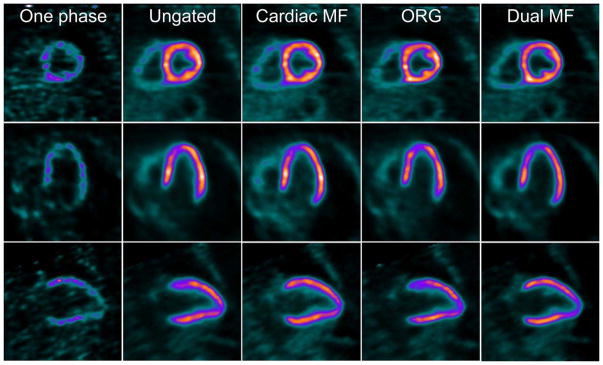
Recent studies have demonstrated the feasibility and applicability of respiratory motion correction in conventional dual-head cameras as well as in the newer CZT SPECT systems. These applications have been shown to decrease the incidence of false positive perfusion defects.(15–17) A more recent study evaluated the utility of dual cardiac and respiratory motion correction in PET imaging (Figure 3) using the novel radiotracer F-18 flurpiridaz, demonstrating an improved image resolution, contrast, and contrast-to-noise ratio (Figure 4 ).(18)
Figure 3. Dual Respiratory/Cardiac Motion Frozen Technique.
Cardiac motion frozen processing separately in each respiratory phase (contoured red bins) to end-diastole phase (solid red bins). 2. Respiratory motion frozen processing of cardiac end-diastole bins (contoured blue bins) to end-inspiration bin (solid blue bin). 3. Final motion-free image in end-diastole/end-inspiration (solid green bin). ECG = electrocardiography. Reproduced from research originally published in JNM. Slomka PJ, Rubeaux M, Le Meunier L, Dey D, Lazewatsky JL, Pan T, et al. Dual-Gated Motion-Frozen Cardiac PET with Flurpiridaz F 18. J Nucl Med. 2015;56(12):1876–81. © by the Society of Nuclear Medicine and Molecular Imaging, Inc. With permission.
Figure 4. Representative Case of Dual Cardiac and Respiratory Motion Frozen MPI.
Short, vertical, and horizontal axis views of adenosine stress flurpiridaz F-18 images acquired in dual (cardiac and respiratory) motion frozen (MF) mode. One phase = 1 cardiac gate in end inspiration; cardiac MF no respiratory gating; ORG, optimal respiratory gating; dual MF = dual (cardiac/respiratory) MF. Reproduced from research originally published in JNM. Slomka PJ, Rubeaux M, Le Meunier L, Dey D, Lazewatsky JL, Pan T, et al. Dual-Gated Motion-Frozen Cardiac PET with Flurpiridaz F 18. J Nucl Med. 2015;56(12):1876–81. © by the Society of Nuclear Medicine and Molecular Imaging, Inc. With permission.
TRENDS IN QUANTITATIVE PARAMETER ASSESSMENT
Perfusion Quantification
Traditionally, interpretation of perfusion images has been performed through visual assessment by clinicians. However, this approach is time consuming and suffers from significant inter- and intra-observer variability and consequently limited reproducibility.(5, 8) Multiple software packages have been developed by different vendors to generate automatic myocardial perfusion quantification.(19–22) All these software packages have a similar approach to evaluating myocardial perfusion, which begins with the generation of polar maps on a standard American Heart Association 17 segment model. (23) Polar maps then undergo count normalization to allow an objective comparison with a normal database. After normalization, the rest and stress polar maps are compared with the respective normal dataset (consisting of 20–50 scans of normal subjects) and differences in relative segmental counts are quantified to determine the extent and severity of hypoperfusion. Standard segmental AHA scores can be obtained in 17 segments, can be reported in as partial scores in specific vascular territories or for the entire myocardium by deriving the commonly used parameters of summed rest score (SRS), summed stress score (SSS) and summed difference score (SDS).(24)
Similarly, using the polar maps, a different method of perfusion quantification, based on pixel-by-pixel assessment and known as total perfusion deficit (TPD) has been developed. This method combines both extent and severity of hypoperfusion. Automated comparison of TPD at rest and stress quantifies the amount of myocardial ischemia by generating the ischemic TPD. This quantification method has been shown to be superior to visual assessment of perfusion images.(25)
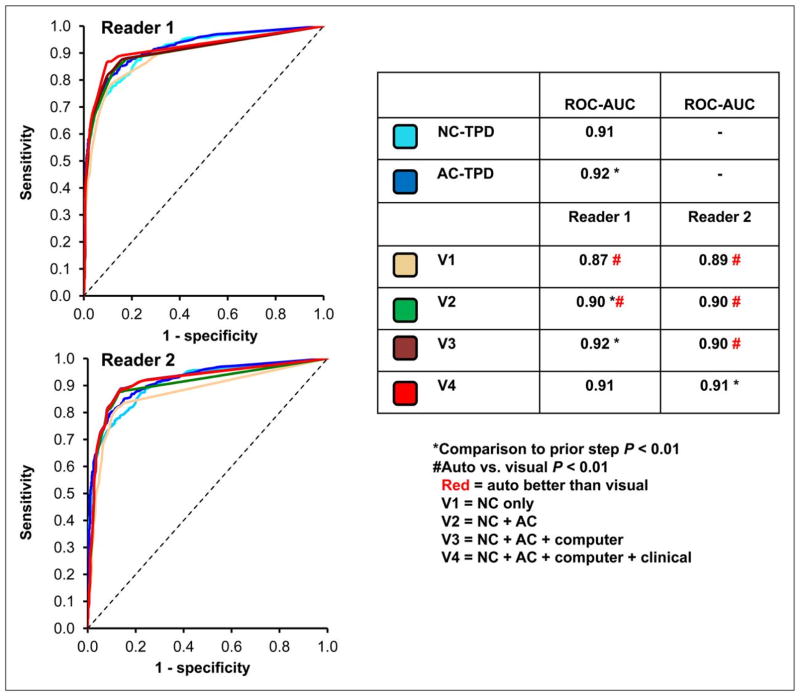
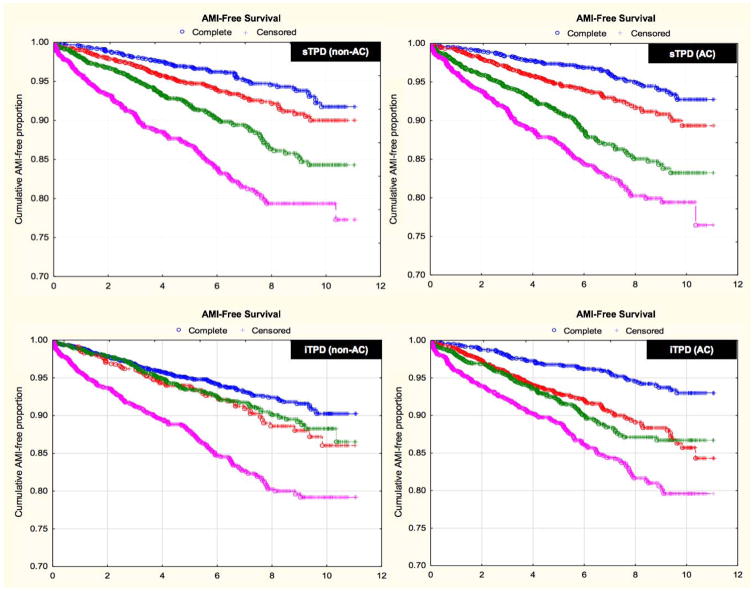
In recent years, there has been a growing body of literature evaluating the diagnostic and prognostic utility of fully automated MPI interpretation. Arsanjani et al. demonstrated that this approach, using TPD as the main parameter of perfusion abnormality, was at least equivalent to expert readers in identifying significant coronary artery lesions, irrespective of the use of attenuation correction (Figure 5).(7) Furthermore, the prognostic value of a fully quantitative assessment of perfusion images integrated with clinical variables, using a machine learning algorithm, was shown to be comparable or superior to expert interpretation in predicting early coronary revascularization.(26) More recently, in a large cohort of patients with automatically processed MPI studies, fully quantitative stress TPD was shown to be an independent predictor of future myocardial infarctions, regardless of the use of attenuation correction (Figure 6).(27, 28)
Figure 5. Diagnostic Performance of Automated versus Visual Interpretation.
Receiver operator characteristic curves comparing diagnostic performance between reads on per-patient basis (2 readers for detection of >70% diameter coronary stenosis). V, visual analysis; NC, non-attenuation corrected images; AC, attenuation corrected. Reproduced from research originally published in JNM. Arsanjani R, Xu Y, Hayes SW, Fish M, Lemley M, Jr., Gerlach J, et al. Comparison of fully automated computer analysis and visual scoring for detection of coronary artery disease from myocardial perfusion SPECT in a large population. J Nucl Med. 2013;54(2):221–8. © by the Society of Nuclear Medicine and Molecular Imaging, Inc. With permission.
Figure 6. Survival Free of Acute Myocardial Infarction According to Automated Quantitative Analysis.
Kaplan-Meier plots of survival free of acute myocardial infarction according to automated sTPD (A; B) and automated iTPD (C;D) for both non-AC and AC data. There was a stepwise increase in risk of acute myocardial infarction by sTPD quartile and by iTPD quartile for both AC and non-AC data (P<0.0001 for hazard ratio comparison across quartiles). Median (Lower - upper quartile) thresholds were: 5.4 (1.9 – 14.5) for non-AC sTPD; 7.1 (2.8 – 15.8) for AC sTPD; 1.0 (0 – 4.5) for non-AC iTPD; and 4.3 (2.0 – 7.8) for AC iTPD. AMI, acute myocardial infarction; sTPD, stress total perfusion deficit; iTPD, ischemic perfusion deficit; AC, attenuation corrected. Adapted from Motwani M, Leslie WD, Goertzen AL, Otaki Y, Germano G, Berman DS, et al. Fully automated analysis of attenuation-corrected SPECT for the long-term prediction of acute myocardial infarction. J Nucl Cardiol. 2017. DOI: 10.1007/s12350-017-0840-0. With permission
Ischemic Change
Another area where fully quantitative perfusion analysis has demonstrated its clinical utility is in the longitudinal assessment of ischemic change. This assessment has been traditionally done by expert visual side-by-side comparison; however, small but clinically relevant changes over time can be difficult to identify visually due to the subjectivity and limited intra- and inter-observer reproducibility. A fully quantitative approach can eliminate the subjectivity and precisely identify small but relevant temporal changes. Furthermore, the use of automated software in the longitudinal evaluation of ischemic burden can be further refined by analyzing serial stress/rest studies together in pairs, eliminating errors associated with multiple comparisons to normal limits and variations in contour placements. Moreover, this method has the advantage of not requiring a normal limit database.(29, 30)
Quantitative comparison has been shown to achieve a higher level of reproducibility and repeatability.(5, 8) A clear example is the nuclear sub-study of the COURAGE trial, in which a significant difference in the fully quantitative TPD measurement of ischemic burden was noted in the percutaneous coronary revascularization group versus the medical therapy only group (TPD: −2.7% vs. −0.5%, P <0.0001).(31) Such a difference would have been more difficult to demonstrate if visual interpretation of perfusion images had been used. Importantly, in the COURAGE trial, this small difference in TPD translated into a difference in patients’ outcomes.(31)
Myocardial Blood Flow and Early Ejection Fraction
Myocardial blood flow (MBF) and myocardial flow reserve (MFR) are important variables which have been shown to add relevant information to perfusion imaging. Absolute MBF has been noted to add value in the diagnosis of multivessel coronary artery disease as well as predict the extent of disease more accurately than traditional perfusion assessment.(32, 33) Similarly, MFR has demonstrated increased prognostic value compared to relative perfusion defects alone, allowing for more accurate risk stratification.(34–36) Traditionally, MBF evaluation has been achieved using PET imaging. However, recent publications have established the feasibility of MBF assessment using dynamic SPECT acquisition.(37) Furthermore, emerging data suggests that the accuracy of SPECT and PET to determine MBF values may be comparable.(38, 39) Considering that the vast majority (95%) of nuclear MPI studies in the United States are performed using SPECT, these recent studies open the possibility of a much wider use of MBF and MFR, even with the understanding that there are still significant limitations to overcome.
An additional benefit of dynamic image acquisition for the purpose of measuring MBF and MFR, is the possibility of measuring LV ejection fraction during stress, as is the case with PET imaging. True stress LV ejection fraction allows for determination of LV ejection fraction reserve. The predictive value of this parameter has been validated when obtained by PET imaging.(3, 40) Preliminary data suggests that obtaining accurate measurements of both myocardial flow data and LV ejection fraction reserve is not only feasible but also may be used to improve the predictive value of SPECT imaging.(41)
Left Ventricular Mechanical Dyssynchrony
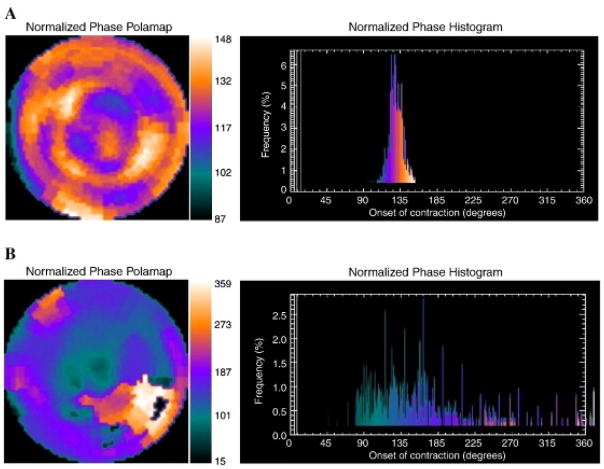
The use of phase analysis for the detection of mechanical dyssynchrony of the left ventricle has gained attention in recent years. In this method, a count distribution is derived from each of the LV short-axis datasets; then, a Fourier transformation is applied to the count variation over time for each voxel, generating a 3D phase distribution describing the onset of mechanical contraction over the entire cycle (Figure 7).(42, 43) The two commonly used parameters are phase standard deviation and histogram bandwidth; these measures have been validated against other imaging modalities demonstrating excellent reproducibility and repeatability. (44, 45) Furthermore, in addition to demonstrating utility in the selection of patients for resynchronization therapy, fully automated quantification of left ventricular mechanical dyssynchrony has recently been shown to provide important prognostic information in different populations including patients with heart failure, CAD and end-stage renal disease.(46, 47)
Figure 7. Representative Phase Histograms of Left Ventricular Mechanical Contraction.
A) Normal phase histogram: The X-axis represents the timing of one cardiac cycle (R-R interval) normalized in degrees. The Y-axis represents the percent of myocardium demonstrating the onset of mechanical contraction during any particular phase of the cardiac cycle. The color maps have 256 levels with the minimum level corresponding to black and the maximum level corresponding to white. B) Abnormal phase histogram showing a wide bandwidth indicating a delayed onset of myocardial contraction representing significant left ventricular mechanical dyssynchrony. Reproduced from Atchley AE, Kitzman DW, Whellan DJ, Iskandrian AE, Ellis SJ, Pagnanelli RA, et al. Myocardial perfusion, function, and dyssynchrony in patients with heart failure: baseline results from the single-photon emission computed tomography imaging ancillary study of the Heart Failure and A Controlled Trial Investigating Outcomes of Exercise TraiNing (HF-ACTION) Trial. Am Heart J. 2009;158(4 Suppl):S53–63. With permission.
Calcium Scores from CT Attenuation Correction Scans in PET/SPECT
Coronary artery calcium score (CACS) has been shown to add diagnostic and prognostic value to MPI, and is an independent predictor of future cardiovascular events.(48) The increased use of combined SPECT and PET MPI with low-dose CT for attenuation correction has raised interest in the possibility of deriving complimentary information regarding CACS from the CT component of the exam. Recent studies have investigated the feasibility of identifying and quantifying CACS from the CT attenuation correction images, in an attempt to avoid a dedicated CT scan for CACS, thus, reducing radiation exposure, cost, and time. (49–51) Most studies have focused on manual or visual estimation of CACS from attenuation correction scan. However, in a recent study, Isgum et al. evaluated a fully automated method to determine CACS from CT attenuation correction images obtained during PET/CT acquisition, indicating that this approach may allow routine cardiovascular risk assessment from the CT attenuation correction component of perfusion studies. (52)
MACHINE LEARNING AND DEEP LEARNING ALGORITHMS
The use of computer algorithms to identify patterns in multivariable datasets through machine learning has gained popularity in many different imaging fields including nuclear cardiology.(12, 26, 53, 54) These algorithms usually create a model from test inputs; based on these data, these algorithms render decisions or predictions. In MPI, a large number of parameters including stress data, clinical parameters, and imaging variables can be used by machine learning algorithms to make predictions of relevant outcomes, such as the presence of obstructive CAD or risk of major adverse cardiac events. Recent studies have evaluated the applicability and impact of machine learning algorithms into daily clinical practice. In a retrospective analysis of over ten thousand patients undergoing coronary computed tomographic angiography (CCTA) from the CONFIRM registry, Motwani et al. evaluated the feasibility and accuracy of machine learning to predict 5-year mortality compared to standard CCTA parameters and found that machine learning combining clinical and CCTA parameters was able to predict all-cause mortality at 5 years significantly better than CCTA parameters alone. (53)
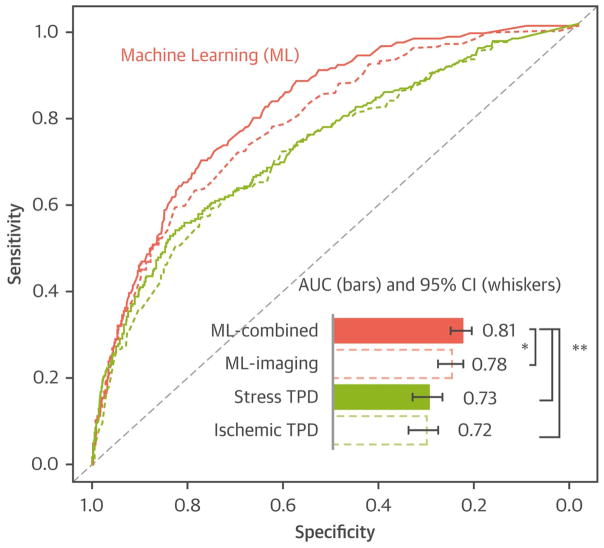
Furthermore, specifically using SPECT MPI, the same group evaluated the predictive value of combining clinical information with MPI data using machine learning in a cohort of 2,619 patients. The authors considered a total of 28 clinical, 17 stress and 25 imaging variables and found that machine learning combining these variables had a high predictive accuracy for 3-year risk of adverse cardiac events and was superior to existing visual or automated perfusion assessment in isolation (Figure 8).(55) More complex algorithms involving deep machine learning are currently under investigation.
Figure 8. Machine Learning for 3 Year MACE Prediction.
Machine learning combining all variables using variable selection and LogitBoost algorithm (ML-combined) had a significantly higher AUC for MACE prediction than machine learning combining imaging data variables only (ML-imaging), and standard image analysis. ML, machine learning; AUC, area under the curve; MACE, major adverse cardiac events; ROC, receiver-operating characteristic; TPD, total perfusion deficit. *P < 0.01, **P < 0.001, in AUC comparison by Delong test. Reproduced from Betancur J, Otaki Y, Motwani M, Fish M, Lemley M, Dey D, et al. Prognostic value of combined clinical and myocardial perfusion imaging data using machine learning. JACC Cardiovasc Imaging. 2017;In Press. With permission.
Currently, the reported results for cardiovascular death prediction use a simple probabilistic model of the event presence or absence within the average patient follow-up time, since adjustments for the time-to event cannot be readily applied with most existing machine learning tools. However, clinicians are often more interested in evaluating the relative risk of a disease or event between patients with different covariates rather than absolute chance of event. More sophisticated analysis adjusting for the time to event have not yet been reported with machine learning in cardiovascular imaging. There are new tools becoming available for such analysis and future machine learning methods may compare these methods to traditional analysis. This adjustment for the time-to-event would play a lesser role in data with relatively uniform and shorter follow-up time for the prognostic prediction.(56, 57)
Deep machine learning has recently been shown very effective in many imaging applications. Deep learning or convolutional neural network learning uses more layers than traditional approaches, making it better suited for large and complex datasets, and in particular for direct image analysis. Standard machine learning methods typically require pre-specified measurements and feature extraction (for example quantitative parameters such as perfusion defect size or, amount of ischemia, coronary plaque size etc.) to characterize the information from the raw imaging data. In contrast, deep learning can absorb the measurement engineering directly into a step that learns the required measurements while processing the data in its natural form.
Preliminary studies of deep learning application directly to medical image data indicate that these approaches may be able to outperform existing quantitative image processing methods. Recently, the use of deep convolutional neural networks (CNN) for automatic prediction of coronary stenosis using raw polar black-out maps plus TPD was compared to standard quantitative analysis (TPD) only, in a preliminary report at the ASNC 2017 congress. The authors demonstrated that CNN using deep learning, raw polar maps and TPD improved prediction of obstructive coronary stenosis. (58) In summary, the use of machine learning technology is rapidly evolving in nuclear cardiac imaging allowing more accurate diagnosis and risk prediction. Nonetheless, its routine application in daily clinical practice is still yet to come.
CONCLUSIONS
Novel applications in MPI have been facilitated by the rapid development of newer technologies. These applications demonstrate potential as important tools to diagnose and better risk stratify patients with known or suspected CAD. Full automation of MPI processing and interpretation has become more widespread with the use of new technologies and machine learning algorithms. Nonetheless, additional data validating these applications in multicenter uncontrolled clinical settings are still required before wide scale implementation in routine clinical use. The impact of these tools on decision making, downstream utilization of resources, cost, and value-based practice needs to be investigated.
Acknowledgments
This work was supported in part by grant R01HL089765 from the National Heart, Lung, and Blood Institute/National Institutes of Health (NHLBI/NIH) (PI: Piotr Slomka). The views expressed in this manuscript are those of the authors and do not necessarily reflect the official views of the National Heart, Lung, and Blood Institute, the National Institutes of Health, or the Department of Health and Human Services.
ABBREVIATIONS
- CAD
coronary artery disease
- LV
left ventricular
- MPI
myocardial perfusion imaging
- PET
positron emission tomography
- SPECT
single photon emission computed tomography
- TPD
total perfusion deficit
Footnotes
Compliance with Ethics Guidelines
Conflicts of Interest: Rami Doukky receives research funding grants and serves on an advisory board for Astellas Pharma Astellas Pharma Global Development (Northbrook, IL). Guido Germano and Piotr Slomka receive royalties from Cedars-Sinai for licensing of quantitative algorithms for nuclear cardiology. The other authors have nothing to disclose.
Human and Animal Rights and Informed Consent
This article does not contain any studies with human or animal subjects performed by any of the authors.
References
- 1.Salerno M, Beller GA. Noninvasive assessment of myocardial perfusion. Circ Cardiovasc Imaging. 2009;2(5):412–24. doi: 10.1161/CIRCIMAGING.109.854893. [DOI] [PubMed] [Google Scholar]
- 2.Shaw LJ, Iskandrian AE. Prognostic value of gated myocardial perfusion SPECT. J Nucl Cardiol. 2004;11(2):171–85. doi: 10.1016/j.nuclcard.2003.12.004. [DOI] [PubMed] [Google Scholar]
- 3.Dorbala S, Vangala D, Sampson U, Limaye A, Kwong R, Di Carli MF. Value of vasodilator left ventricular ejection fraction reserve in evaluating the magnitude of myocardium at risk and the extent of angiographic coronary artery disease: a 82Rb PET/CT study. J Nucl Med. 2007;48(3):349–58. [PubMed] [Google Scholar]
- 4.Yoshinaga K, Chow BJ, Williams K, Chen L, deKemp RA, Garrard L, et al. What is the prognostic value of myocardial perfusion imaging using rubidium-82 positron emission tomography? J Am Coll Cardiol. 2006;48(5):1029–39. doi: 10.1016/j.jacc.2006.06.025. [DOI] [PubMed] [Google Scholar]
- 5.Berman DS, Kang X, Gransar H, Gerlach J, Friedman JD, Hayes SW, et al. Quantitative assessment of myocardial perfusion abnormality on SPECT myocardial perfusion imaging is more reproducible than expert visual analysis. J Nucl Cardiol. 2009;16(1):45–53. doi: 10.1007/s12350-008-9018-0. [DOI] [PMC free article] [PubMed] [Google Scholar]
- 6.Iskandrian AE, Garcia EV, Faber T, Mahmarian JJ. Automated assessment of serial SPECT myocardial perfusion images. J Nucl Cardiol. 2009;16(1):6–9. doi: 10.1007/s12350-008-9020-6. [DOI] [PubMed] [Google Scholar]
- 7.Arsanjani R, Xu Y, Hayes SW, Fish M, Lemley M, Jr, Gerlach J, et al. Comparison of fully automated computer analysis and visual scoring for detection of coronary artery disease from myocardial perfusion SPECT in a large population. J Nucl Med. 2013;54(2):221–8. doi: 10.2967/jnumed.112.108969. [DOI] [PMC free article] [PubMed] [Google Scholar]
- 8.Xu Y, Hayes S, Ali I, Ruddy TD, Wells RG, Berman DS, et al. Automatic and visual reproducibility of perfusion and function measures for myocardial perfusion SPECT. J Nucl Cardiol. 2010;17(6):1050–7. doi: 10.1007/s12350-010-9297-0. [DOI] [PMC free article] [PubMed] [Google Scholar]
- 9.Slomka P, Xu Y, Berman D, Germano G. Quantitative analysis of perfusion studies: strengths and pitfalls. J Nucl Cardiol. 2012;19(2):338–46. doi: 10.1007/s12350-011-9509-2. [DOI] [PMC free article] [PubMed] [Google Scholar]
- 10.Xu Y, Kavanagh P, Fish M, Gerlach J, Ramesh A, Lemley M, et al. Automated quality control for segmentation of myocardial perfusion SPECT. J Nucl Med. 2009;50(9):1418–26. doi: 10.2967/jnumed.108.061333. [DOI] [PMC free article] [PubMed] [Google Scholar]
- 11*.Germano G, Kavanagh PB, Fish MB, Lemley MH, Xu Y, Berman DS, et al. “Same-Patient Processing” for multiple cardiac SPECT studies. 1. Improving LV segmentation accuracy. J Nucl Cardiol. 2016;23(6):1435–41. doi: 10.1007/s12350-016-0673-2. [DOI] [PMC free article] [PubMed] [Google Scholar]
- 12*.Betancur J, Rubeaux M, Fuchs TA, Otaki Y, Arnson Y, Slipczuk L, et al. Automatic Valve Plane Localization in Myocardial Perfusion SPECT/CT by Machine Learning: Anatomic and Clinical Validation. J Nucl Med. 2017;58(6):961–7. doi: 10.2967/jnumed.116.179911. [DOI] [PMC free article] [PubMed] [Google Scholar]
- 13.Taillefer R, DePuey EG, Udelson JE, Beller GA, Benjamin C, Gagnon A. Comparison between the end-diastolic images and the summed images of gated 99mTc-sestamibi SPECT perfusion study in detection of coronary artery disease in women. J Nucl Cardiol. 1999;6(2):169–76. doi: 10.1016/s1071-3581(99)90077-6. [DOI] [PubMed] [Google Scholar]
- 14.Slomka PJ, Nishina H, Berman DS, Kang X, Akincioglu C, Friedman JD, et al. “Motion-frozen” display and quantification of myocardial perfusion. J Nucl Med. 2004;45(7):1128–34. [PubMed] [Google Scholar]
- 15.Qi W, Yang Y, Wernick MN, Pretorius PH, King MA. Limited-angle effect compensation for respiratory binned cardiac SPECT. Med Phys. 2016;43(1):443. doi: 10.1118/1.4938579. [DOI] [PMC free article] [PubMed] [Google Scholar]
- 16*.Daou D, Sabbah R, Coaguila C, Boulahdour H. Applicability of data-driven respiratory motion correction to CZT SPECT myocardial perfusion imaging in the clinical setting: The birth of an old wish. J Nucl Cardiol. 2017;24(4):1451–3. doi: 10.1007/s12350-016-0633-x. [DOI] [PubMed] [Google Scholar]
- 17.Daou D, Sabbah R, Coaguila C, Boulahdour H. Feasibility of data-driven cardiac respiratory motion correction of myocardial perfusion CZT SPECT: A pilot study. J Nucl Cardiol. 2016 doi: 10.1007/s12350-016-0493-4. [DOI] [PubMed] [Google Scholar]
- 18*.Slomka PJ, Rubeaux M, Le Meunier L, Dey D, Lazewatsky JL, Pan T, et al. Dual-Gated Motion-Frozen Cardiac PET with Flurpiridaz F 18. J Nucl Med. 2015;56(12):1876–81. doi: 10.2967/jnumed.115.164285. [DOI] [PubMed] [Google Scholar]
- 19.Liu YH. Quantification of nuclear cardiac images: the Yale approach. J Nucl Cardiol. 2007;14(4):483–91. doi: 10.1016/j.nuclcard.2007.06.005. [DOI] [PubMed] [Google Scholar]
- 20.Garcia EV, Faber TL, Cooke CD, Folks RD, Chen J, Santana C. The increasing role of quantification in clinical nuclear cardiology: the Emory approach. J Nucl Cardiol. 2007;14(4):420–32. doi: 10.1016/j.nuclcard.2007.06.009. [DOI] [PubMed] [Google Scholar]
- 21.Ficaro EP, Lee BC, Kritzman JN, Corbett JR. Corridor4DM: the Michigan method for quantitative nuclear cardiology. J Nucl Cardiol. 2007;14(4):455–65. doi: 10.1016/j.nuclcard.2007.06.006. [DOI] [PubMed] [Google Scholar]
- 22.Germano G, Kavanagh PB, Slomka PJ, Van Kriekinge SD, Pollard G, Berman DS. Quantitation in gated perfusion SPECT imaging: the Cedars-Sinai approach. J Nucl Cardiol. 2007;14(4):433–54. doi: 10.1016/j.nuclcard.2007.06.008. [DOI] [PubMed] [Google Scholar]
- 23.Cerqueira MD, Weissman NJ, Dilsizian V, Jacobs AK, Kaul S, Laskey WK, et al. Standardized myocardial segmentation and nomenclature for tomographic imaging of the heart: a statement for healthcare professionals from the Cardiac Imaging Committee of the Council on Clinical Cardiology of the American Heart Association. Circulation. 2002;105(4):539–42. doi: 10.1161/hc0402.102975. [DOI] [PubMed] [Google Scholar]
- 24.Hendel RC, Budoff MJ, Cardella JF, Chambers CE, Dent JM, Fitzgerald DM, et al. ACC/AHA/ACR/ASE/ASNC/HRS/NASCI/RSNA/SAIP/SCAI/SCCT/SCMR/SIR 2008 Key Data Elements and Definitions for Cardiac Imaging A Report of the American College of Cardiology/American Heart Association Task Force on Clinical Data Standards (Writing Committee to Develop Clinical Data Standards for Cardiac Imaging) J Am Coll Cardiol. 2009;53(1):91–124. doi: 10.1016/j.jacc.2008.09.006. [DOI] [PubMed] [Google Scholar]
- 25.Slomka PJ, Nishina H, Berman DS, Akincioglu C, Abidov A, Friedman JD, et al. Automated quantification of myocardial perfusion SPECT using simplified normal limits. J Nucl Cardiol. 2005;12(1):66–77. doi: 10.1016/j.nuclcard.2004.10.006. [DOI] [PubMed] [Google Scholar]
- 26*.Arsanjani R, Dey D, Khachatryan T, Shalev A, Hayes SW, Fish M, et al. Prediction of revascularization after myocardial perfusion SPECT by machine learning in a large population. J Nucl Cardiol. 2015;22(5):877–84. doi: 10.1007/s12350-014-0027-x. [DOI] [PMC free article] [PubMed] [Google Scholar]
- 27*.Motwani M, Leslie WD, Goertzen AL, Otaki Y, Germano G, Berman DS, et al. Fully automated analysis of attenuation-corrected SPECT for the long-term prediction of acute myocardial infarction. J Nucl Cardiol. 2017 doi: 10.1007/s12350-017-0840-0. [DOI] [PMC free article] [PubMed] [Google Scholar]
- 28.Sanghani RM, Doukky R. Fully automated analysis of perfusion data: The rise of the machines. J Nucl Cardiol. 2017 doi: 10.1007/s12350-017-0884-1. [DOI] [PubMed] [Google Scholar]
- 29.Slomka PJ, Nishina H, Berman DS, Kang X, Friedman JD, Hayes SW, et al. Automatic quantification of myocardial perfusion stress-rest change: a new measure of ischemia. J Nucl Med. 2004;45(2):183–91. [PubMed] [Google Scholar]
- 30.Slomka P, Hung GU, Germano G, Berman DS. Novel SPECT Technologies and Approaches in Cardiac Imaging. Cardiovasc Innov Appl. 2016;2(1):31–46. doi: 10.15212/CVIA.2016.0052. [DOI] [PMC free article] [PubMed] [Google Scholar]
- 31.Shaw LJ, Berman DS, Maron DJ, Mancini GB, Hayes SW, Hartigan PM, et al. Optimal medical therapy with or without percutaneous coronary intervention to reduce ischemic burden: results from the Clinical Outcomes Utilizing Revascularization and Aggressive Drug Evaluation (COURAGE) trial nuclear substudy. Circulation. 2008;117(10):1283–91. doi: 10.1161/CIRCULATIONAHA.107.743963. [DOI] [PubMed] [Google Scholar]
- 32.Fiechter M, Gebhard C, Ghadri JR, Fuchs TA, Pazhenkottil AP, Nkoulou RN, et al. Myocardial perfusion imaging with 13N-ammonia PET is a strong predictor for outcome. Int J Cardiol. 2013;167(3):1023–6. doi: 10.1016/j.ijcard.2012.03.076. [DOI] [PubMed] [Google Scholar]
- 33.Hajjiri MM, Leavitt MB, Zheng H, Spooner AE, Fischman AJ, Gewirtz H. Comparison of positron emission tomography measurement of adenosine-stimulated absolute myocardial blood flow versus relative myocardial tracer content for physiological assessment of coronary artery stenosis severity and location. JACC Cardiovasc Imaging. 2009;2(6):751–8. doi: 10.1016/j.jcmg.2009.04.004. [DOI] [PubMed] [Google Scholar]
- 34.Ziadi MC, Dekemp RA, Williams KA, Guo A, Chow BJ, Renaud JM, et al. Impaired myocardial flow reserve on rubidium-82 positron emission tomography imaging predicts adverse outcomes in patients assessed for myocardial ischemia. J Am Coll Cardiol. 2011;58(7):740–8. doi: 10.1016/j.jacc.2011.01.065. [DOI] [PubMed] [Google Scholar]
- 35.Herzog BA, Husmann L, Valenta I, Gaemperli O, Siegrist PT, Tay FM, et al. Long-term prognostic value of 13N-ammonia myocardial perfusion positron emission tomography added value of coronary flow reserve. J Am Coll Cardiol. 2009;54(2):150–6. doi: 10.1016/j.jacc.2009.02.069. [DOI] [PubMed] [Google Scholar]
- 36.Fukushima K, Javadi MS, Higuchi T, Lautamaki R, Merrill J, Nekolla SG, et al. Prediction of short-term cardiovascular events using quantification of global myocardial flow reserve in patients referred for clinical 82Rb PET perfusion imaging. J Nucl Med. 2011;52(5):726–32. doi: 10.2967/jnumed.110.081828. [DOI] [PubMed] [Google Scholar]
- 37.Klein R, Hung GU, Wu TC, Huang WS, Li D, deKemp RA, et al. Feasibility and operator variability of myocardial blood flow and reserve measurements with (9)(9)mTc-sestamibi quantitative dynamic SPECT/CT imaging. J Nucl Cardiol. 2014;21(6):1075–88. doi: 10.1007/s12350-014-9971-8. [DOI] [PubMed] [Google Scholar]
- 38*.Hsu B, Hu LH, Yang BH, Chen LC, Chen YK, Ting CH, et al. SPECT myocardial blood flow quantitation toward clinical use: a comparative study with 13N-Ammonia PET myocardial blood flow quantitation. Eur J Nucl Med Mol Imaging. 2017;44(1):117–28. doi: 10.1007/s00259-016-3491-5. [DOI] [PubMed] [Google Scholar]
- 39.Slomka PJ, Berman DS, Germano G. Absolute myocardial blood flow quantification with SPECT/CT: is it possible? J Nucl Cardiol. 2014;21(6):1092–5. doi: 10.1007/s12350-014-0002-6. [DOI] [PubMed] [Google Scholar]
- 40.Murthy VL, Naya M, Foster CR, Hainer J, Gaber M, Di Carli G, et al. Improved cardiac risk assessment with noninvasive measures of coronary flow reserve. Circulation. 2011;124(20):2215–24. doi: 10.1161/CIRCULATIONAHA.111.050427. [DOI] [PMC free article] [PubMed] [Google Scholar]
- 41.Brodov Y, Fish M, Rubeaux M, Otaki Y, Gransar H, Lemley M, et al. Quantitation of left ventricular ejection fraction reserve from early gated regadenoson stress Tc-99m high-efficiency SPECT. J Nucl Cardiol. 2016;23(6):1251–61. doi: 10.1007/s12350-016-0519-y. [DOI] [PMC free article] [PubMed] [Google Scholar]
- 42.Chen J, Garcia EV, Folks RD, Cooke CD, Faber TL, Tauxe EL, et al. Onset of left ventricular mechanical contraction as determined by phase analysis of ECG-gated myocardial perfusion SPECT imaging: development of a diagnostic tool for assessment of cardiac mechanical dyssynchrony. J Nucl Cardiol. 2005;12(6):687–95. doi: 10.1016/j.nuclcard.2005.06.088. [DOI] [PubMed] [Google Scholar]
- 43.Atchley AE, Kitzman DW, Whellan DJ, Iskandrian AE, Ellis SJ, Pagnanelli RA, et al. Myocardial perfusion, function, and dyssynchrony in patients with heart failure: baseline results from the single-photon emission computed tomography imaging ancillary study of the Heart Failure and A Controlled Trial Investigating Outcomes of Exercise TraiNing (HF-ACTION) Trial. Am Heart J. 2009;158(4 Suppl):S53–63. doi: 10.1016/j.ahj.2009.07.009. [DOI] [PMC free article] [PubMed] [Google Scholar]
- 44.Chen J, Garcia EV, Bax JJ, Iskandrian AE, Borges-Neto S, Soman P. SPECT myocardial perfusion imaging for the assessment of left ventricular mechanical dyssynchrony. J Nucl Cardiol. 2011;18(4):685–94. doi: 10.1007/s12350-011-9392-x. [DOI] [PMC free article] [PubMed] [Google Scholar]
- 45.Trimble MA, Velazquez EJ, Adams GL, Honeycutt EF, Pagnanelli RA, Barnhart HX, et al. Repeatability and reproducibility of phase analysis of gated single-photon emission computed tomography myocardial perfusion imaging used to quantify cardiac dyssynchrony. Nucl Med Commun. 2008;29(4):374–81. doi: 10.1097/MNM.0b013e3282f81380. [DOI] [PMC free article] [PubMed] [Google Scholar]
- 46.Aggarwal H, AlJaroudi WA, Mehta S, Mannon R, Heo J, Iskandrian AE, et al. The prognostic value of left ventricular mechanical dyssynchrony using gated myocardial perfusion imaging in patients with end-stage renal disease. J Nucl Cardiol. 2014;21(4):739–46. doi: 10.1007/s12350-014-9886-4. [DOI] [PubMed] [Google Scholar]
- 47.Pazhenkottil AP, Buechel RR, Husmann L, Nkoulou RN, Wolfrum M, Ghadri JR, et al. Long-term prognostic value of left ventricular dyssynchrony assessment by phase analysis from myocardial perfusion imaging. Heart. 2011;97(1):33–7. doi: 10.1136/hrt.2010.201566. [DOI] [PubMed] [Google Scholar]
- 48.Brodov Y, Gransar H, Dey D, Shalev A, Germano G, Friedman JD, et al. Combined Quantitative Assessment of Myocardial Perfusion and Coronary Artery Calcium Score by Hybrid 82Rb PET/CT Improves Detection of Coronary Artery Disease. J Nucl Med. 2015;56(9):1345–50. doi: 10.2967/jnumed.114.153429. [DOI] [PubMed] [Google Scholar]
- 49.Engbers EM, Timmer JR, Mouden M, Jager PL, Knollema S, Oostdijk AH, et al. Visual estimation of coronary calcium on computed tomography for attenuation correction. J Cardiovasc Comput Tomogr. 2016;10(4):327–9. doi: 10.1016/j.jcct.2016.04.002. [DOI] [PubMed] [Google Scholar]
- 50.Mylonas I, Kazmi M, Fuller L, deKemp RA, Yam Y, Chen L, et al. Measuring coronary artery calcification using positron emission tomography-computed tomography attenuation correction images. Eur Heart J Cardiovasc Imaging. 2012;13(9):786–92. doi: 10.1093/ehjci/jes079. [DOI] [PubMed] [Google Scholar]
- 51.Einstein AJ, Johnson LL, Bokhari S, Son J, Thompson RC, Bateman TM, et al. Agreement of visual estimation of coronary artery calcium from low-dose CT attenuation correction scans in hybrid PET/CT and SPECT/CT with standard Agatston score. J Am Coll Cardiol. 2010;56(23):1914–21. doi: 10.1016/j.jacc.2010.05.057. [DOI] [PMC free article] [PubMed] [Google Scholar]
- 52*.Isgum I, de Vos BD, Wolterink JM, Dey D, Berman DS, Rubeaux M, et al. Automatic determination of cardiovascular risk by CT attenuation correction maps in Rb-82 PET/CT. J Nucl Cardiol. 2017 doi: 10.1007/s12350-017-0866-3. [DOI] [PMC free article] [PubMed] [Google Scholar]
- 53*.Motwani M, Dey D, Berman DS, Germano G, Achenbach S, Al-Mallah MH, et al. Machine learning for prediction of all-cause mortality in patients with suspected coronary artery disease: a 5-year multicentre prospective registry analysis. Eur Heart J. 2017;38(7):500–7. doi: 10.1093/eurheartj/ehw188. [DOI] [PMC free article] [PubMed] [Google Scholar]
- 54.Kang D, Dey D, Slomka PJ, Arsanjani R, Nakazato R, Ko H, et al. Structured learning algorithm for detection of nonobstructive and obstructive coronary plaque lesions from computed tomography angiography. J Med Imaging (Bellingham) 2015;2(1):014003. doi: 10.1117/1.JMI.2.1.014003. [DOI] [PMC free article] [PubMed] [Google Scholar]
- 55*.Betancur J, Otaki Y, Motwani M, Fish M, Lemley M, Dey D, et al. Prognostic value of combined clinical and myocardial perfusion imaging data using machine learning. JACC Cardiovasc Imaging. 2017 doi: 10.1016/j.jcmg.2017.07.024. In Press. [DOI] [PMC free article] [PubMed] [Google Scholar]
- 56.Ishwaran H, Kogalur UB, Blackstone EH, Lauer MS. Random survival forests. Ann Appl Stat. 2008;2(3):841–60. [Google Scholar]
- 57.Chen Y, Jia Z, Mercola D, Xie X. A gradient boosting algorithm for survival analysis via direct optimization of concordance index. Comput Math Methods Med. 2013;2013:873595. doi: 10.1155/2013/873595. [DOI] [PMC free article] [PubMed] [Google Scholar]
- 58*.Betancur J, Commandeur T, sharir T, Fish M, Ruddy TD, Kaufmann PA, et al. Analysis of raw polar maps from myocardial perfusion SPECT by gender-adjusted deep learning improves automatic prediction of obstructive coronary disease. Journal of Nuclear Cardiology. 2017;24(4):1492–3. Abstract 330-05. [Google Scholar]


