How the actin and microtubule cytoskeletons work together during diverse cellular functions is unclear. Wu et al. describe an apical actin pool in plant cells organized by a microtubule template at the site of polarized growth. Disconnecting the two cytoskeletons by removing class VIII myosins alters both cytoskeletal structures and impairs polarized growth.
Abstract
Coordination between actin and microtubules is important for numerous cellular processes in diverse eukaryotes. In plants, tip-growing cells require actin for cell expansion and microtubules for orientation of cell expansion, but how the two cytoskeletons are linked is an open question. In tip-growing cells of the moss Physcomitrella patens, we show that an actin cluster near the cell apex dictates the direction of rapid cell expansion. Formation of this structure depends on the convergence of microtubules near the cell tip. We discovered that microtubule convergence requires class VIII myosin function, and actin is necessary for myosin VIII–mediated focusing of microtubules. The loss of myosin VIII function affects both networks, indicating functional connections among the three cytoskeletal components. Our data suggest that microtubules direct localization of formins, actin nucleation factors, that generate actin filaments further focusing microtubules, thereby establishing a positive feedback loop ensuring that actin polymerization and cell expansion occur at a defined site resulting in persistent polarized growth.
Introduction
Cross talk between actin and microtubules occurs across eukaryotes and is critical for diverse cellular functions. For example, secretory cargos that alternate on actin and microtubule tracks require precise coordination between the two cytoskeletons for proper secretion (Peñalva et al., 2017). In motile cells, molecules connecting microtubules to actin structures have impacts on cell motility. This is exemplified by spectraplakin, an actin–microtubule cross-linker, that has been shown to promote microtubule growth along stress fibers targeting microtubules to focal adhesions (Wu et al., 2008; Yue et al., 2016). There are factors on the microtubule plus ends stimulating actin nucleation near the focal adhesion, leading to focal adhesion disassembly and triggering cell motility (Juanes et al., 2017). Likewise, in budding yeast, actin-based motors recruited to microtubule plus ends emanating from the nucleus walk along actin filaments to pull the nucleus into the daughter cell (Yin et al., 2000). In other fungi, including filamentous fungi and fission yeast, polarity markers delivered on microtubules toward the cell extremes then promoted actin polymerization and polarized cell expansion (Martin et al., 2005; Martin and Arkowitz, 2014; Takeshita et al., 2014).
One common theme emerging from numerous studies is that long-range microtubule delivery impacts short-range actin-mediated cellular remodeling, thereby providing a mechanism to polarize cells. In plants, a subset of cells, including pollen tubes, root hairs, and moss protonemata, undergo tip growth, an extreme form of polarized cell expansion, where often the cells are 10 times longer than they are wide. Some tip-growing plant cells, such as the lily pollen tube, are also arguably one of the fastest growing cells on the planet. How tip-growing cells maintain persistent polarized cell expansion is an open question (Rounds and Bezanilla, 2013).
Actin is essential for most tip growing cells in plants, since depolymerizing actin filaments completely abolishes growth (Baluška et al., 2000; Vidali et al., 2001; Harries et al., 2005). Additionally, loss of function mutants of many actin-binding proteins also exhibit severe defects, many resulting in very stunted cells (Ringli et al., 2002; Augustine et al., 2008; Vidali et al., 2009b, 2010). While microtubules are generally not essential for tip growth in plants, there is evidence in root hairs and moss protonemata suggesting that microtubules dictate the directionality of growth (Doonan et al., 1988; Bibikova et al., 1999; Sieberer et al., 2005). Compared with loss-of-function mutants of actin-binding proteins, tip-growth phenotypes are usually less severe in mutants of microtubule-associated proteins (Eng and Wasteneys, 2014; Hiwatashi et al., 2014). Nevertheless these studies demonstrate that both actin and microtubules contribute to cell polarity during tip growth. However, how the two cytoskeletons are coordinated has not been investigated.
Moss protonemal cells are an excellent system to study the interplay between actin and microtubules. Actin is essential for tip growth in these cells, and the functional roles of many actin-binding proteins have been characterized (Perroud and Quatrano, 2006; Augustine et al., 2011; van Gisbergen et al., 2012). In protonemata, actin filaments accumulate strongly near the cell apex (Vidali et al., 2009a), where they overlap spatially with class XI myosins and secretory vesicles (Furt et al., 2013), suggesting that the apical actin accumulation is involved in polarized secretion. Cytoplasmic microtubules are oriented along the long axis of the cell body, with their plus ends converging behind the cell apex in a kinesin-dependent manner (Hiwatashi et al., 2014). Pharmacological inhibition of microtubules does not abolish tip growth, but results in cells bending in random directions and often the formation of multiple tips (Doonan et al., 1988). Coordination of actin and microtubules near the cell tip is likely an important aspect of tip growth and cell polarity, but how the two cytoskeletal systems interact has not been investigated.
Class VIII myosins belong to one of two plant-specific myosin gene families. They contain an N-terminal motor domain, followed by four light chain/calmodulin-binding motifs, a coiled-coil region, and a C-terminal region with no obvious conserved motifs. We previously reported that class VIII myosins localize to microtubule plus ends during cytokinesis and guide expansion of the new cell plate by interacting with actin filaments (Wu and Bezanilla, 2014). Besides the cytokinesis defect, we also found that plants lacking all myosin VIII genes grow slower compared with WT, suggesting defects in tip growth (Wu et al., 2011). Here, we investigate the function of myosin VIII and how actin and microtubules coordinate to promote fast and persistent tip growth.
Results
Accumulation of apical actin filaments predicts the direction of cell expansion
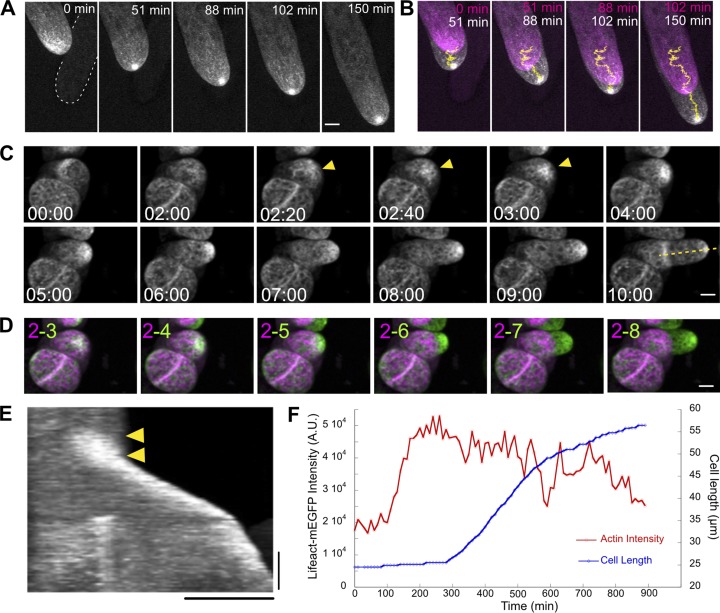
To investigate the significance of the apical actin accumulation during growth, we imaged WT cells expressing the live cell actin probe Lifeact-mEGFP (Vidali et al., 2009a) over the course of a few hours. Under these conditions, we found that the accumulation of actin near the cell apex is present over the whole time course and is very stable in size and shape (Fig. 1 A and Video 1). By merging images from two time points separated by at least 20 min, it is evident that the cell underwent expansion (Fig. 1 B). This particular cell also changed directions several times over the time course (Fig. 1 B), likely due to the presence of another cell in its proximity (Fig. 1 A, white dashed line). We tracked the actin accumulation (Fig. 1 B, yellow trajectory) and compared it to the direction of cell expansion (Fig. 1 B). We found that cell expansion occurs along the trajectory of this actin structure, suggesting that the apical actin structure and cell expansion are closely linked.
Figure 1.
Apical actin cluster predicts the site of cell expansion. (A) A WT cell stably expressing Lifeact-mEGFP. Images are maximum projections of z-stacks acquired every 20 s. Bar, 5 µm. White dashed line outlines a cell in a different focal plane but in proximity to the imaged cell. (B) Images of two time points from the time-lapse acquisition shown in A were merged to show cell expansion. Magenta and white represent earlier and later time points, respectively. Yellow lines represent the trajectories of the actin cluster generated by TrackMate. (C) Actin in WT cells regenerated from protoplasts (See Materials and methods). Actin began to accumulate and increased in intensity (yellow arrowheads) a few hours before cell expansion was apparent. Images are maximum projections of z-stacks acquired every 10 min. Bar, 10 µm. Time stamps represent h:min. (D) Images of two time points from the time-lapse acquisition shown in C were merged to show cell expansion. Magenta and green represent earlier and later time points, respectively. Numbers indicate the time points selected (hours) for the merge. Bar, 10 µm. (E) Kymograph generated from the yellow dashed line in C. The actin signal started to increase (yellow arrowheads) before cell expansion occurred. Bars, 3 h (vertical) and 20 µm (horizontal). (F) From the cell shown in C, mean intensity of Lifeact-mEGFP signal near the cell apex and cell length was plotted against time A.U., arbitrary units. See also Videos 1 and 2 and Fig. S1.
To determine whether actin accumulates before growth or whether the accumulation is a result of the cell geometry, we imaged actin in a round, unpolarized cell and observed tip cell initiation (Fig. 1, C and D; and Video 2). We found that actin began to accumulate a few hours before the tip cell emerged (Fig. 1 C, yellow arrowheads). In a kymograph generated from a line along the growth axis of the emerging tip cell (Fig. 1 C, yellow dashed line), it is evident that the actin signal increased before cell expansion occurred (Fig. 1 E, yellow arrowheads). We also quantified the Lifeact-mEGFP intensity in a circular area (7-µm diameter) near the site of tip emergence. We plotted the Lifeact-mEGFP intensity together with cell length over time. The graph demonstrates that the actin signal steadily increased before the tip emerged (Fig. 1 F and Fig. S1). Among the 49 cells we imaged, actin accumulation can be clearly observed in 34 cells. The angles of the remaining 15 cells prevented us from clearly observing the apical region of the emerging tips; therefore the presence of actin accumulation cannot be determined in these cells. The actin clusters appeared on average 2 ± 1.08 h before the tips emerged. Merging images from two time points revealed that the tip cell emerged from the position where actin accumulated (Fig. 1 D). Overall, these data suggest that apical actin accumulation occurs before polarized cell expansion and its position predicts the direction of growth.
Stable accumulation of apical actin filaments depends on microtubules
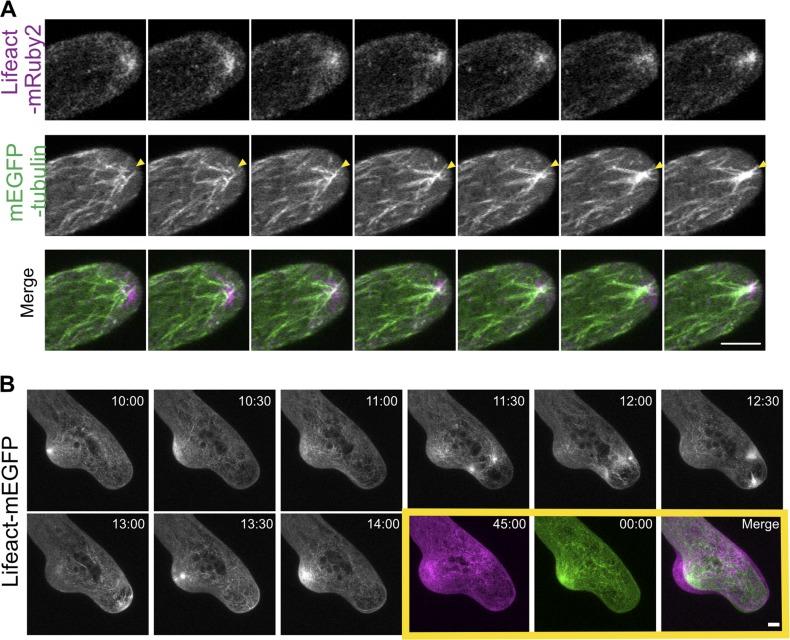
To investigate the nature of the apical actin structure, we imaged growing cells with greater temporal and spatial resolution. We found that the apical actin structure is constantly changing and remodeled in the time scale of seconds. (Fig. 2 A and Video 3). The apparent stability over tens of minutes and hours of a structure that rapidly remodels suggests that generation of the structure may require a stable scaffold. Interestingly, cytoplasmic microtubules, which are more stable than actin filaments, are known to converge near the cell apex (Hiwatashi et al., 2014). Near the cell apex, these microtubules are mostly oriented along the long axis of the cell with their plus ends pointed toward the cell tip (Hiwatashi et al., 2014). Furthermore, when microtubules are disrupted pharmacologically, protonemal cells expand from random positions, resulting in cells bending randomly and often forming multiple tips (Doonan et al., 1988; Fig. S2). Additionally, mutations that affect the convergence of microtubules near the cell apex, such as loss of the kinesin, KINID1, leads to slower growth, with less persistent directionality (Hiwatashi et al., 2014).
Figure 2.
Microtubules are required for maintaining directional growth and the formation of the actin cluster near the cell apex. (A) A WT cell stably expressing mEGFP-tubulin (green) and Lifeact-mRuby2 (magenta). Microtubules coalesce within the actin cluster (yellow arrowheads). Images are single focal planes acquired every 2 s. (B) Actin cytoskeleton was perturbed when microtubules were disrupted. A WT cell expressing Lifeact-mEGFP growing in the presence of 10 µM oryzalin. In the yellow box, the first and the last image from the time lapse movie were merged to show cell expansion. Time stamps represent min:s. Images are maximum projections of z-stacks acquired every 30 s. Bars, 5 µm. See also Videos 3 and 4.
To investigate whether the convergence of cytoplasmic microtubules coincides with the apical actin accumulation, we imaged WT cells expressing mEGFP-tubulin and Lifeact-mRuby2. We observed microtubules coalescing in the central apical region, and the convergence of these microtubules overlapped with the apical actin cluster (Fig. 2 A and Video 3). These data suggest that actin and microtubules may interact near the cell apex and that their coordination may contribute to polarized cell expansion.
To test whether the overlapping localization of microtubule convergence and apical actin cluster has functional significance in cell growth, we treated cells with 10 µM oryzalin, a microtubule-depolymerizing drug and discovered that actin organization was dramatically altered, with aberrant actin bundles moving throughout the cell. Bursts of actin randomly appear throughout the cell instead of steadily associating near the tip (Fig. 2 B and Video 4). Merging the first and the last frame of the time-lapse movies reveals that cell growth still occurred under this condition, but cell expansion was no longer restricted to the cell apex (Fig. 2 B, yellow boxes). These data suggest that microtubules contribute to determining the site of actin accumulation and are consistent with the observation that the site of actin accumulation correlates with cell expansion.
Microtubules confine class II formins and the actin cluster to the cell apex
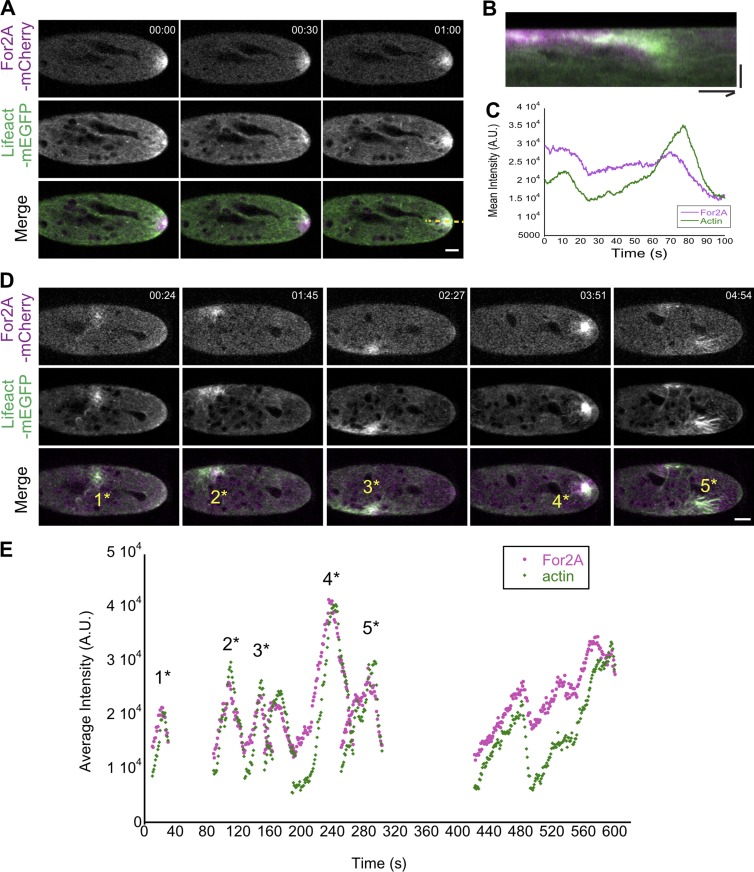
To generate the apical actin structure, it is likely that an actin polymerizing factor is specifically recruited to the cell apex. The actin nucleator, class II formin, which is essential for tip growth in moss (Vidali et al., 2009b), is enriched at the cell apex and the cell cortex where it generates actin filaments (van Gisbergen et al., 2012). Moss has two functionally redundant class II formin genes (Vidali et al., 2009b). To investigate whether class II formin localization depends on microtubules, we tagged one of the class II formins at its endogenous locus with three tandem repeats of mCherry (hereafter referred to as For2A-mCherry) in a WT moss line stably expressing Lifeact-mEGFP. As reported previously for For2A-mEGFP (Vidali et al., 2009b), For2A-mCherry is enriched near the cell apex and its intensity fluctuated (Fig. 3 A and Video 5). In kymographs generated along a line parallel to the direction of growth and transecting the actin cluster (Fig. 3 B), it is apparent that increased For2A-mCherry fluorescence precedes a burst in the Lifeact-mEGFP signal. Not surprisingly, when we tracked a 5-µm diameter circle near the cell tip and quantified the intensity of For2A-mCherry and Lifeact-mEGFP signals, we found that the For2A-mCherry signal peaks before the Lifeact-mEGFP signal (Fig. 3 C), suggesting that For2A contributes to the generation of the actin filaments within the cluster.
Figure 3.
Microtubules confine class II formins and the actin cluster to the cell apex. (A) A WT cell expressing Lifeact-mEGFP (green) and For2A-mCherry (magenta). Images are single focal planes acquired every 0.27 s. Bar, 5 µm. (B) Kymograph generated from the time lapse acquisition shown in A along the yellow dashed line. Bars, 5 µm (vertical) and 20 s (horizontal). (C) A 5-µm diameter circle near the cell tip was tracked using TrackMate, and the mean intensity of Lifeact-mEGFP and For2A-mCherry signals over time are shown in the plot. (D) The same cell in A after 12.5 µM oryzalin was added to the microfluidic device. Images are single focal planes acquired every second. Bar, 5 µm. (E) Foci enriched with For2A-mCherry were tracked using TrackMate and the mean intensity of Lifeact-mEGFP and For2A-mCherry signals were plotted over time. Numbers above the peaks in the plot correspond to the bursts of actin polymerization indicated in D. Time stamps represent min:s. A.U., arbitrary units. See also Video 5.
To test whether For2A-mCherry localization depends on microtubules, we continued to observe the same cell in Fig. 3 A after oryzalin was added to the microfluidic imaging device. Within minutes, the For2A and actin apical accumulations disappeared. Instead, stochastic bursts of actin clusters and waves of long actin bundles formed inside the cell (Fig. 3 D). These abnormal actin accumulations were preceded by a local increase in the For2A-mCherry signal (Fig. 3 D and Video 5). This was quantified by tracking independently emerging foci enriched with For2A-mCherry signals and plotting the intensity of both For2A-mCherry and Lifeact-GFP over time (Fig. 3 E, numbers above the peaks in the plot correspond to the bursts of actin polymerization indicated in Fig. 3 D). From these data, we found that For2A-mCherry signals still peak before the Lifeact-mEGFP signal in the aberrant stochastic actin bursts, suggesting that the cytoplasmic microtubules converging with their plus ends near the cell apex are required for the proper distribution of For2A. When For2A is mislocalized, it generates abnormal actin structures inside the cell, leading to randomized sites of cell expansion as observed in Fig. 2 B.
Myosin VIII overlaps with converging microtubules and the actin cluster near the cell apex
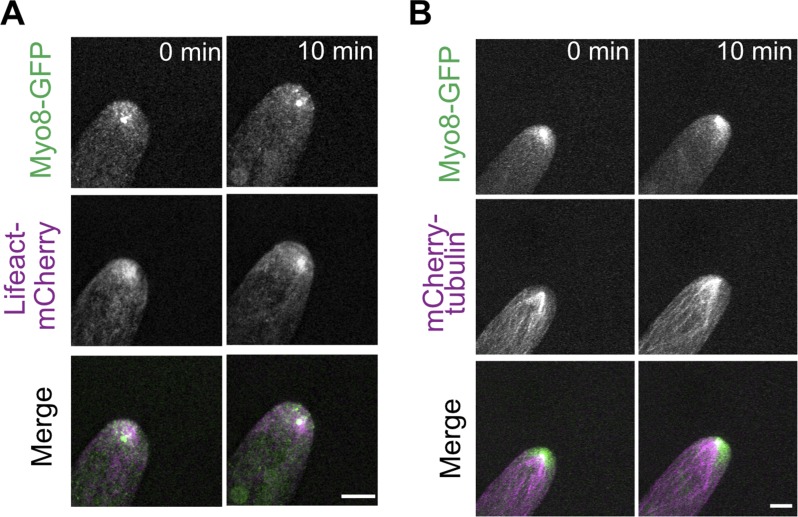
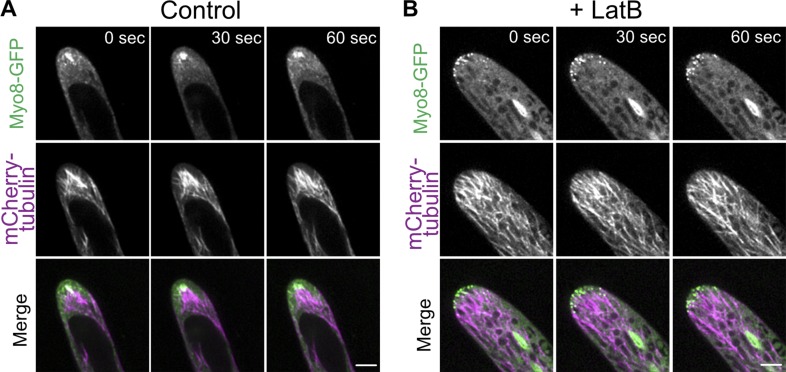
To investigate the factors involved in coordinating actin and microtubules near the cell apex, we analyzed the localization of a class VIII myosin, which was reported to associate with microtubule plus ends and actin filaments during cell division to guide phragmoplast expansion (Wu and Bezanilla, 2014). Taking advantage of a well-characterized line that contains a single functional myosin VIII gene tagged with three tandem repeats of mEGFP (hereafter referred to as Myo8A-GFP), we investigated the relationship between Myo8A-GFP and microtubules or actin by imaging transgenic lines with microtubule or actin markers in the Myo8A-GFP background (Wu and Bezanilla, 2014). Live-cell imaging of Myo8A-GFP and Lifeact-mCherry showed that Myo8A-GFP accumulates near the cell apex, overlapping with the apical actin cluster (Fig. 4 A and Video 6). Imaging Myo8A-GFP together with microtubules labeled with mCherry-tubulin also showed that the Myo8A accumulation coincides with the converging microtubules near the cell apex (Fig. 4 B and Video 6). In the absence of actin, we noticed that microtubules near the cell apex no longer coalesced into a focused point (Fig. 5 B and Video 7). Depolymerizing the actin cytoskeleton reduced the clustering of microtubules and Myo8A-GFP, and Myo8A-GFP in the apical domain solely tracked microtubule ends (Fig. 5 B and Video 7). Taken together these data suggest that myosin VIII associates with microtubule ends independent of actin, but requires actin to converge microtubules near the cell apex.
Figure 4.
Myosin VIII accumulates near the cell tip overlapping with converging microtubules and the actin cluster. (A) A cell expressing Myo8A-GFP (green) and Lifeact-mCherry (magenta). (B) A cell expressing Myo8A-GFP (green) and mCherry-tubulin (magenta). Images are maximum projection of z-stacks acquired every 15 s. Bars, 5 µm. See also Video 6.
Figure 5.
Actin is required to maintain the microtubule focus near the cell apex. (A) A cell expressing Myo8A-GFP (green) and mCherry-tubulin (magenta). (B) The same line as in A imaged in the presence of 25 µM latrunculin B. Images are single focal planes acquired every 2 s. Bars, 5 µm. See also Video 7.
Myosin VIII function affects both actin and microtubule cytoskeletons
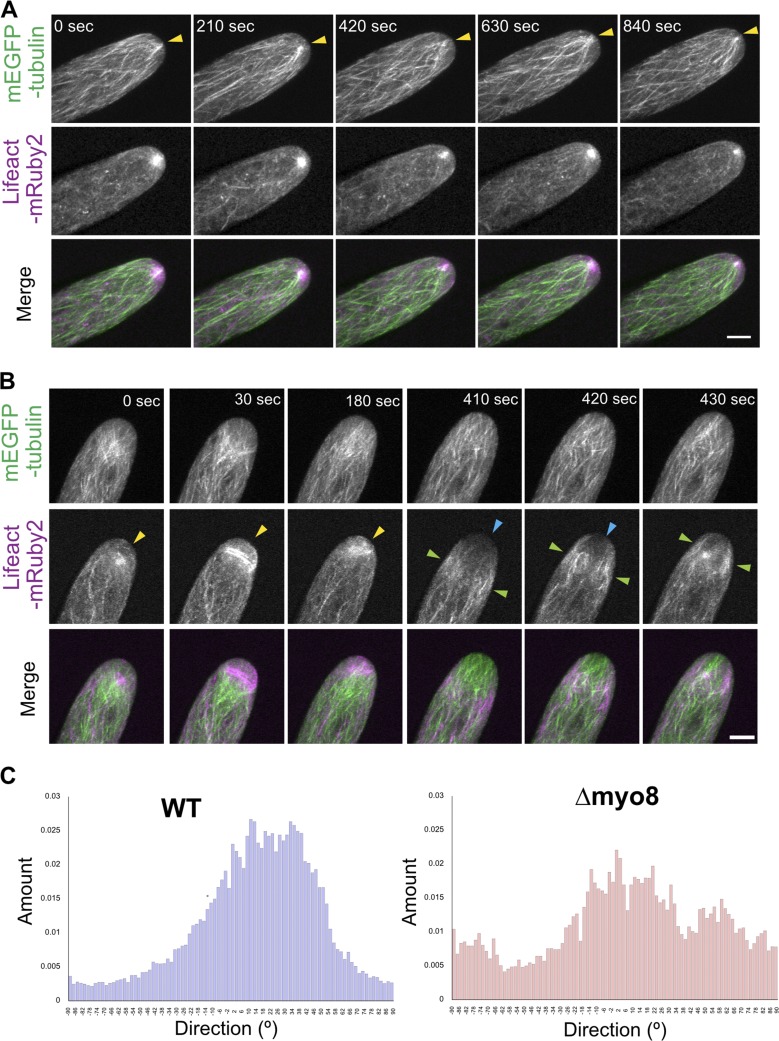
If the activity of Myo8A-GFP coordinates the microtubule and actin cytoskeletons near the cell apex, then we would predict that the lack of myosin VIII would affect both actin and microtubule structures. To test this, we imaged microtubules and actin in WT and a line that lacks all five class VIII myosins (Δmyo8; Wu et al., 2011). In WT cells, microtubules converge at the cell tip intersecting the apical actin cluster. Microtubules remain associated with the actin cluster over the course of tens of minutes in actively growing cells (Fig. 6 A and Video 8). In contrast, in Δmyo8 cells, both actin and microtubule structures are altered. The apical actin accumulation was no longer stable in size and shape, and the microtubules were observed to spread-out near the cell apex (Fig. 6 B and Video 8). In Δmyo8 cells, large actin accumulations were observed near the cell tip (Fig. 6 B, yellow arrowheads). When this actin accumulation disappeared, the cells often underwent a period of time with very little actin at the tip (Fig. 6 B, blue arrowheads). In addition, large actin bundles were observed moving throughout the cell body (Fig. 6 B, green arrowheads), reminiscent of the actin bundles observed in WT cells depleted of microtubules (Fig. 2 B). With respect to microtubules, we quantified the degree to which microtubules focused near the cell apex using the ImageJ plugin Directionality. The plugin generates a histogram representing the number of structures within an image in a given orientation. We found that in WT, there is one major peak around the direction of the long axis of the cell. However, in Δmyo8 cells, the histogram spreads out over a larger range, indicating that microtubules in Δmyo8 cells exhibit a wider variety of orientations. These observations demonstrate that removing myosin VIII reduced the convergence of microtubules near the cell apex, which is actin-dependent (Fig. 5 B). Lack of myosin VIII also altered the accumulation of apical actin cluster, which is influenced by the microtubule organization (Fig. 2 B). Overall, these data suggest a functional link between myosin VIII, actin and microtubules.
Figure 6.
Myosin VIII is required for maintaining both apical actin and microtubule structures. (A) A WT cell stably expressing mEGFP-tubulin (green) and Lifeact-mRuby2 (magenta). Images are maximum projections of z-stacks acquired every 15 s. (B) A Δmyo8 cell expressing mEGFP-tubulin (green) and Lifeact-mRuby2 (magenta). Yellow arrowheads, abnormal apical actin accumulation. Blue arrowheads, very low actin abundance near the cell apex. Green arrowheads, waves of actin bundles migrating throughout the cell body. Images are maximum projections of z-stacks acquired every 10 s. Bars, 5 µm. See also Video 8. (C) Microtubule orientations are quantified from selected frames in A and B using the ImageJ plugin Directionality. The histograms represent the number of structures within an image in a given orientation.
Myosin VIII restricts For2A activity
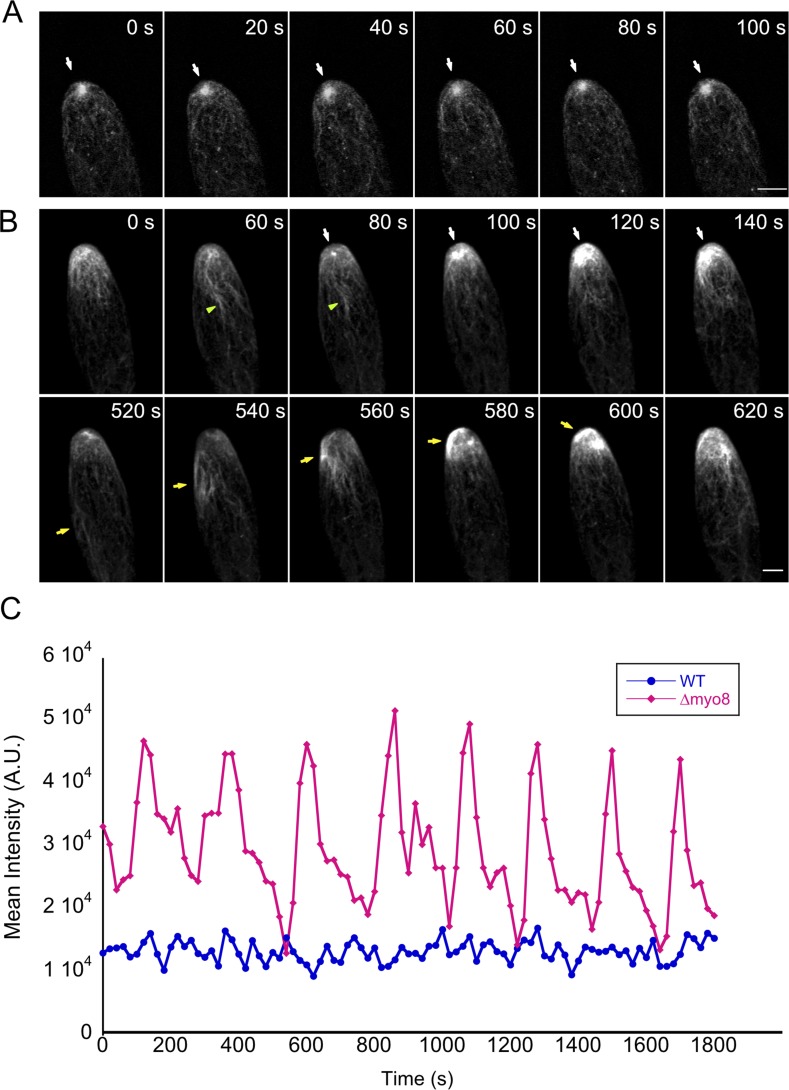
In cells lacking myosin VIII, microtubules were no longer focused and the apical actin structure no longer persistently localized to the cell apex. Detailed analysis of the actin structures in Δmyo8 versus WT cells revealed that beyond forming randomly throughout the cell, the actin structures in Δmyo8 exhibited structural alterations consistent with changes in dynamics of actin formation. In WT cells, the size and shape of the actin cluster was relatively stable over time (Fig. 7 A, white arrows; Video 9; and Fig. S3). Furthermore, the fluctuation of Lifeact-mEGFP intensity was rapid and occurred in a narrow range (Fig. 7 C, blue line; and Fig. S3). In contrast, the size of the actin cluster in Δmyo8 cells varied significantly over time (Fig. 7 B, white arrows; Video 9; and Fig. S4), as evidenced by the intensity plot, which shows a much higher deviation in intensity and slower fluctuations (Fig. 7 C, red line; and Fig. S4). We also observed more and longer actin bundles emanating from the actin cluster near the tip (Fig. 7 B, green arrowheads) and in the wave of actin bundles migrating toward the cell apex (Fig. 7 B, yellow arrows). These dramatic alterations in the nature of the actin cluster hints at a higher activity of actin polymerization in Δmyo8 cells.
Figure 7.
Loss of myosin VIII enhances actin filament formation. (A) A WT cell expressing Lifeact-mEGFP. White arrows point to the apical actin cluster. (B) A Δmyo8 mutant cell expressing Lifeact-mEGFP. White arrows point to an actin cluster forming and increasing in size over time. Green arrowheads indicate long actin bundles, which are more prevalent in Δmyo8 cells. Yellow arrows point to a group of long actin bundles migrating toward the cell apex. Images are maximum projections of z-stack acquired every 20 s. Bars, 5 µm. (C) From time-lapse acquisitions shown in A and B, a 7-µm diameter circle near the cell apex was tracked using TrackMate, and the mean intensity of Lifeact-mEGFP signal was plotted over time. A.U., arbitrary units. See also Video 9, Fig. S3, and Fig. S4.
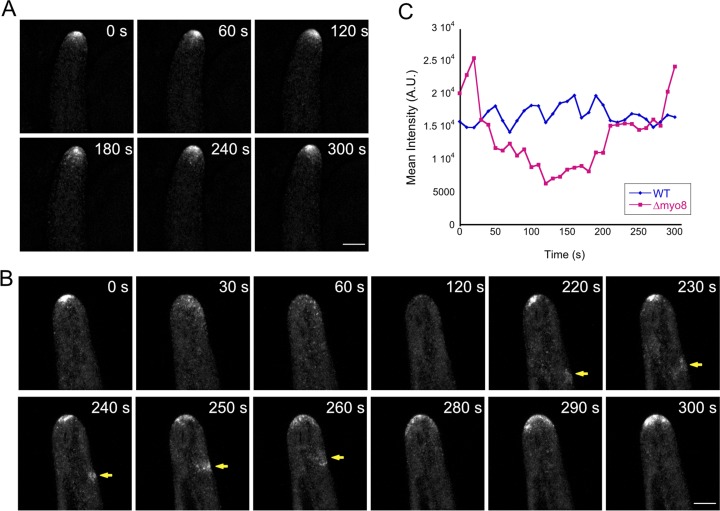
We reasoned that aberrant actin polymerization was likely due to defects in For2A activity and/or localization. To test this, we tagged For2A with three tandem-repeats of mEGFP at the endogenous locus (hereafter referred to as For2A-GFP) in the Δmyo8 background and observed its localization using confocal microscopy. We found that For2A still accumulated near the cell apex, but the accumulation was less persistent compared with WT (Fig. 8, A and B; Video 10; and Fig. S6). By comparing the fluctuation of For2A-GFP intensity in WT and Δmyo8 cells, we found that For2A-GFP intensity fluctuates over a much wider range and undergoes long periods of time with very low signal in Δmyo8 as compared with WT. In contrast, For2A-GFP levels in WT remained very stable and fluctuated over a narrow range (Fig. 8 C and Fig. S5). We also observed waves of For2A-GFP moving toward the cell tip in Δmyo8 cells (Fig. 8 B, yellow arrows), likely generating actin waves as observed in Fig. 7.
Figure 8.
Loss of myosin VIII affects For2A distribution. (A) A WT cell expressing For2A-GFP. (B) A Δmyo8 cell expressing For2A-GFP. Yellow arrows point to waves of For2A-GFP moving from the back toward the tip of the cell. Images are maximum projections of z-stacks acquired every 10 s. Bars, 5 µm. (C) From time-lapse acquisitions shown in A and B, a 5-µm diameter circle near the cell tip was tracked using TrackMate, and the mean intensity of For2A-GFP signal was plotted over time. A.U., arbitrary units. See also Video 10, Fig. S5, and Fig. S6.
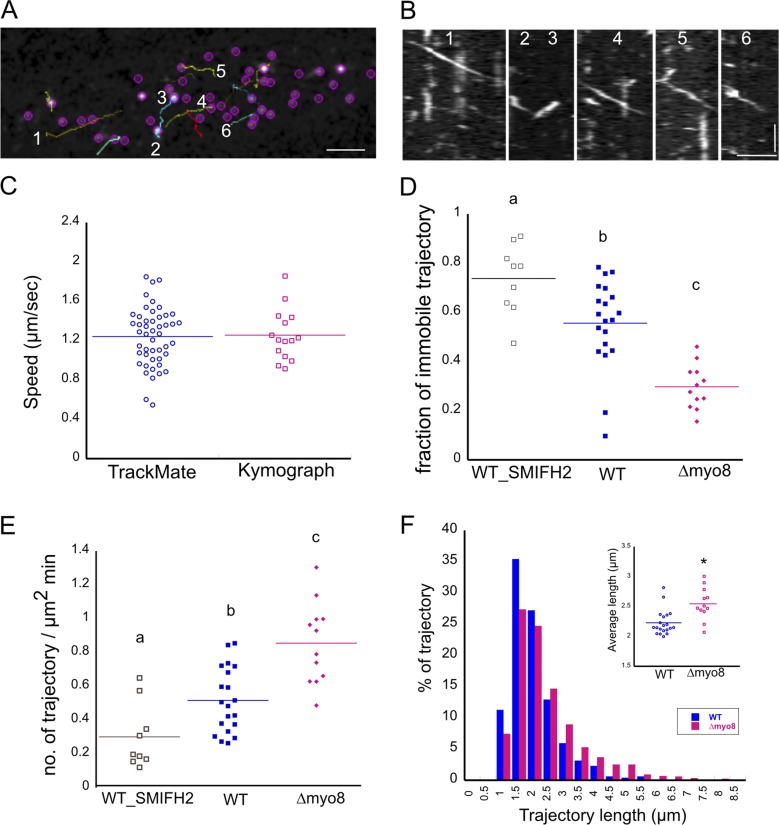
To test if For2A activity is enhanced in Δmyo8 cells, we measured cortical For2A-GFP activity. For2A generates actin filaments at the cell cortex, which can be observed using variable angle epifluorescence microscopy (VAEM; van Gisbergen et al., 2012). Cortical For2A-GFP appears as bright particles and when a particle generates an actin filament, it moves in a linear trajectory. Therefore, we tracked and quantified For2A-GFP trajectories in WT and Δmyo8 cells. Particle tracking identified linear trajectories that could be validated by kymograph analysis (Fig. 9, A–C). The velocities of these particles were consistent with For2A particle velocity previously reported (van Gisbergen et al., 2012). We also observed a fraction of For2A-GFP particles that are immobile as described previously (van Gisbergen et al., 2012). Treating WT cells with the formin inhibitor SMIFH2 increased the immobile fraction and reduced linear trajectory density (Fig. 9, D and E). Together these lines of evidence suggest that the parameters used in TrackMate identified bonafide For2A-GFP trajectories, which in turn were a suitable readout for formin activity.
Figure 9.
For2A activity is elevated in Δmyo8 cells. For2A-GFP particles were imaged in WT and Δmyo8 cells with VAEM. Particles were tracked with TrackMate. (A) A snap shot from the tracking results. Colored lines are trajectories identified by TrackMate. Bar, 2 µm. (B) Kymographs generated from colored lines in A. Bars, 2 µm (horizontal) and 2 s (vertical). (C) Particle speeds calculated from tracking results were compared with particle speeds measured from kymograph analysis. (D and E) Fraction of immobile For2A-GFP trajectories (D) and the number of linear trajectories per µm2 per minute (E) is plotted for WT cells, WT cells treated with 25 µM formin inhibitor SMIFH2, and Δmyo8 cells. Letters a, b, and c indicate statistical groups with α < 0.05 from an ANOVA analysis. (F) Histograms of trajectory length comparing WT and Δmyo8 cells. Data are cumulative from 20 WT cells and 12 Δmyo8 cells. Total trajectories: 960 (WT) and 876 (Δmyo8). Inset, average trajectory length from each cell. The asterisk (*) indicates statistical significance with α < 0.05 from an ANOVA analysis.
By comparing trajectory densities in WT and Δmyo8 cells, we found that the average linear trajectory density was higher and the immobile fraction of For2A-GFP was reduced in Δmyo8 cells (Fig. 9, D and E), suggesting that For2A is more active in these cells. We also plotted the trajectory lengths and found that in Δmyo8 cells For2A trajectories were longer (Fig. 9 F). These data suggest that For2A generates more and longer actin filaments in Δmyo8, which is consistent with the alterations in the formation of the actin clusters observed in the cytoplasm.
Discussion
Here we show that a cluster of actin filaments, which rapidly remodels on the scale of seconds, is continuously generated near the cell tip during growth and that the location of this cluster is tightly coupled to the direction of cell expansion. We also found that maintenance of the size and apical position of the actin cluster requires a population of cytoplasmic microtubules whose plus ends converge just below the actin accumulation. Perturbations that disrupt this population of microtubules dramatically alter the dynamics of the actin cluster and result in defects in cell expansion, demonstrating that tight coupling between the microtubule and actin cytoskeletons is required to steer polarized growth. Using a combination of live cell imaging and molecular genetics, we investigated the factors that are responsible for generating the apical actin cluster, as well as the link between microtubules and actin.
We found that the formation of the apical actin cluster depends at least partially on class II formins. Importantly, microtubules are required for the proper distribution of these formins in WT cells. Interestingly, formins from other organisms have been shown to directly interact with microtubules, and some have been shown to generate actin filaments from microtubule plus ends (Breitsprecher et al., 2012; Henty-Ridilla et al., 2016). However, in moss protonemal cells, the localization of For2A is not consistent with an association with microtubules. In particular, the accumulation of For2A-GFP near the cell apex does not appear to be on microtubule ends (Fig. S2 A), which is in contrast to the localization of Myo8A-GFP (Fig 5). In the absence of actin, For2A-GFP no longer accumulates at the cell apex, and there is no evident enrichment of For2A-GFP on microtubule ends (Fig. S2 A), which is in contrast to what we observed for Myo8A-GFP (Fig. 5 B). Furthermore, both For2A-GFP and Myo8A-GFP accumulate in the phragmoplast midzone enriches with microtubule plus ends during cell division (Fig. S2 B). However, unlike Myo8A-GFP, which remains associated with microtubules upon latrunculin B treatment (Wu and Bezanilla, 2014), the For2A-GFP signal at the phragmoplast is greatly reduced in the absence of actin. These data suggest that For2A is unlikely to directly associate with or to be transported on microtubules. Thus, how microtubules affect the distribution of class II formins and the formation of the actin cluster is not entirely clear. It is known that a large fraction of class II formins is on the plasma membrane likely due to their ability to bind PI(3,5)P2. Class II formins also colocalize with membranes labeled with the styryl dye FM4-64, which are endocytosed at the cell apex (van Gisbergen et al., 2012). Therefore, it is possible that microtubules deliver factors to the tip that promote membrane internalization and thus trafficking of class II formins or alternatively factors that activate the actin polymerization activity of the formins. Thus, a local enrichment of active class II formins would generate the actin cluster.
In the absence of microtubules, the actin cluster formation is dramatically altered. Actin foci form stochastically throughout the cell and as a result cells expand randomly, which leads to tortuous growth instead of persistently straight growth and in some cases growth from multiple sites resulting in cell forking. Interestingly, the convergence of microtubule plus ends below the actin cluster, which is in part mediated by the kinesin, KINID1, also plays a pivotal role in tip growth, as cells that lack KINID1 have unfocused microtubules and grow slowly and less persistently straight (Hiwatashi et al., 2014). Here we show that the microtubule convergence also requires myosin VIII and actin filaments. Similar to what was reported for the mutants lacking KINID1, Δmyo8 cells grow more slowly and tend to grow less straight, particularly in nutrient limiting conditions (Wu et al., 2011).
Here, we find that the tip growth phenotypes in Δmyo8 can be explained by defects in both microtubule and actin structures. In Δmyo8 cells the connection between the actin cluster and the microtubule convergence is broken. As a result, the microtubules no longer focus but are still present and their plus ends are oriented toward the apex of the cell. Because of the correct orientation, factors that activate class II formins are likely still accumulated at the cell tip. However, the absence of the focused microtubules impacts the dynamics and localization of class II formins and thus the behavior of actin. In WT cells, For2A accumulates in the cytoplasm near the cell apex, where its intensity oscillates over a very narrow range over time. However, in Δmyo8 cells, the formin apical accumulation destabilizes, possibly due to the lack of microtubule convergence altering the rate of active formin accumulation. Destabilizing the apical active formin accumulation results in long periods of time with very little formin at the tip and subsequently low actin abundance.
Interestingly, in Δmyo8 cells, the apical actin accumulation intensity also fluctuates in a much wider range than in WT, suggesting more actin filaments are being generated in these structures. Δmyo8 cells also exhibit more prominent long actin bundles that migrate along the cell cortex. Generating larger actin structures and long actin bundles along the cell cortex suggests that there is more formin activity in Δmyo8 cells. We tested this by tracking For2A particles at the cell cortex. For2A particles generating actin filaments move in linear tracks. Thus, the number of linear tracks is a good measure of formin activity. Surprisingly, we found more and longer For2A trajectories in Δmyo8 cells, suggesting higher For2A activity in this mutant. These results can explain the chaotic actin behavior we observed in Δmyo8 cells. Elevated For2A activity leads to more and longer actin filaments generated in the apical actin accumulation and at the cell cortex, which leads to slower turnover of the actin structure. How myosin VIII restricts For2A activity is unclear. However, a recent report showed that the formin homology 1 domain of the fission yeast formin, Cdc12p, senses the mechanical state of the actin filaments it is bound to. In this study, when myosin II pulled on actin filaments bound to Cdc12p, the tension across the actin filament was sensed by the formin and led to dissociation of the formin from the actin filaments (Zimmermann et al., 2017). It will be interesting to test whether a similar mechanism may be at play in the apical actin accumulation between myosin VIII and class II formins.
Our data provide evidence that convergence of forward-oriented microtubules confine the distribution and activity of class II formin and hence the formation of an actin cluster to the tip region. The actin cluster in turn restricts the site of cell expansion and ensures growth in a persistent direction. Myosin VIII function connects the microtubule convergence with the apical actin cluster. Similar to its behavior during cell division, myosin VIII associates with microtubule plus ends near the cell tip independent of actin filaments (Wu and Bezanilla, 2014). However, it requires actin filaments to coalesce the microtubule plus ends connecting them to the actin cluster. There are striking parallels between moss protonemata and filamentous fungi. In Aspergillus nidulans, microtubule plus ends interact with a class V myosin MyoE via MigA, a plus-end microtubule binding protein. Lack of MigA uncouples the two networks and affects the positions of cell-end markers and the direction of growth (Manck et al., 2015). Genetic and cell biological studies suggest that microtubules plus ends are likely captured by MyoE and pulled along actin filaments at the cell tip in an actin-rich structure known as the Spitzenkörper, which is highly reminiscent of the actin cluster in moss protonemal cells. Similar to filamentous fungi, since the formation of the actin cluster is influenced by microtubules, this potentially establishes a positive feedback loop to ensure actin polymerization and cell expansion do not deviate from the center of the cell apex too much over time.
As exemplified in moss protonemata and filamentous fungi, coordination between microtubules, as long-range cellular rulers, and actin filaments, as short-range cellular remodelers, is observed in diverse cell types, including many animal cells. Here we have found a similar mechanism in plant cells, suggesting that microtubule-actin cross talk may be a feature of the vast majority of eukaryotic cells. While the scale of these interactions varies between systems, from single microtubules in yeasts to hundreds of microtubules in a neuron, the underlying architecture of microtubules steering actin-based processes emerges as a striking similarity across all these systems. With a single actin structure controlled by a relatively small number of microtubules, yet large enough to be imaged at high temporal and spatial resolution, moss protonemal cells are uniquely positioned to contribute mechanistic insights into the coordination between microtubules and actin. While the exact proteins involved may differ among diverse systems, similarities in protein function, rather than sequence, will likely emerge by investigating the parallel mechanisms regulating microtubule–actin interactions present in diverse eukaryotes.
Materials and methods
Plasmid construction
All expression constructs were constructed using Multisite Gateway recombination (Invitrogen). The construction of the destination vectors pTKUBI-gate and pTZUBI-gate was described in Wu and Bezanilla (2014). The For2A-3XmCherry tagging construct was generated with the same strategy as For2A-3XmEGFP as described in Vidali et al. (2009b), with the modification that the 3XmCherry-L5L4 entry clone was used in the LR clonase II plus reaction instead of the 3XmEGFP-L5L4. pTZUBI-Lifeact-mRuby2 and pTKUbi-Lifeact-mEGFP were generated using the same strategy described in Vidali et al. (2009a).
Plant material and growth conditions
All moss tissue culture, protoplasting, transformation, and isolation of stable transgenic lines were performed as described previously (Wu et al., 2011; Wu and Bezanilla, 2014). Moss protonemal tissue was propagated weekly on PpNH4 medium (1.03 mM MgSO4, 1.86 mM KH2PO4, 3.3 mM Ca(NO3)2, 2.7 mM (NH4)2-tartrate, 45 µM FeSO4, 9.93 µM H3BO3, 220 nM CuSO4, 1.966 µM MnCl2, 231 nM CoCl2, 191 nM ZnSO4, 169 nM KI, and 103 nM Na2MoO4) containing 0.7% agar.
For confocal imaging, moss protonemal tissue was grown in microfluidic imaging device as described in Bascom et al. (2016). The imaging device is filled with half-strength Hoagland’s medium (4 mM KNO3, 2 mM KH2PO4, 1 mM Ca(NO3)2, 89 µM Fe citrate, 300 µM MgSO4, 9.93 µM H3BO3, 220 nM CuSO4, 1.966 µM MnCl2, 231 nM CoCl2, 191 nM ZnSO4, 169 nM KI, and 103 nM Na2MoO4) and kept at room temperature on the bench top with overhead fluorescent lights. For VAEM imaging, 1-wk-old protonemal tissue was protoplasted and allowed to regenerate into individual plants. 6–8-d-old plants regenerated from protoplasts were placed onto an agar pad in Hoagland’s, covered by a glass coverslip and sealed with VALAP (1:1:1 parts of Vaseline, lanoline, and paraffin) before imaged as described in Wu and Bezanilla (2014).
For imaging tip cells emerging from unpolarized cells, protoplasts were regenerated on plates containing protoplast regeneration medium (PpNH4 medium supplemented with 8.5% mannitol and 10 mM CaCl2) for 4 d then transferred to pPNH4 containing 12.5 µM Latrunculin B for another 1–2 d. Protoplasts were then collected and load into microfluidic device filled with half-strength Hoagland’s medium, and immediately put on the microscope for imaging.
Moss transgenic lines
The pTZUBI-Lifeact-mRuby2 construct was transformed into the mEGFP-tubulin lines in the WT and Δmyo8 backgrounds (Wu and Bezanilla, 2014) to generate the actin/microtubule dual labeled lines. The For2A-3xmCherry tagging construct was transformed into the Lifeact-mEGFP line in the WT background (Vidali et al., 2009a) to generate For2A/actin dual labeled line. The For2A-3xmEGFP tagging construct (Vidali et al., 2009b) was transformed into Δmyo8 (Wu et al., 2011) to generate the For2A-GFP/Δmyo8 line. The pTKUBI-Lifeact-mEGFP construct was transformed into Δmyo8 (Wu et al., 2011) to generate the actin labeled line in the Δmyo8 background. Generation of the following lines was described previously: Lifeact-mEGFP (Vidali et al., 2009a), Myo8A-GFP/Lifeact-mCherry (Wu and Bezanilla, 2014), Myo8A-GFP/mCherry-tubulin (Wu and Bezanilla, 2014), and For2A-GFP (Vidali et al., 2009b).
Laser-scanning confocal microscopy
Images for each channel were acquired simultaneously on a Nikon A1R confocal microscope system with a 1.49 NA 60× oil immersion objective (Apo TIRF 60× Oil DIC N2; Nikon) at room temperature. 488- and 561-nm laser illumination was used for GFP and mRuby2/mCherry excitation, respectively. Emission filters were 525/50 nm for GFP and 595/50 nm for mCherry/mRuby2. Image acquisition was controlled by NIS-Elements software (Nikon).
Spinning-disc confocal imaging
The samples were mounted on an inverted microscope (Ti-E; Nikon) equipped with a Yokogawa spinning disk head (CSU-X1) and a 512 × 512 electron multiplying charge-coupled device camera (iXON; Andor Technology). Images for each channel were collected sequentially with a 1.4 NA 100× oil immersion objective (Nikon) at room temperature. 488- and 561-nm laser illumination was used for GFP and mCherry excitation, respectively. Emission filters were 515/30 nm for GFP and 600/32 nm for mCherry.
VAEM
Samples were mounted on an inverted microscope (Ti-E; Nikon) equipped with a mirror-based T-FL-TIRF illuminator (Nikon) and imaged with a 1.49 NA 100× oil immersion TIRF objective (Apo TIRF 100× Oil DIC N2). 488-nm laser illumination was used for mEGFP excitation. The laser illumination angle was adjusted individually for each sample to achieve the maximum signal-to-noise ratio. Images were captured with an sCMOS camera (Andor Zyla VSC-01746). Emission filters were 525/50 nm for GFP. Image acquisition process was controlled by NIS-Elements AR software (Nikon).
Imaging processing
All images were processed using Fiji. Enhance contrast (0.1–0.3%), background subtraction (rolling ball radius 10–20 for VAEM images and 50–70 for confocal images) and smoothing were applied to the whole image when used.
Particle tracking of For2A-GFP
For2A-GFP particles at the cell cortex were imaged with VAEM every 100 ms for 1 min. Images were processed before tracking. Particle tracking was performed with the Fiji plugin TrackMate (Tinevez et al., 2017). LoG detector (estimate blob diameter, 0.4 µm); linear motion LAP tracker (initial search radius, 0.5 µm; search radius, 0.5 µm; max frame gap, 0). The filters on tracks were set as follows: duration, >1s; max distance traveled, >1 µm; linearity of forward progression, >0.5. Trajectory length is total distance traveled. Speed is total_distance_traveled/track_duration. Trajectory with duration >3 s and max distance traveled <0.5 µm is defined as immobile. Fraction of immobile For2A trajectory is number of immobile trajectories divided by number of total trajectories (linear + immobile). Tracking of cytosolic For2A and Lifeact signals was performed similarly, except a blob diameter of 5–7 µm was used in this case.
Online supplemental material
Fig. S1, shows three examples of actin accumulation during the process of tip cell emergence from protoplasts. Fig. S2 shows WT cells growing in the presence of microtubule-depolymerizing drug oryzalin. Fig. S3 shows three examples of apical actin accumulation in growing WT cells. Fig. S4 shows three examples of apical actin accumulation in growing Δmyo8 cells. Fig. S5 shows three examples of For2A-GFP apical accumulation in WT cells. Fig. S6 shows three examples of For2A-GFP apical accumulation in Δmyo8 cells. Fig. S7 shows For2A-GFP localization with respect to microtubules in the absence or presence of actin. Video 1 is a time lapse video showing apical actin accumulation in a growing WT cell. Video 2 is a time lapse video showing actin accumulation during tip cell emergence from a protoplast. Video 3 is a time lapse video showing actin and microtubules in a growing WT cell. Video 4 is a time lapse video showing actin in a WT cell treated with oryzalin. Video 5 is a time lapse video showing actin and For2A in a WT cell before and after oryzalin treatment. Video 6 is a time lapse video showing Myo8A-GFP localization with respect to actin and microtubules. Video 7 is a time lapse video showing Myo8A-GFP and microtubules with or without latrunculin B treatment. Video 8 is a time lapse video showing actin and microtubules in WT and Δmyo8 cells. Video 9 is a time lapse video showing actin in WT and Δmyo8 cells. Video 10 is a time lapse video showing For2A-GFP in WT and Δmyo8 cells.
Supplementary Material
Acknowledgments
We thank the University of Massachusetts Amherst Microscopy Facility and Nikon Instruments for expert advice on imaging methodologies. We thank John Oakey and his laboratory members for providing microfluidic imaging chambers.
This work is supported by National Science Foundation grants awarded to M. Bezanilla (MCB-1715785 and MCB-1330171)
The authors declare no competing financial interests.
Author contributions: S-Z. Wu is responsible for conception and design, acquisition of data, analysis and interpretation of data, and drafting and revising the article. M. Bezanilla is responsible for conception and design, interpretation of data, and drafting and revising the article.
References
- Augustine R.C., Vidali L., Kleinman K.P., and Bezanilla M.. 2008. Actin depolymerizing factor is essential for viability in plants, and its phosphoregulation is important for tip growth. Plant J. 54:863–875. 10.1111/j.1365-313X.2008.03451.x [DOI] [PubMed] [Google Scholar]
- Augustine R.C., Pattavina K.A., Tüzel E., Vidali L., and Bezanilla M.. 2011. Actin interacting protein1 and actin depolymerizing factor drive rapid actin dynamics in Physcomitrella patens. Plant Cell. 23:3696–3710. 10.1105/tpc.111.090753 [DOI] [PMC free article] [PubMed] [Google Scholar]
- Baluška F., Salaj J., Mathur J., Braun M., Jasper F., Šamaj J., Chua N.-H., Barlow P.W., and Volkmann D.. 2000. Root hair formation: F-actin-dependent tip growth is initiated by local assembly of profilin-supported F-actin meshworks accumulated within expansin-enriched bulges. Dev. Biol. 227:618–632. 10.1006/dbio.2000.9908 [DOI] [PubMed] [Google Scholar]
- Bascom C.S. Jr., Wu S.-Z., Nelson K., Oakey J., and Bezanilla M.. 2016. Long-Term Growth of Moss in Microfluidic Devices Enables Subcellular Studies in Development. Plant Physiol. 172:28–37. 10.1104/pp.16.00879 [DOI] [PMC free article] [PubMed] [Google Scholar]
- Bibikova T.N., Blancaflor E.B., and Gilroy S.. 1999. Microtubules regulate tip growth and orientation in root hairs of Arabidopsis thaliana. Plant J. 17:657–665. 10.1046/j.1365-313X.1999.00415.x [DOI] [PubMed] [Google Scholar]
- Breitsprecher D., Jaiswal R., Bombardier J.P., Gould C.J., Gelles J., and Goode B.L.. 2012. Rocket launcher mechanism of collaborative actin assembly defined by single-molecule imaging. Science. 336:1164–1168. 10.1126/science.1218062 [DOI] [PMC free article] [PubMed] [Google Scholar]
- Doonan J.H., Cove D.J., and Lloyd C.W.. 1988. Microtubules and microfilaments in tip growth: evidence that microtubules impose polarity on protonemal growth in Physcomitrella patens. J. Cell Sci. 89:533–540. [Google Scholar]
- Eng R.C., and Wasteneys G.O.. 2014. The microtubule plus-end tracking protein ARMADILLO-REPEAT KINESIN1 promotes microtubule catastrophe in Arabidopsis. Plant Cell. 26:3372–3386. 10.1105/tpc.114.126789 [DOI] [PMC free article] [PubMed] [Google Scholar]
- Furt F., Liu Y.-C., Bibeau J.P., Tüzel E., and Vidali L.. 2013. Apical myosin XI anticipates F-actin during polarized growth of Physcomitrella patens cells. Plant J. 73:417–428. 10.1111/tpj.12039 [DOI] [PubMed] [Google Scholar]
- Harries P.A., Pan A., and Quatrano R.S.. 2005. Actin-related protein2/3 complex component ARPC1 is required for proper cell morphogenesis and polarized cell growth in Physcomitrella patens. Plant Cell. 17:2327–2339. 10.1105/tpc.105.033266 [DOI] [PMC free article] [PubMed] [Google Scholar]
- Henty-Ridilla J.L., Rankova A., Eskin J.A., Kenny K., and Goode B.L.. 2016. Accelerated actin filament polymerization from microtubule plus ends. Science. 352:1004–1009. 10.1126/science.aaf1709 [DOI] [PMC free article] [PubMed] [Google Scholar]
- Hiwatashi Y., Sato Y., and Doonan J.H.. 2014. Kinesins have a dual function in organizing microtubules during both tip growth and cytokinesis in Physcomitrella patens. Plant Cell. 26:1256–1266. 10.1105/tpc.113.121723 [DOI] [PMC free article] [PubMed] [Google Scholar]
- Juanes M.A., Bouguenina H., Eskin J.A., Jaiswal R., Badache A., and Goode B.L.. 2017. Adenomatous polyposis coli nucleates actin assembly to drive cell migration and microtubule-induced focal adhesion turnover. J. Cell Biol. 216:2859–2875. 10.1083/jcb.201702007 [DOI] [PMC free article] [PubMed] [Google Scholar]
- Manck R., Ishitsuka Y., Herrero S., Takeshita N., Nienhaus G.U., and Fischer R.. 2015. Genetic evidence for a microtubule-capture mechanism during polarised growth of Aspergillus nidulans. J. Cell Sci. 128:3569–3582. 10.1242/jcs.169094 [DOI] [PubMed] [Google Scholar]
- Martin S.G., and Arkowitz R.A.. 2014. Cell polarization in budding and fission yeasts. FEMS Microbiol. Rev. 38:228–253. 10.1111/1574-6976.12055 [DOI] [PubMed] [Google Scholar]
- Martin S.G., McDonald W.H., Yates J.R. III, and Chang F.. 2005. Tea4p links microtubule plus ends with the formin for3p in the establishment of cell polarity. Dev. Cell. 8:479–491. 10.1016/j.devcel.2005.02.008 [DOI] [PubMed] [Google Scholar]
- Peñalva M.A., Zhang J., Xiang X., and Pantazopoulou A.. 2017. Transport of fungal RAB11 secretory vesicles involves myosin-5, dynein/dynactin/p25, and kinesin-1 and is independent of kinesin-3. Mol. Biol. Cell. 28:947–961. 10.1091/mbc.e16-08-0566 [DOI] [PMC free article] [PubMed] [Google Scholar]
- Perroud P.-F., and Quatrano R.S.. 2006. The role of ARPC4 in tip growth and alignment of the polar axis in filaments of Physcomitrella patens. Cell Motil. Cytoskeleton. 63:162–171. 10.1002/cm.20114 [DOI] [PubMed] [Google Scholar]
- Ringli C., Baumberger N., Diet A., Frey B., and Keller B.. 2002. ACTIN2 is essential for bulge site selection and tip growth during root hair development of Arabidopsis. Plant Physiol. 129:1464–1472. 10.1104/pp.005777 [DOI] [PMC free article] [PubMed] [Google Scholar]
- Rounds C.M., and Bezanilla M.. 2013. Growth mechanisms in tip-growing plant cells. Annu. Rev. Plant Biol. 64:243–265. 10.1146/annurev-arplant-050312-120150 [DOI] [PubMed] [Google Scholar]
- Sieberer B.J., Ketelaar T., Esseling J.J., and Emons A.M.C.. 2005. Microtubules guide root hair tip growth. New Phytol. 167:711–719. 10.1111/j.1469-8137.2005.01506.x [DOI] [PubMed] [Google Scholar]
- Takeshita N., Manck R., Grün N., de Vega S.H., and Fischer R.. 2014. Interdependence of the actin and the microtubule cytoskeleton during fungal growth. Curr. Opin. Microbiol. 20:34–41. 10.1016/j.mib.2014.04.005 [DOI] [PubMed] [Google Scholar]
- Tinevez J.-Y., Perry N., Schindelin J., Hoopes G.M., Reynolds G.D., Laplantine E., Bednarek S.Y., Shorte S.L., and Eliceiri K.W.. 2017. TrackMate: An open and extensible platform for single-particle tracking. Methods. 115:80–90. 10.1016/j.ymeth.2016.09.016 [DOI] [PubMed] [Google Scholar]
- van Gisbergen P.A.C., Li M., Wu S.-Z., and Bezanilla M.. 2012. Class II formin targeting to the cell cortex by binding PI(3,5)P(2) is essential for polarized growth. J. Cell Biol. 198:235–250. 10.1083/jcb.201112085 [DOI] [PMC free article] [PubMed] [Google Scholar]
- Vidali L., McKenna S.T., and Hepler P.K.. 2001. Actin polymerization is essential for pollen tube growth. Mol. Biol. Cell. 12:2534–2545. 10.1091/mbc.12.8.2534 [DOI] [PMC free article] [PubMed] [Google Scholar]
- Vidali L., Rounds C.M., Hepler P.K., and Bezanilla M.. 2009a Lifeact-mEGFP reveals a dynamic apical F-actin network in tip growing plant cells. PLoS One. 4:e5744 10.1371/journal.pone.0005744 [DOI] [PMC free article] [PubMed] [Google Scholar]
- Vidali L., van Gisbergen P.A.C., Guérin C., Franco P., Li M., Burkart G.M., Augustine R.C., Blanchoin L., and Bezanilla M.. 2009b Rapid formin-mediated actin-filament elongation is essential for polarized plant cell growth. Proc. Natl. Acad. Sci. USA. 106:13341–13346. 10.1073/pnas.0901170106 [DOI] [PMC free article] [PubMed] [Google Scholar]
- Vidali L., Burkart G.M., Augustine R.C., Kerdavid E., Tüzel E., and Bezanilla M.. 2010. Myosin XI is essential for tip growth in Physcomitrella patens. Plant Cell. 22:1868–1882. 10.1105/tpc.109.073288 [DOI] [PMC free article] [PubMed] [Google Scholar]
- Wu S.-Z., and Bezanilla M.. 2014. Myosin VIII associates with microtubule ends and together with actin plays a role in guiding plant cell division. eLife. 3:e03498 10.7554/eLife.03498 [DOI] [PMC free article] [PubMed] [Google Scholar]
- Wu S.-Z., Ritchie J.A., Pan A.-H., Quatrano R.S., and Bezanilla M.. 2011. Myosin VIII regulates protonemal patterning and developmental timing in the moss Physcomitrella patens. Mol. Plant. 4:909–921. 10.1093/mp/ssr068 [DOI] [PubMed] [Google Scholar]
- Wu X., Kodama A., and Fuchs E.. 2008. ACF7 regulates cytoskeletal-focal adhesion dynamics and migration and has ATPase activity. Cell. 135:137–148. 10.1016/j.cell.2008.07.045 [DOI] [PMC free article] [PubMed] [Google Scholar]
- Yin H., Pruyne D., Huffaker T.C., and Bretscher A.. 2000. Myosin V orientates the mitotic spindle in yeast. Nature. 406:1013–1015. 10.1038/35023024 [DOI] [PubMed] [Google Scholar]
- Yue J., Zhang Y., Liang W.G., Gou X., Lee P., Liu H., Lyu W., Tang W.-J., Chen S.-Y., Yang F., et al. . 2016. In vivo epidermal migration requires focal adhesion targeting of ACF7. Nat. Commun. 7:11692 10.1038/ncomms11692 [DOI] [PMC free article] [PubMed] [Google Scholar]
- Zimmermann D., Homa K.E., Hocky G.M., Pollard L.W., De La Cruz E.M., Voth G.A., Trybus K.M., and Kovar D.R.. 2017. Mechanoregulated inhibition of formin facilitates contractile actomyosin ring assembly. Nat. Commun. 8:703 10.1038/s41467-017-00445-3 [DOI] [PMC free article] [PubMed] [Google Scholar]
Associated Data
This section collects any data citations, data availability statements, or supplementary materials included in this article.


