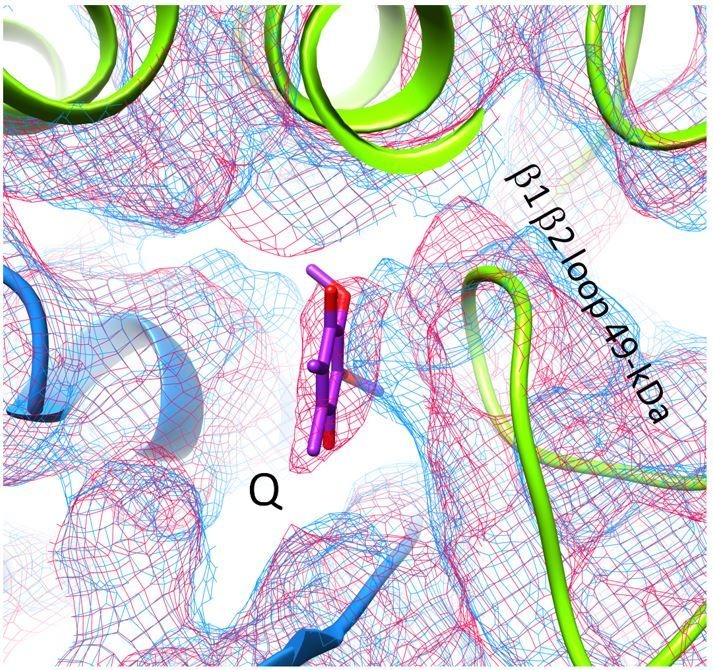
Author response image 1. Density for ubiquinone headgroup.

View from the membrane arm into the ubiquinone binding pocket. Overlay of density maps (deactive, blue; turnover conditions, red; model for complex I under turnover conditions). Note that the blue map has slightly higher resolution and that the b1 b2 loop changes between the two states.
