Abstract
Ribosome profiling identifies RNA fragments associated with translating ribosomes. The technology provides an opportunity to examine genome-wide translation events in the single nucleotide resolution and in an unbiased manner. Here I present a computational pipeline named RibORF to systematically identify translated open reading frames (ORFs), based on read distribution features representing active translation, including 3-nt periodicity and uniformness across codons. The analyses using the computational tool revealed pervasive translation in putative ‘noncoding’ regions, such as lncRNAs, pseudogenes and 5′UTRs. The computational tool is useful to study functional roles of non-canonical translation events in various biological processes.
Keywords: Ribosome profiling, Translation, Open reading frame, noncoding RNA
INTRODUCTION
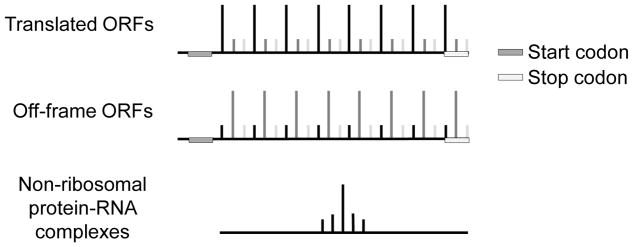
Ribosome profiling identifies genome-wide RNA fragments associated with translating ribosomes (Ingolia et al., 2013; Ingolia et al., 2009). Cells were treated with cycloheximide to stop ribosome elongation. High concentration of RNase I was used to digest RNA regions not protected by protein complexes. Protein-RNA complexes were isolated using ultracentrifugation through a sucrose cushion. The RNAs associated with protein complexes were purified for next-generation sequencing. The detailed experimental procedure was described in (McGlincy and Ingolia, 2017). However, during ribosome profiling procedure, no ribosome antibody was used to select ribosome-RNA complexes. Actually, ribosome profiling is a transcriptomic RNase footprinting assay, which can detect both ribosome-RNA complexes and non-ribosomal protein-RNA complexes (Ji et al., 2016). As a result, it is important to distinguish sequencing reads representing these two types of complexes during the data analyses. For the reads representing active translation, we can observe in-frame 3-nt periodicity across actively translated ORFs (Figure 1). And the reads representing non-ribosomal protein-RNA complexes tend to show highly localized distribution (Figure 1). These read distribution features can be used to distinguish ribosomal and non-ribosomal protein-RNA complexes.
Figure 1.
For candidate ORFs with ribosome profiling reads, the read distribution features can separate them into three groups, including actively translated ORFs, off-frame ORFs, and non-ribosomal protein-RNA complex binding.
In this protocol, I present a computational tool named RibORF to identify genome-wide translated open reading frames using ribosome profiling dataset. And it is an improved version of RibORF (RibORF.1.0), which is more powerful and user-friendly. The software can perform quality control of ribosome profiling dataset, generate candidate ORF files based on reference genome and transcriptome annotations, train learning parameters for individual datasets, identify actively translated ORFs with predicted P-values and produce representative ORFs. The analyses results revealed pervasive translation in putative ‘noncoding’ regions, such as 5′UTRs, lncRNAs and pseudogenes (Ji et al., 2015).
BASIC PROTOCOL 1. Using RibORF software to identify genome-wide translated ORFs
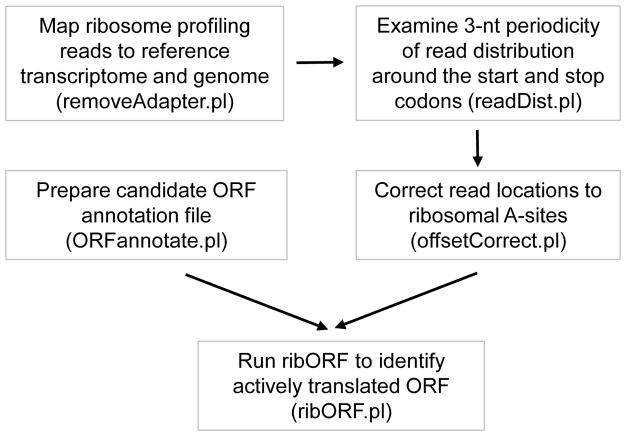
Following I describe the detailed steps of RibORF. Figure 2 shows the outline of data analyses. We published the RibORF algorithm in (Ji et al., 2015), and here I present an improved and a more user-friendly version. As an example, I present a procedure to identify translated ORF in a human cell using a published ribosome profiling dataset. Similar computational steps can be used for the analyses in other cells and model species.
Figure 2.
The outline of the RibORF algorithm.
Materials
Ribosome profiling datasets in Fastq format;
Genome assembly file in Fasta format;
Ribosomal RNA (rRNA) sequence file in Fasta format;
Transcript annotation file in genePred format;
Linux high performance computing cluster;
Perl program installation;
R program installation in the PATH;
Read mapping software (such as Bowtie (Langmead and Salzberg, 2012) and Tophat (Kim et al., 2013))
Download RibORF software
-
1
Download RibORF package from https://github.com/zhejilab/RibORF/.
Users will obtain the following scripts: “ORFannotate.pl”, “removeAdapter.pl”, “readDist.pl”, “offsetCorrect.pl” and “ribORF.pl”.
Prepare the annotation files and candidate ORFs from a genome
-
2
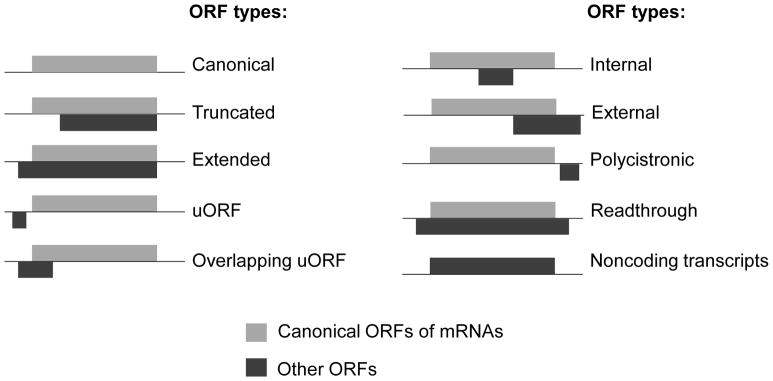
Obtain genome annotation files, including the genome assembly file in Fasta format and reference transcriptome annotation file in genePred format. Run “ORFannotate.pl” to get candidate ORFs in transcripts. The program allows users to pick start codons types and select ORF length cutoff. The default setting considers 5 types of start codons “ATG/CTG/GTG/TTG/ACG”, which are most frequently used ones. The program also annotates candidate ORF types based on the transcript types and ORF locations in the transcripts, such as canonical ORFs, uORFs in 5′UTRs and internal off-frame ORFs in coding regions (Figure 3).
Usage: perl ORFcandidate.pl -g genomeSequenceFile -t transcriptomeFile -o outputDir [-s startCodon] [-l orfLengthCutoff]
g genomeSequenceFile: the genome assembly file in fasta format;
t transcriptomeFile: the reference transcriptome annotation file in genePred format;
o outputDir: output directory;
s startCodon [optional]: start codon types to be considered separated by “/”, default: ATG/CTG/GTG/TTG/ACG;
-
l orfLengthCutoff [optional]: cutoff of minimum candidate ORF length, default: 6nt.
Example commands:
-
2a
Download human genome and transcriptome annotation files from GENCODE (Harrow et al., 2012).
wget ftp://ftp.ebi.ac.uk/pub/databases/gencode/Gencode_human/release_28/gencode.v28.annotation.gtf.gz
-
2b
Get gtfToGenePred command line from UCSC Genome Browser, and use the tool to convert the GTF file to genePred format.
wget http://hgdownload.soe.ucsc.edu/admin/exe/linux.x86_64/gtfToGenePred
gtfToGenePred gencode.v28.annotation.gtf
gencode.v28.annotation.genePred.txt
-
2c
Run “ORFannotate.pl” and generate candidate ORFs in genePred format.
perl ORFannotate.pl -g GRCh38.primary_assembly.genome.fa -t
gencode.v28.annotation.genePred.txt -o outputDir
There will be 2 files generated in the output directory, including “candidateORF.genepred.txt” with candidate ORFs in genePred format, and “candidateORF.fa” with candidate ORF sequences in Fasta format. We generated the candidate ORF IDs with the following format: “TranscriptID:chromatin:strand|RankNumber|transcriptLength:startCodonPosition: stopCodonPosition|candidateORFType|startCodonType” (as an example: ENST00000420190.6:chr1:+|1|1578:87:357|uORF|TTG).
For the genePred format, each row contains the following information of a transcript (take “ENST00000377898.3” as an example):
“Name of transcript”: ENST00000377898.3
“Chromosome”: chr1
“Strand”: +
“Transcription start site”: 6244191
“Transcription end site”: 6245578
“Start codon position”: 6244365
“Stop codon position”: 6245507
“Number of exons”: 4
“Exon start positions”: 6244191,6244350,6244547,6245109,
“Exon end positions”: 6244241,6244446,6244629,6245578,
Figure 3.
Types of candidate ORFs, defined based on transcript types and ORF locations in reference transcripts.
Map ribosome profiling reads to reference transcriptome and genome
-
Obtain the ribosome profiling dataset with cycloheximide treatment or without drug treatment, and run “removeAdapter.pl” to trim 3′ adapters of sequencing reads. For some datasets, 3′ adapters were sequenced. This helps to precisely define the length of inserted RNA fragments.
Usage: perl removeAdapter.pl -f fastqFile -a adapterSequence -o outputFile [-l readLengthCutoff]
f fastqFile: raw sequencing reads in fastq format;
a adapterSequence: sequence of 3′ adapters, first 10nt is recommended;
o outputFile: output file;
-
l readLengthCutoff [optional]: minimal read length after trimming 3′ adapters, default is 15nt.
Example commands:
-
3a
Download an example ribosome profiling dataset from GEO database using the fastq-dump command line (available from the NIH software sratoolkit, https://www.ncbi.nlm.nih.gov/sra/docs/toolkitsoft/).
fastq-dump -Z SRR1802146 > SRR1802146.fastq
-
3b
Remove 3′ adapters of sequencing reads.
perl removeAdapter.pl -f SRR1802146.fastq -a CTGTAGGCAC -o
adapter.SRR1802146.fastq
Obtain sequencing reads after trimming 3′ adapters.
-
Map trimmed reads to rRNAs, and then map non-rRNA reads to the reference transcriptome and genome.
Example commands:
-
4a
Get human rRNA sequences from NCBI database, including 5S rRNA (NR_023363), 5.8S rRNA (NR_003285), 18S rRNA (NR_003286) and 28S rRNA (NR_003287). Put the rRNA sequences in the file “human.ribosomal.rna.fa” with fastq format.
-
4b
Use Bowtie to index rRNA sequences.
bowtie2-build human.ribosomal.rna.fa hg.ribosome
-
4c
Align trimmed ribosome profiling reads from step 3b to rRNAs, and obtain non-rRNA reads.
bowtie2 -x hg.ribosome -U adapter.SRR1802146.fastq --un
norrna.adapter.SRR1802146.fastq -S ribosome.adapter.SRR1802146.fastq
-
4d
Align non-rRNA reads to the reference transcriptome and genome, and obtain the alignment file in SAM format.
tophat --GTF gencode.v28.annotation.gtf --no-convert-bam -o outputDir
GRCh38genome.index norrna.adapter.SRR1802146.fastq
Obtain the read alignment file in SAM format.
Plot ribosome profiling read distribution around the start and stop codons of canonical ORFs of mRNAs, and check ribosome profiling data quality
-
Run “readDist.pl” to group reads based on fragment length, and check the distribution of 5′ ends of the reads around the start and stop codons of canonical ORFs of mRNAs. The length of ribosome protected fragments is ~30nt. Users can specify the fragment length (i.e. 28,29,30), and examine read distribution.
During ribosome profiling, RNase I cannot always completely digest RNA regions unprotected by protein complexes. As a result, some reads do not show clear 3-nt periodicity across ORFs, and these reads cannot be used to identify genome-wide translated ORFs. It is important to examine the read distribution across canonical ORFs of mRNAs, and ensure that reads show clear 3-nt periodicity.
Usage: perl readDist.pl -f readFile -g geneFile -o outputDir [-d readLength] [-l leftNum] [-r rightNum]
f readFile: read alignments to the reference transcriptome and genome in SAM format;
g geneFile: canonical protein-coding ORF annotation file in genePred format;
o outputDir: output directory;
d readLength [optional]: specified RPF length (nt), default: 25,26,27,28,29,30,31,32,33,34,;
l leftNum [optional]: N nucleotides upstream start codon and downstream stop codon, default: 30;
-
r rightNum [optional]: N nucleotides downstream start codon and upstream stop codon, default: 50.
Example command:
perl readDist.pl -f SRR1802146.mapping.sam -g
gencode.v28.annotation.genePred.txt -o outputDir -d 28,29,30, -l 40 -r 70
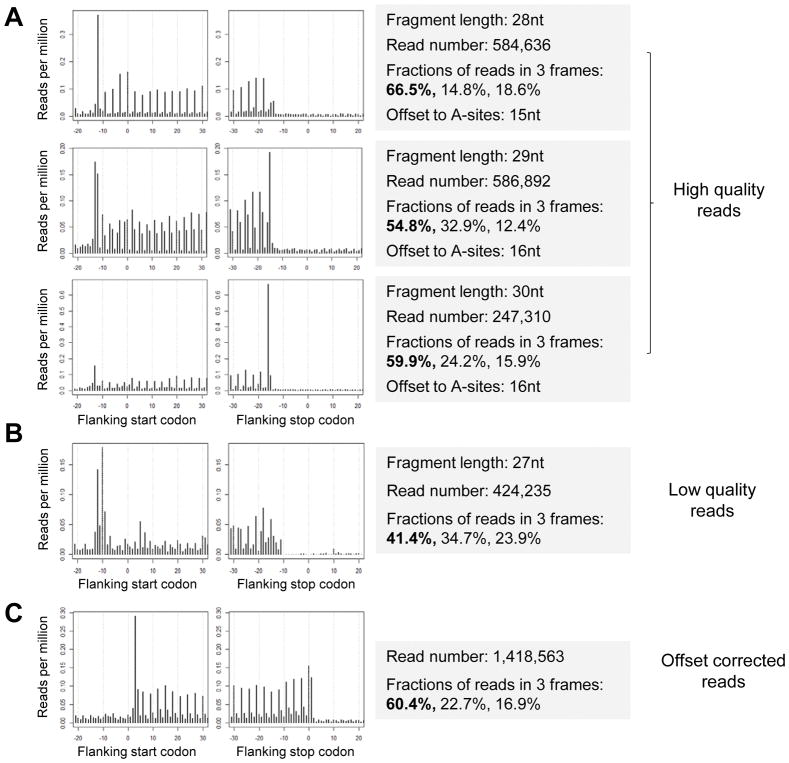
Several files will be generated in the output directory. “plot.readDist.*.pdf” shows the plot of read distribution around the start and stop codons of canonical ORFs. “read.dist.sample.*.txt” shows numeric read densities around codons, indicated by read per million (RPM) values. “sta.read.dist.*.txt” contains read number statistics, and fractions of reads in each nucleotide of codons (1st, 2nd, and 3rd). Examples plots are shown in Figure 4. High quality reads show clear 3-nt periodicity, with a high percentage of reads in 1st nucleotides of codons (>50% is recommended) (Figure 4A). Low quality reads do not show obvious 3-nt periodicity, and cannot be used for further analyses (Figure 4B).
Figure 4.
Check read distribution around the start and stop codons of canonical ORFs, and correct read locations based on offset distances between 5′ end of fragments and ribosomal A-sites. (A) Ribosome profiling reads were grouped based on fragment length (i.e. 28nt, 29nt and 30nt). The plots show the distribution of 5′ end of read fragments around the start and stop codons of canonical ORFs of mRNAs. The dataset shows high quality and clear 3-nt periodicity. The summary statistics of read fragments were shown in the box. (B) An example of low quality ribosome profiling dataset, which does not show obvious 3-nt periodicity. (C) Distribution of offset corrected read distribution around the start and stop codons of canonical ORFs.
Assign read mapping locations to ribosomal A-sites
-
Run “offsetCorrect.pl” and correct read locations based on offset distances between 5′ ends and ribosomal A-sites. The offset distances can be inferred from the plots from step 5. Based on the read distribution around the start and stop codon of canonical ORFs, users can manually check the offset distances between 5′ ends of the reads and ribosomal A-site, as examples in Figure 4A. Users can manually check the read distribution plots and ensure the data quality. Put correction parameters in a file, i.g. “offset.correction.parameters.txt”, with 2 columns. The first column shows the read fragment length, and the second column shows the offset distance. Ribosomal profiling experiments can have different offset correction parameters.
Usage: perl offsetCorrect.pl -r readFile -p offsetParameterFile -o readCorrectedFile
r readFile: read mapping file before offset correction in SAM format;
p offsetParameterFile: parameters for offset correction, 1st column: read length, 2nd column: offset distance;
-
o readCorrectedFile: output file after offset correction in SAM format.
Example commands:
-
6a
Generate the file “offset.correction.parameters.txt”, with the content as following.
28 15 29 16 30 16 -
6b
Run “offsetCorrect.pl”.
perl offsetCorrect.pl -r SRR1802146.mapping.sam -p
offset.correction.parameters.txt -o corrected. SRR1802146.mapping.sam
Obtain the corrected read mapping file in SAM format, in which each read location represents the corresponding ribosomal A-site.
-
Run “readDist.pl” and check the corrected read locations around the start and stop codons of canonical ORFs. This step is to check whether read distribution after offset correction shows clear in-frame 3-nt periodicity. As the read length after offset correction is 1, put the parameter “-d” as “1”. An example plot is shown in Figure 4C.
Usage: perl readDist.pl -f readFile -g geneFile -o outputDir -d 1 [-l leftNum] [-r rightNum]
f readFile: read alignments to the reference transcriptome and genome, in SAM format;
g geneFile: canonical protein-coding ORF annotation file, in genePred format;
o outputDir: output directory;
d readLength:1;
l leftNum [optional]: N nucleotides upstream start codon and downstream stop codon, default: 30;
-
r rightNum [optional]: N nucleotides downstream start codon and upstream stop codon, default: 50.
Example command:
perl readDist.pl -f corrected.SRR1802146.mapping.sam -g
gencode.v28.annotation.genePred.txt -o outputDir -d 1
Manually check whether the corrected read locations represent ribosomal A-sites and the read distribution shows clear 3-nt periodicity across canonical ORFs.
Run RibORF to identify translated ORFs
-
Run “ribORF.pl” to identify translated ORFs using corrected ribosome profiling read alignment file from step 6 and the candidate ORF file from step 2. Users can pick cutoff parameters, including ORF length, supported read number and predicted translated P-value.
Usage: perl ribORF.pl -f readCorrectedFile -c candidateORFFile -o outputDir [-l orfLengthCutoff] [-r orfReadCutoff] [-p predictPvalueCutoff]
f readCorrectedFile: input read mapping file after offset correction in SAM format;
c candidateORFFile: candidate ORFs in genePred format;
o outputDir: output directory, with files reporting learning parameters and predicted translating probability;
l orfLengthCutoff [optional]: cutoff of ORF length (nt), default: 6;
r orfReadCutoff [optional]: cutoff of supported read number, default: 11.
-
p predictPvalueCutoff [optional]: cutoff used to select translated ORF, default: 0.7.
Example: perl ribORF.pl -f corrected.SRR1802146.mapping.sam -c
candidateORF.genepred.txt -o outputDir
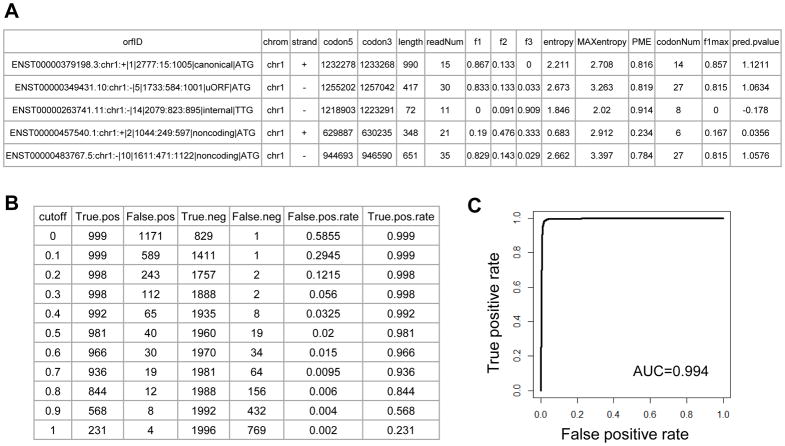
A few output files will be generated. “pred.pvalue.parameters.txt” contains training parameters for candidate ORFs and predicted P-values. The columns include the following: candidate ORF ID (orfID), chromosome (chrom), strand, start codon location (codon5), stop codon location (codon3), ORF length, supporting read number (readNum), fraction of reads in 1st nucleotides of codons (f1), fraction of reads in 2nd nucleotides of codons (f2), fraction of reads in 3rd nucleotides of codons (f3), entropy value of read distribution (entropy), maximum entropy value of randomized distribution (MAXentropy), percentage of maximum entropy value (PME), number of codons with sequencing reads (codonNum), fraction of codons with 1st nucleotides containing more reads than 2nd and 3rd (f1max), and predicted translated probability (pred.pvalue). The predicted translated P-value for each candidate ORF was calculated using logistic regression model, and was based on 3 input parameters, including f1, PME, and f1max. Figure 5A shows example outputs.
The predicted translated P-values represent the binary classification of the candidate ORFs. The values can be smaller than 0 or be great than 1. P-values closer to 1 represents that the ORF is likely to be translated. Users can select the cutoff P-value to define translated ORFs. “stat.cutoff.txt” file contains the cutoffs and associated statistics of true positive, false positive, true negative and false negative estimations. Users can take the numbers as the reference to pick appropriate cutoff. Figure 5B shows an example output. “plot.ROC.curve.pdf” contains the ROC curve plot based on “false positive rates” and “true positive rates” from the “stat.cutoff.txt” file. Users can use the following R script to estimate Area Under ROC Curve (AUC) value. An example ROC curve is shown in Figure 5C. Users can run the following R script to get the ROC curve and the AUC value, and the R script requires “MESS” package installation.
A <- read.table (“stat.cutoff.txt”, sep=“\t”, header=T)
fpr <- A[,6]
tpr <- A[,7]
plot(fpr, tpr, col=0)
lines(fpr, tpr,col=1, lwd=3)
library(“MESS”)
auc(fpr,tpr, type = ‘spline’)
Many candidate ORFs can overlap with each other with the same stop codon and different start codons. In this case, a representative ORF is selected based on the following criteria: we first pick AUG as start codons if present, and we then choose 5′ most start codon as the representative one. But if there is no read between the picked one and the next downstream candidate, we choose the next one as the representative start codon. The output files “repre.valid.pred.pvalue.parameters.txt” and “repre.valid.ORF.genepred.txt” contain the information of representative ORFs.
Figure 5.
Example outputs of RibORF program and algorithm performance evaluation. (A) Example candidate ORFs with training parameters and predicted translated P-values. These values were shown in the files “pred.pvalue.parameters.txt” and “repre.valid.pred.pvalue.parameters.txt”. (B) The predicted translated P-value cutoffs and associated statistics of true positive, false positive, true negative, false negative, false positive rate and true positive rate, as shown in the “stat.cutoff.txt” file. (C) The ROC curve showing the performance of the RibORF program in identifying translated ORFs. The plot was shown in the “plot.ROC.curve.pdf”. The AUC value was shown in the plot.
COMMENTARY
Background Information
Translation is an essential step of gene expression, in which RNAs are decoded by ribosomes to produce proteins. The translation initiation complex (40S ribosome) binds to the 5′ cap structure of RNAs, and scans the RNA until it meets a start codon (AUG or its near-cognates). At the start codon, the 60S ribosome binds to the initiation complex, forming the 80S ribosome. The 80S ribosome elongates through the open reading frame, moves one codon (three nucleotides) per step and synthesizes the polypeptide. When it moves to a stop codon (UAA, UGA or UAG), the 80S ribosome dissociates from the RNA template and releases the polypeptide. Multiple 80S ribosomes can co-occupy a long open reading frame, forming polysomes. The association of 80S ribosome to an RNA is the signature of active translation (Heyer and Moore, 2016).
It is generally believed that there are 4 types of transcripts encoded by a mammalian genome, including mRNAs, long noncoding RNAs (lncRNAs), pseudogenes and small noncoding RNAs. By definition, only canonical open reading frames (ORFs) of mRNAs are translated to produce proteins. lncRNAs can play various regulatory roles through functional RNA domains (Rinn and Chang, 2012). 100 amino acid (100 aa) has been used as the cutoff to define ORFs, based on the computation simulation that this will not happen by chance during evolution (Clamp et al., 2007). However, the cutoff is likely to select ORFs producing functional proteins. It is definitely possible that an ORF can be translated and produce short peptides (<100 aa) with/without functions.
Ribosome profiling provides an unbiased characterization of transcriptomic native protein-RNA complexes (Ji et al., 2016), and has been widely used to study genome-wide RNA translation. In combination with drug treatments, the experiments can be used to study steps of RNA translation. Cycloheximide treatment can block translation elongation (Ingolia et al., 2009). Sequencing reads with/without cycloheximide treatment show continuous 3-nt periodicity across translated ORFs (Ji et al., 2015). 3-nt periodicity is the most important feature to determine active translation (Ji et al., 2015). A set of computational algorithms such as RibORF (Ji et al., 2015), ORF-RATER (Fields et al., 2015), RiboTaper (Calviello et al., 2016), riboHMM (Raj et al., 2016), SPECtre (Chun et al., 2016), Rb-Bp (Malone et al., 2017) and ribotish (Zhang et al., 2017), were developed to identify genome-wide translated ORFs based on the feature. The use of lactimidomycin or harringtonine can block the translocation step of translation initiation (Ingolia et al., 2011; Lee et al., 2012). And sequencing reads are enriched at start codons. Algorithms such as ORF-RATER (Fields et al., 2015) and ribotish (Zhang et al., 2017) were developed to map translational initiation sites. The analyses can reveal more complex start codons used for active translation.
The development of computational tools for ribosome profiling revealed pervasive translation in putative “noncoding” regions, such as lncRNAs, pseudogenes and 5′UTRs (Ji et al., 2015). This provides the opportunity to explore the functional roles of genome-wide non-canonical translation events. First, short peptides encoded by non-canonical translation can have biological functions, such as regulating cell movement (Pauli et al., 2014), muscle performance (Anderson et al., 2015) and mTOR pathway (Matsumoto et al., 2017). Second, translation in 5′UTR can regulate the translation efficiency of downstream canonical ORFs, such as regulating stress response (Barbosa et al., 2013; Hinnebusch et al., 2016). Third, translation in lncRNAs and 5′UTRs can promote non-sense mediated decay (Wery et al., 2016). Further genomics and genetics research efforts are needed to take advantage of the computational tools and explore functional roles of non-translation events.
In this protocol, I present the RibORF software originally published in (Ji et al., 2015). I made several significant changes of the RibORF algorithm to make the software more powerful and user-friendly. First, I used the logistic regression model to calculate the translated probability, instead of support vector machine (SVM), because logistic Regression function was included by default R installation, while SVM was not. SVM seems to perform slightly better to distinguish non-ribosomal protein-RNA complex, but the differences are pretty minor. Second, this version of RibORF can train the prediction parameters based on the read distribution pattern of each individual dataset, using canonical ORFs in mRNA as the positive training set, and internal off-frame ORFs as the negative training set. As the 3-nt periodicity patterns of different ribosome profiling datasets are quite variable, the modification can make the prediction more accurate. Users will obtain a statistical summary of the algorithm performance, such as false discovery rates and negative discovery rates using different cutoffs. The prediction accuracy is correlated with ribosome profiling data quality. Third, I introduced a new learning parameter to identify translated ORFs, i.e. fraction of codons with 1st nucleotides containing the maximum number of reads. This parameter helps to reduce false positives resulting from enriched reads in a small subset of codons.
Critical Parameters
Ribosome profiling data quality
For a high quality dataset, ribosome profiling reads should show clear 3-nt periodicity across codons. However, for many ribosome profiling datasets, we cannot observe clear 3-nt periodicity of read distribution. Probably, this is due to incomplete RNase I digestion. For these datasets, we cannot accurately assign reads to ribosomal A-sites, and they are not useful to identify translated ORFs. It is important to check the distribution of ribosome profiling reads across canonical ORFs and ensure the data quality. If the reads show clear 3-nt periodicity in canonical ORFs, they should show the similar pattern in other translated ORFs. >50% of reads in one frame is recommended to select high quality data.
Transcriptome and genome annotation
We generated candidate ORFs based on transcriptome and genome annotations in a species. As a result, the accuracy of candidate ORF annotations depends on the quality of reference transcriptome and genome. It is important to manually check read distributions of genes of interest. Users can load the read alignment file after ribosomal A-site offset correction to a genome browser such as Integrative Genomics Viewer (IGV), and visualize read distribution across ORFs.
Anticipated Results
Users can obtain the candidate ORF annotation file based on reference transcriptome and genome, examine the ribosome profiling data quality, assign ribosome profiling read locations to ribosomal A-sites, and identify genome-wide translated ORFs and representative ones with predicted P-values.
Time Considerations
This protocol can take 2 days to run. The time to generate the candidate ORF file depends on the size of reference transcriptome and genome, and it takes ~1 hour for human genome annotation. Plotting read distribution around the start and stop codons takes ~30 mins. Users need to manually check the read distribution and generate parameters to perform read offset correction. The RibORF prediction will take a few hours, depending on the number of candidate ORFs.
Acknowledgments
I thank numerous scientists, who tried to run RibORF and provided valuable feedback to improve the software. The work was supported by grants to Z.J. from the National Institutes of Health (CA 207865) and from Northwestern University (the Searle Leadership Fund in the Life Sciences).
Footnotes
INTERNET RESOURCES
RibORF software is available from https://github.com/zhejilab/RibORF
LITERATURE CITED
- Anderson DM, Anderson KM, Chang CL, Makarewich CA, Nelson BR, McAnally JR, Kasaragod P, Shelton JM, Liou J, Bassel-Duby R, et al. A micropeptide encoded by a putative long noncoding RNA regulates muscle performance. Cell. 2015;160:595–606. doi: 10.1016/j.cell.2015.01.009. [DOI] [PMC free article] [PubMed] [Google Scholar]
- Barbosa C, Peixeiro I, Romao L. Gene expression regulation by upstream open reading frames and human disease. PLoS genetics. 2013;9:e1003529. doi: 10.1371/journal.pgen.1003529. [DOI] [PMC free article] [PubMed] [Google Scholar]
- Calviello L, Mukherjee N, Wyler E, Zauber H, Hirsekorn A, Selbach M, Landthaler M, Obermayer B, Ohler U. Detecting actively translated open reading frames in ribosome profiling data. Nature methods. 2016;13:165–170. doi: 10.1038/nmeth.3688. [DOI] [PubMed] [Google Scholar]
- Chun SY, Rodriguez CM, Todd PK, Mills RE. SPECtre: a spectral coherence--based classifier of actively translated transcripts from ribosome profiling sequence data. BMC Bioinformatics. 2016;17:482. doi: 10.1186/s12859-016-1355-4. [DOI] [PMC free article] [PubMed] [Google Scholar]
- Clamp M, Fry B, Kamal M, Xie X, Cuff J, Lin MF, Kellis M, Lindblad-Toh K, Lander ES. Distinguishing protein-coding and noncoding genes in the human genome. Proc Natl Acad Sci U S A. 2007;104:19428–19433. doi: 10.1073/pnas.0709013104. [DOI] [PMC free article] [PubMed] [Google Scholar]
- Fields AP, Rodriguez EH, Jovanovic M, Stern-Ginossar N, Haas BJ, Mertins P, Raychowdhury R, Hacohen N, Carr SA, Ingolia NT, et al. A Regression-Based Analysis of Ribosome-Profiling Data Reveals a Conserved Complexity to Mammalian Translation. Mol Cell. 2015;60:816–827. doi: 10.1016/j.molcel.2015.11.013. [DOI] [PMC free article] [PubMed] [Google Scholar]
- Harrow J, Frankish A, Gonzalez JM, Tapanari E, Diekhans M, Kokocinski F, Aken BL, Barrell D, Zadissa A, Searle S, et al. GENCODE: the reference human genome annotation for The ENCODE Project. Genome Res. 2012;22:1760–1774. doi: 10.1101/gr.135350.111. [DOI] [PMC free article] [PubMed] [Google Scholar]
- Heyer EE, Moore MJ. Redefining the Translational Status of 80S Monosomes. Cell. 2016;164:757–769. doi: 10.1016/j.cell.2016.01.003. [DOI] [PubMed] [Google Scholar]
- Hinnebusch AG, Ivanov IP, Sonenberg N. Translational control by 5′-untranslated regions of eukaryotic mRNAs. Science. 2016;352:1413–1416. doi: 10.1126/science.aad9868. [DOI] [PMC free article] [PubMed] [Google Scholar]
- Ingolia NT, Brar GA, Rouskin S, McGeachy AM, Weissman JS. Genome-wide annotation and quantitation of translation by ribosome profiling. Curr Protoc Mol Biol. 2013;Chapter 4(Unit 4):18. doi: 10.1002/0471142727.mb0418s103. [DOI] [PMC free article] [PubMed] [Google Scholar]
- Ingolia NT, Ghaemmaghami S, Newman JR, Weissman JS. Genome-wide analysis in vivo of translation with nucleotide resolution using ribosome profiling. Science. 2009;324:218–223. doi: 10.1126/science.1168978. [DOI] [PMC free article] [PubMed] [Google Scholar]
- Ingolia NT, Lareau LF, Weissman JS. Ribosome profiling of mouse embryonic stem cells reveals the complexity and dynamics of mammalian proteomes. Cell. 2011;147:789–802. doi: 10.1016/j.cell.2011.10.002. [DOI] [PMC free article] [PubMed] [Google Scholar]
- Ji Z, Song R, Huang H, Regev A, Struhl K. Transcriptome-scale RNase-footprinting of RNA-protein complexes. Nat Biotechnol. 2016;34:410–413. doi: 10.1038/nbt.3441. [DOI] [PMC free article] [PubMed] [Google Scholar]
- Ji Z, Song R, Regev A, Struhl K. Many lncRNAs, 5′UTRs, and pseudogenes are translated and some are likely to express functional proteins. Elife. 2015;4:e08890. doi: 10.7554/eLife.08890. [DOI] [PMC free article] [PubMed] [Google Scholar]
- Kim D, Pertea G, Trapnell C, Pimentel H, Kelley R, Salzberg SL. TopHat2: accurate alignment of transcriptomes in the presence of insertions, deletions and gene fusions. Genome Biol. 2013;14:R36. doi: 10.1186/gb-2013-14-4-r36. [DOI] [PMC free article] [PubMed] [Google Scholar]
- Langmead B, Salzberg SL. Fast gapped-read alignment with Bowtie 2. Nature methods. 2012;9:357–359. doi: 10.1038/nmeth.1923. [DOI] [PMC free article] [PubMed] [Google Scholar]
- Lee S, Liu BT, Lee S, Huang SX, Shen B, Qian SB. Global mapping of translation initiation sites in mammalian cells at single-nucleotide resolution. P Natl Acad Sci USA. 2012;109:E2424–E2432. doi: 10.1073/pnas.1207846109. [DOI] [PMC free article] [PubMed] [Google Scholar]
- Malone B, Atanassov I, Aeschimann F, Li X, Grosshans H, Dieterich C. Bayesian prediction of RNA translation from ribosome profiling. Nucleic Acids Res. 2017;45:2960–2972. doi: 10.1093/nar/gkw1350. [DOI] [PMC free article] [PubMed] [Google Scholar]
- Matsumoto A, Pasut A, Matsumoto M, Yamashita R, Fung J, Monteleone E, Saghatelian A, Nakayama KI, Clohessy JG, Pandolfi PP. mTORC1 and muscle regeneration are regulated by the LINC00961-encoded SPAR polypeptide. Nature. 2017;541:228–232. doi: 10.1038/nature21034. [DOI] [PubMed] [Google Scholar]
- McGlincy NJ, Ingolia NT. Transcriptome-wide measurement of translation by ribosome profiling. Methods. 2017;126:112–129. doi: 10.1016/j.ymeth.2017.05.028. [DOI] [PMC free article] [PubMed] [Google Scholar]
- Pauli A, Norris ML, Valen E, Chew GL, Gagnon JA, Zimmerman S, Mitchell A, Ma J, Dubrulle J, Reyon D, et al. Toddler: an embryonic signal that promotes cell movement via Apelin receptors. Science. 2014;343:1248636. doi: 10.1126/science.1248636. [DOI] [PMC free article] [PubMed] [Google Scholar]
- Raj A, Wang SH, Shim H, Harpak A, Li YI, Engelmann B, Stephens M, Gilad Y, Pritchard JK. Thousands of novel translated open reading frames in humans inferred by ribosome footprint profiling. Elife. 2016:5. doi: 10.7554/eLife.13328. [DOI] [PMC free article] [PubMed] [Google Scholar]
- Rinn JL, Chang HY. Genome regulation by long noncoding RNAs. Annu Rev Biochem. 2012;81:145–166. doi: 10.1146/annurev-biochem-051410-092902. [DOI] [PMC free article] [PubMed] [Google Scholar]
- Wery M, Descrimes M, Vogt N, Dallongeville AS, Gautheret D, Morillon A. Nonsense-Mediated Decay Restricts LncRNA Levels in Yeast Unless Blocked by Double-Stranded RNA Structure. Mol Cell. 2016;61:379–392. doi: 10.1016/j.molcel.2015.12.020. [DOI] [PMC free article] [PubMed] [Google Scholar]
- Zhang P, He D, Xu Y, Hou J, Pan BF, Wang Y, Liu T, Davis CM, Ehli EA, Tan L, et al. Genome-wide identification and differential analysis of translational initiation. Nat Commun. 2017;8:1749. doi: 10.1038/s41467-017-01981-8. [DOI] [PMC free article] [PubMed] [Google Scholar]
KEY REFERENCE
- RibORF program was originally published in: Ji Z, Song R, Regev A, Struhl K. Many lncRNAs, 5′UTRs, and pseudogenes are translated and some are likely to express functional proteins. Elife. 2015;4:e08890. doi: 10.7554/eLife.08890.
- The Following paper can help to understand ribosome profiling technology: Ji Z, Song R, Huang H, Regev A, Struhl K. Transcriptome-scale RNase-footprinting of RNA-protein complexes. Nat Biotechnol. 2016;34:410–413. doi: 10.1038/nbt.3441.


