

Abstract
CONTEXT:
For decades, high reliance on female sterilization in the United States has been accompanied by a high level of desire for sterilization reversal, and less-educated women have been more likely than better educated women to use the method and desire a reversal. Little is known about how levels of and educational differentials in such desire have changed in recent decades.
METHODS:
Data from 4,147 women who reported being sterile from a tubal sterilization in the 1995, 2002 and 2006‒2010 waves of the National Survey of Family Growth were analyzed using chi-square and Wald tests and binary logistic regression analyses. Predicted probabilities were calculated to determine the likelihood of desire for procedure reversal by wave and educational level.
RESULTS:
The prevalence of desire for sterilization reversal was 18% in 1995, and rose to 23% in 2002 and 25% in 2006‒2010—which represents a 41% increase. Overall, women with a bachelor’s degree were less likely than those who had not finished high school to desire a reversal (odds ratio, 0.2), and this educational differential was larger in 2006‒2010 than in earlier waves. Predicted probabilities indicate that 9% of sterilized women with less than a high school education and 8% of those with a bachelor’s degree expressed a desire for procedure reversal in 1995, as did 15% and 3%, respectively, in 2006‒2010.
CONCLUSION:
Future research should consider how insurance coverage of all methods under the Affordable Care Act may affect use of sterilization and desire for reversal.
In the United States, 16% of women of reproductive age rely on female sterilization for fertility control.1 Sterilization has many advantages; it is a cost-effective, highly effective, “forgettable” contraceptive method.2 Its main drawback is that procedures are not necessarily reversible if childbearing preferences change. Nearly one-quarter of U.S. women with unreversed tubal ligations in 2002 reported that they desired a reversal.3 Both use of female sterilization and desire for reversal are disproportionately concentrated among women with lower levels of education. One-third of U.S. women aged 22‒44 with less than a high school education relies on female sterilization, compared with one in 10 of those with a bachelor’s degree.1 Women with less education are more likely to request information on sterilization reversal4 and to express a desire for reversal of the procedure,3,5,6 and they are less likely than better educated women to agree that sterilization was a good choice for them.7
Efforts to reduce persistently high levels of desire for sterilization reversal need to be grounded in a thorough understanding of current levels and socioeconomic inequalities. However, recent research on this topic is scarce. Most important, remarkably little is known about the overall level of desire for sterilization reversal after 2002. While Grady and colleagues6 provided an overall estimate—28%—based on the 2006‒2010 National Survey of Family Growth (NSFG), this estimate appears to pertain only to women with a history of unintended pregnancy, rather than to all sterilized women.
Several developments may have affected levels of desire for reversal of more recent sterilizations. First, the past two decades have seen the increased availability and widespread promotion of long-acting reversible contraceptive (LARC) methods—the IUD and implant8—which provide a reversible alternative to women in need of highly effective, long-term contraception.2 This may reduce the numbers of women who turn to sterilization but feel ambivalent about the method’s lack of reversibility. In addition, there has been a dramatic increase in private insurance coverage of reversible contraceptives: Whereas 28% of typical plans covered the five leading reversible prescription methods in 1993, some 86% did in 2002.9 This increase, which was the result of state contraceptive mandates and related policy changes, reduced the gap between the level of coverage for these methods and the level for sterilization—which was 87% in 1993 and 89% in 2002.9 The trend toward increased contraceptive coverage and options has continued as a result of the Women’s Preventive Services Guidelines under the Patient Protection and Affordable Care Act, which required insurance plans (excluding grandfathered ones)10 to cover “all Food and Drug Administration approved contraceptive methods, sterilization procedures, and patient education and counseling for all women with reproductive capacity” with no cost sharing beginning in 2012‒2013.
Increased availability and affordability of reversible contraceptives may also have altered socioeconomic differentials in the desire for sterilization reversal. Yet to our knowledge, no study has examined if and how educational differentials in desire for procedure reversal have changed in recent decades. Moreover, previous research examining socioeconomic patterns in the desire for reversal was solely descriptive5 or relied on practice-based, rather than nationally representative, samples.4,7 There have been two important exceptions: a multivariate analysis of the 2002 NSFG, which found no association between desire for sterilization reversal and poverty level or education3 (although education was assessed using only two categories); and a multivariate examination of the 2006‒2010 NSFG,6 which found that women with a high school education were less likely to express a desire for reversal than were those with less education. In our read of the latter analysis, however, it appears to apply to women with at least a college degree, rather than women with a high school diploma. While even this reading would confirm a negative association between education and desire for sterilization reversal in 2006‒2010, whether this association was stronger or weaker than it had been in previous years remains unclear.
In this study, we consider changes over time in U.S. women’s reported desire for sterilization reversal, as well as changes in educational differentials in the desire for reversal. By so doing, we aim to provide much-needed context for efforts to lower the persistently high levels of desire for sterilization reversal in the United States.
METHODS
Data and Sample
Data for this study were drawn from the 1995, 2002 and 2006‒2010 waves of the NSFG.* This survey—designed and administered by the National Center for Health Statistics11—has been conducted periodically since 1973. NSFG data are representative of the U.S. noninstitutionalized population aged 15‒44 when properly weighted, and include oversamples of teenagers, blacks and Hispanics. In-home interviews were conducted by trained female staff using computer-assisted personal interviewing. Overall, 10,847 women were interviewed for the 1995 wave, 7,643 for 2002 and 12,279 for 2006‒2010; the corresponding response rates were 79%, 80% and 78%.12–14 Institutional review board approval was not required for this secondary analysis of deidentified public-use data.
Women who were currently sterile from a tubal sterilization and who reported no other sterilization operation (e.g., hysterectomy) were asked about their desire for a reversal of the procedure. We excluded women who reported that their tubal sterilization was performed solely for medical, as opposed to contraceptive, purposes. To increase comparability across survey waves, and following Borrero and colleagues,3 we also excluded women who reported their racial or ethnic background as “other,” because this category is very small and heterogeneous, and shows considerable variation across surveys.
Measures
Our dependent variable—desire for sterilization reversal—was measured with the following question: “As things look to you now, if your tubal sterilization could be reversed safely, would you want to have it reversed? Would you say definitely yes, probably yes, probably no, or definitely no?” As in previous studies based on NSFG data,3,6 women who responded “definitely yes” or “probably yes” were classified as expressing desire for reversal.
The primary independent variable is educational level. We distinguished among four categories: less than high school, completed high school, some college and completed college. We also considered a number of other measures that have been associated with desire for sterilization reversal.4,5 Sociodemographic characteristics included are race or ethnicity (white, Hispanic, black), nativity (U.S.-born, foreign-born) and religion of upbringing (Protestant; Catholic; other or none). Reproductive characteristics included are parity (0‒1; two; three or more), age at first birth (younger than 20; 20‒24; 25 or older or no births), age at sterilization (younger than 25, 25‒29, 30‒34, 35 or older), and a measure combining union status at interview and whether this union had been formed after sterilization (married, no new union; married, new union; cohabiting, no new union; cohabiting, new union; single). Finally, we included measures for survey wave and months since sterilization (0‒60, 61‒120, more than 120).
Analysis
The analysis involved three steps. First, for all survey waves combined, we examined the level of desire for sterilization reversal and used chi-square tests to identify bivariate associations between this and education, wave, and sociodemographic and reproductive characteristics. Second, for each wave, we determined the level of desire for a reversal by educational level and assessed associations between education and such desire, again with chi-square tests. This allowed us to determine whether the level of and educational differentials in desire for reversal had changed over the past two decades.
In the third step, for all waves combined, we used binary logistic regression analysis to examine the level of and educational differentials in desire for sterilization reversal, while controlling for sociodemographic and reproductive characteristics. Model 1 regressed desire for reversal on educational level, wave and the interaction between these measures. Model 2 included sociodemographic characteristics to determine if associations were altered by their addition. In model 3, we also controlled for reproductive characteristics. Wald tests were used to identify variables that were associated with desire for reversal in each regression model. Predicted probabilities were then calculated on the basis of model 3 to consider variation in the desire for sterilization reversal by wave and educational level. Because of potential endogeneity between education and sterilization, we performed sensitivity analyses using an alternative education variable that ignored information on high school diplomas and bachelor’s degrees obtained after sterilization* (i.e., we assigned respondents to the educational level completed prior to sterilization).
Unless noted otherwise, all differences mentioned in the following section are statistically significant. Analyses and descriptive statistics were conducted using Stata 14, and were adjusted for the NSFG’s complex sample design using the svy command.
RESULTS
Descriptive Findings
The majority of sterilized women in our analytic sample had a high school education or less (66%) and were white (61%), U.S.-born (88%) and of Protestant upbringing (57%—Table 1). Most had three or more children (54%), had their first birth before age 25 (79%), were sterilized when 25‒34 years old (61%) and were married to the same partner at the time of the survey as at the time of the procedure (52%).
TABLE 1.
Percentage distribution of women aged 15‒44 who were currently sterile from a tubal ligation, and percentage who desired sterilization reversal, by selected characteristics, National Survey of Family Growth, 1995, 2002 and 2006‒2010
| Characteristic | % of total (N=4,147) |
% desiring reversal |
|---|---|---|
| All | 100.0 | 21.8 (20.4‒23.9) |
|
Wave |
** | |
| 1995 | 36.6 | 17.8 (16.0‒19.7) |
| 2002 | 33.4 | 23.3 (19.9‒27.0) |
| 2006‒2010 | 30.0 | 25.1 (22.1‒28.5) |
|
Education |
*** | |
| <high school | 31.0 | 28.8 (26.0‒31.8) |
| Completed high school | 34.9 | 20.5 (17.6‒23.8) |
| Some college | 24.0 | 18.7 (15.6‒22.4) |
| Completed college | 10.1 | 12.2 (8.7‒16.7) |
|
Race/ethnicity |
*** | |
| White | 61.2 | 18.5 (16.2‒21.1) |
| Hispanic | 19.3 | 27.5 (24.3‒30.9) |
| Black | 19.6 | 26.6 (23.2‒30.4) |
|
Nativity |
||
| U.S.-born | 87.9 | 21.9 (20.1‒23.9) |
| Foreign-born | 12.1 | 21.1 (16.9‒25.8) |
|
Religion of upbringing |
||
| Protestant | 57.4 | 22.5 (20.2‒24.9) |
| Catholic | 32.8 | 21.1 (18.5‒23.8) |
| Other/none | 9.7 | 20.5 (15.1‒27.3) |
|
Parity |
** | |
| 0‒1 | 8.3 | 14.9 (11.0‒19.9) |
| 2 | 38.0 | 20.3 (17.9‒22.9) |
| ≥3 | 53.7 | 24.0 (21.4‒26.7) |
|
Age at first birth |
*** | |
| <20 | 40.6 | 28.1 (25.4‒30.9) |
| 20‒24 | 38.1 | 20.2 (17.5‒23.1) |
| ≥25/no births | 21.4 | 12.8 (10.3‒15.9) |
|
Age at sterilization |
*** | |
| <25 | 24.5 | 33.1 (29.2‒37.2) |
| 25‒29 | 34.4 | 23.6 (20.8‒26.8) |
| 30‒34 | 26.3 | 15.3 (12.8‒18.1) |
| ≥35 | 14.9 | 10.6 (7.7‒14.4) |
|
Union status at interview and union formation after sterilization |
*** | |
| Married, no new union | 51.9 | 14.8 (12.9‒17.0) |
| Married, new union | 9.8 | 39.1 (32.0‒46.7) |
| Cohabiting, no new union | 5.4 | 19.5 (13.9‒26.7) |
| Cohabiting, new union | 4.4 | 28.9 (20.6‒39.0) |
| Single | 28.5 | 27.9 (24.6‒31.5) |
|
Months since sterilization |
||
| 0‒60 | 38.3 | 20.8 (18.3‒23.5) |
| 61‒120 | 30.9 | 22.5 (19.8‒25.4) |
| >120 | 30.9 | 22.5 (19.1‒26.2) |
p<.01.
p<.001.
Notes: Symbols opposite names of characteristics indicate associations based on results of chi-square tests. Percentages may not total 100.0 because of rounding. Figures in parentheses are 95% confidence intervals. All percentages are weighted.
The prevalence of women’s desire for sterilization reversal was 22% overall: 18% in the 1995 wave, 23% in 2002 and 25% in 2006‒2010. This represents a 41% increase across all three waves. Prevalence was higher among less-educated women than among their better educated counterparts: 29% among those with less than a high school education, 21% among those with a high school diploma, 19% among those with some college education and 12% among those with a college degree. Prevalence of desire for reversal was particularly high among Hispanics and blacks, and among women who had at least three children, had experienced their first birth before turning 25, had undergone sterilization before 30, and were single or in a coresident relationship that was formed after sterilization.
In the bivariate analysis, the educational differential in desire for sterilization reversal was negative for the earliest and most recent survey waves (Table 2). In 1995, sterilized women with less than a high school education were twice as likely to desire a reversal as were those with a bachelor’s degree (25% vs. 12%). By 2006‒2010, desire for reversal had increased among women with a high school education or less, but had plummeted among those with a bachelor’s degree. This resulted in a widened education gap; in 2006‒2010, sterilized women who had not completed high school were eight times as likely to want a reversal as were those with a bachelor’s degree (33% vs. 4%).
TABLE 2.
Percentage of women currently sterile from a tubal ligation who desired sterilization reversal, by educational level, according to survey wave
| Educational level | 1995 |
2002 |
2006‒2010 |
|||
|---|---|---|---|---|---|---|
| N | % desiring reversal |
N |
% desiring reversal |
N |
% desiring reversal |
|
| <high school |
548 |
25.1 (21.2‒29.5)*** | 302 | 28.5 (23.3‒34.3) | 429 | 33.4 (28.3‒39.0)*** |
| Completed high school |
752 |
14.5 (11.9‒17.6) | 268 | 23.0 (16.5‒31.0) | 475 | 26.8 (20.8‒33.9) |
| Some college |
377 |
16.1 (12.5‒20.5) | 274 | 19.3 (14.2‒25.7) | 309 | 20.9 (15.1‒28.2) |
| Completed college |
165 |
12.2 (8.0‒18.2) | 102 | 19.2 (11.5‒30.1) | 145 | 4.3 (1.8‒9.5) |
p<.001.
Notes: p values indicate overall differences among education categories based on results of chi-square tests. Figures in parentheses are 95% confidence intervals. All percentages are weighted.
Multivariate Findings
Model 1 of the multivariate analysis shows that education was negatively associated with desire for sterilization reversal: Women who had attended some college or had a college degree were less likely than those who had not completed high school to desire reversal (odds ratios, 0.5 and 0.1, respectively—Table 3). In addition, the educational differential in desire for reversal was greater in 2006‒2010 than in earlier waves, as illustrated by the interactions between wave and completed college (4.7 for 1995 and 6.7 for 2002). These associations changed little in subsequent models, which suggests that they are not an artifact of differences in sociodemographic or reproductive characteristics. Even though one of the comparisons for survey wave is significant in model 1, the full variable is not associated with the outcome.* However, this variable becomes significant in models 2 and 3, indicating that the level of desire for sterilization reversal increased between 1995 and 2006‒2010. Sensitivity analyses using the alternative education variable—excluding degrees obtained after undergoing sterilization—produced similar findings (not shown).
TABLE 3.
Odds ratios (and 95% confidence intervals) from binary logistic regression analyses assessing associations between women’s desire for sterilization reversal and selected characteristics
| Characteristic | Model 1 | Model 2 | Model 3 |
|---|---|---|---|
| Education | *** | *** | *** |
| <high school (ref) | 1.00 | 1.00 | 1.00 |
| Completed high school | 0.73 (0.49‒1.10) | 0.69 (0.47‒1.03) | 0.80 (0.53‒1.20) |
| Some college | 0.53 (0.33‒0.84)** | 0.52 (0.33‒0.83)** | 0.61 (0.37‒1.00) |
| Completed college | 0.09 (0.04‒0.20)*** | 0.09 (0.04‒0.22)*** | 0.16 (0.07‒0.39)*** |
|
Wave |
* |
** |
|
| 1995 | 0.67 (0.48‒0.92)* | 0.63 (0.45‒0.87)** | 0.58 (0.41‒0.81)** |
| 2002 | 0.79 (0.56‒1.13) | 0.78 (0.55‒1.11) | 0.71 (0.49‒1.03) |
| 2006‒2010 (ref) | 1.00 | 1.00 | 1.00 |
|
Wave × education |
* |
* |
* |
| 1995 × completed high school | 0.69 (0.42‒1.15) | 0.77 (0.47‒1.28) | 0.86 (0.52‒1.44) |
| 1995 × some college | 1.09 (0.59‒2.00) | 1.14 (0.63‒2.08) | 1.42 (0.77‒2.63) |
| 1995 × completed college | 4.70 (1.75‒12.68)** | 4.87 (1.80‒13.17)** | 5.32 (1.96‒14.40)** |
| 2002 × completed high school | 1.02 (0.54‒1.94) | 1.07 (0.57‒2.02) | 1.14 (0.60‒2.17) |
| 2002 × some college | 1.14 (0.58‒2.24) | 1.16 (0.60‒2.24) | 1.26 (0.62‒2.55) |
| 2002 × completed college | 6.71 (2.30‒19.63)** | 6.40 (2.17‒18.86)** | 6.98 (2.25‒21.60)** |
|
Race/ethnicity |
*** |
*** |
|
| White (ref) | 1.00 | 1.00 | |
| Hispanic | 2.08 (1.54‒2.81)*** | 2.05 (1.49‒2.83)*** | |
| Black | 1.47 (1.12‒1.92)** | 1.23 (0.90‒1.69) | |
|
Nativity |
** |
||
| U.S.-born (ref) | 1.00 | 1.00 | |
| Foreign-born | 0.53 (0.37‒0.78)** | 0.68 (0.47‒1.00) | |
|
Religion of upbringing |
|||
| Protestant (ref) | 1.00 | 1.00 | |
| Catholic | 0.79 (0.60‒1.04) | 0.86 (0.66‒1.14) | |
| Other/none | 0.82 (0.55‒1.23) | 0.81 (0.53‒1.23) | |
|
Parity |
|||
| 0‒1 | 0.68 (0.44‒1.05) | ||
| 2 | 0.86 (0.65‒1.12) | ||
| ≥3 (ref) | 1.00 | ||
|
Age at first birth |
|||
| <20 | 0.96 (0.63‒1.45) | ||
| 20‒24 | 0.91 (0.63‒1.29) | ||
| ≥25/no births (ref) | 1.00 | ||
|
Age at sterilization |
*** |
||
| <25 | 3.87 (2.46‒6.08)*** | ||
| 25‒29 | 2.72 (1.76‒4.17)*** | ||
| 30‒34 | 1.54 (1.01‒2.36)* | ||
| ≥35 (ref) | 1.00 | ||
|
Union status at interview and union formation after sterilization |
*** |
||
| Married, no new union (ref) | 1.00 | ||
| Married, new union | 3.48 (2.36‒5.13)*** | ||
| Cohabiting, no new union | 0.98 (0.61‒1.58) | ||
| Cohabiting, new union | 1.98 (1.18‒3.32)* | ||
| Single | 1.86 (1.42‒2.42)*** | ||
|
Months since sterilization |
** |
||
| 0‒60 (ref) | 1.00 | ||
| 61‒120 | 0.85 (0.66‒1.08) | ||
| >120 | 0.58 (0.43‒0.77)*** |
p<.05.
p<.01.
p<.001.
Notes: Symbols opposite names of characteristics indicate associations based on results of Wald tests. ref=reference group.
Model 2 shows that Hispanics and blacks were more likely than whites to express a desire for sterilization reversal (odds ratios, 2.1 and 1.5, respectively), and that foreign-born women were less likely to do so than U.S.-born respondents (0.5). The associations for blacks and foreign-born respondents lose significance in model 3, suggesting mediation by reproductive characteristics; additional analyses showed that union status for the former and age at sterilization for the latter played key roles (not shown). As found in previous research,15 age at sterilization had a strong correlation with desire for reversal: Women who were younger than 25 at sterilization were much more likely than those who had the procedure at 35 or older to express a desire for reversal (3.9). This greater likelihood decreased monotonically with age at sterilization (2.7 for those aged 25‒29 at sterilization and 1.5 for those aged 30‒34). Furthermore, compared with women who had been continuously married, those who were single had an increased likelihood of expressing a desire for reversal (1.9), as did those who were newly married (3.5) or newly cohabiting (2.0). Finally, respondents who had undergone the procedure more than 120 months before the survey were less likely than those who had done so no more than 60 months ago to want a reversal (0.6).
Figure 1 presents predicted probabilities of the desire for sterilization reversal by survey wave and educational level, based on results of model 3. Probabilities were generated for a typical white, U.S.-born, Protestant-raised woman who had two children, had not given birth before age 25, had been sterilized no more than 60 months before her interview, had been 35 or older when the procedure was done and had been continuously married. Between 1995 and 2002, desire for reversal increased among all such women, regardless of educational level. While it continued to increase among women with lower levels of education after 2002, there was a sharp drop among women with a bachelor’s degree. Consequently, the negative education gradient in desire for reversal was greatest in 2006‒2010. Specifically, predicted probabilities indicate that 9% of women with less than a high school education expressed a desire for procedure reversal in 1995, as did 8% of those with a bachelor’s degree. By 2006‒2010, the percentage of women with the least education who desired a reversal had increased to 15%, while the percentage of those with a college degree had dropped to 3%.
FIGURE 1.
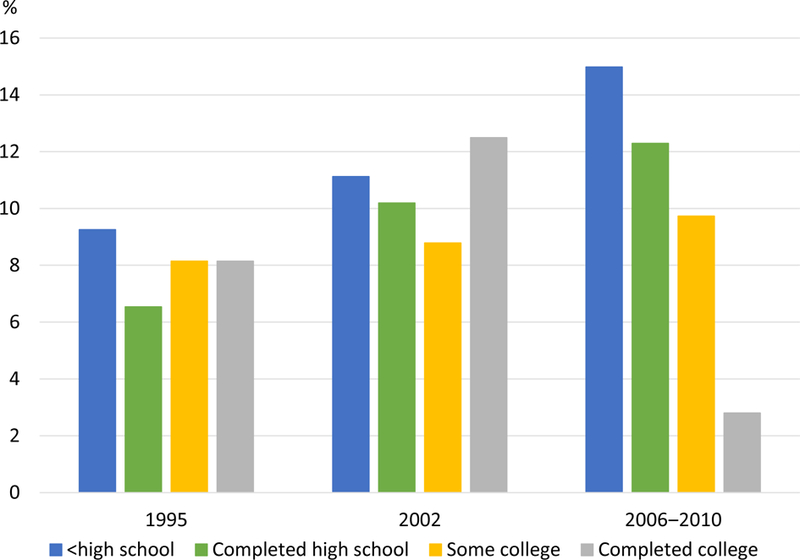
Predicted probability of the desire for sterilization reversal for a white, U.S.-born, Protestant-raised woman who had two children, had not given birth before age 25, had been sterilized no more than 60 months before her interview, had been 35 or older when the procedure was done and had been continuously married, by survey wave and educational level
Notes: Probabilities were calculated on the basis of results of model 3 in Table 3. All percentages are weighted.
DISCUSSION
Two key findings emerged from this study. First, the prevalence of desire for sterilization reversal among U.S. women who have had the procedure rose from 18% in 1995 to 25% in 2006‒2010—a 41% increase. Contrary to our expectations, the recent trend toward increased contraceptive coverage and options does not appear to have lowered the prevalence of women’s desire for reversal. Moreover, reliance on female sterilization was relatively stable, and even declined slightly, between 1995 and 2006‒2010.16,17
Second, the negative association between educational level and desire for sterilization reversal was stronger in the 2006‒2010 wave of the NSFG than in earlier waves. Over our study period, desire for reversal increased among women with a high school education or less, but plunged among women with a bachelor’s degree. These trends suggest that increased contraceptive coverage and options in recent decades have mainly benefited better educated women. Indeed, research has shown that increases in LARC use—primarily IUD use—were highest among socioeconomically advantaged women.18 In addition, the steep growth in private insurance coverage of reversible contraceptives over this period likely disproportionately benefited better educated women, as they are more likely than their counterparts with less education to rely on this type of insurance.19
One reason why desire for sterilization reversal has not declined among women with a high school education or less might be that the growth in IUD use among such women was disproportionately concentrated among those who were spacing births, rather than among those who had completed their desired childbearing.20 Less-educated women who want no more children continue to rely heavily on female sterilization: In the combined 2008‒2010 and 2011‒2013 NSFG waves, 62% of contraceptive users with the lowest level of education reported doing so, whereas 6% said they relied on the IUD. However, a substantial proportion of their counterparts with a college degree opt for the IUD; 11% of such users reported using this method, and 25% sterilization. High reliance on female sterilization among less-educated women who want to limit childbearing, and high—even increasing—levels of desire for procedure reversal may point to the presence of barriers that limit the use of other methods (e.g., the IUD), or to the elevated cost of contraceptive failure for this group.* This interpretation is supported by research showing that educational inequalities in reliance on sterilization are not easily explained by differences in sociodemographic characteristics, such as age at first birth, parity, and union status and history.21
At the same time, it is important to be mindful of rapid changes in U.S. fertility that may be contributing to diverging trends in the desire for sterilization reversal. Of particular importance is the growing educational divergence in family instability,22 as union formation was strongly and positively associated with desire for reversal in our analysis, as well as in previous research.23,24 Recent increases in unmarried childbearing—particularly childbearing within cohabiting relationships—have occurred mainly among women without a college degree.25 This has likely increased the proportion of less-educated women who are cohabiting when they undergo sterilization and, because of the instability of cohabitation in the United States,22 the proportion of such women who experience union change following sterilization. In addition, while divorce rates have fallen in recent decades among women with a college degree, they have risen among those with less than a high school education.26,27 This growing educational divergence in union stability likely contributed to the educational differential in women’s desire for sterilization reversal, even though it does not appear to fully explain it. These trends underscore the importance of informing women about the permanent nature of the method and the availability of long-acting reversible options. Notably, a study of women who had been sterilized in 2002‒2008 found that many believed reversal could easily restore fertility, and that sterilization would reverse itself after five years.28 However, we should keep in mind that some desire for reversal is inevitable, while also realizing that some women may regret not having obtained a sterilization,29 particularly if they subsequently experience an unintended pregnancy.
Limitations
This study has several limitations. First, we used cross-sectional data from sterilized women, rather than prospective longitudinal data from women undergoing the procedure. Thus, we relied on educational level (and other measures) at the time of interview, although early reproductive outcomes may influence educational attainment later in life.30,31 However, sensitivity analyses using an alternative education variable generated similar findings.
Second, desire for sterilization reversal was measured at a single point in time, even though previous research using related measures (e.g., women’s requesting information on reversal and agreeing that sterilization was not a good choice for them) has shown that individuals’ responses may change over time.4,32 While desire for reversal may indicate regret about having had the procedure, it is important to be mindful of the dangers of interpreting this measure in terms of a woman’s regretting the original sterilization decision. What is most relevant for our study is that desiring a sterilization reversal does not necessarily mean that the woman wished she had not had the procedure, and does not mean that she would choose another contraceptive method if she could revisit her decision.5 These issues should be kept in mind when interpreting and comparing results of sterilization “regret” studies, and they provide an important direction for research and future data collection efforts. Furthermore, such efforts could benefit from using a nationally representative sample of women undergoing sterilization and collecting information on several regret measures (including desire for sterilization reversal) and other covariates over time. Such data could also allow the examination of associations between desire for reversal and other, less stable indicators of socioeconomic status, including income and employment.
Finally, we did not use data from the most recent NSFG waves because of a questionnaire routing error that affected the variable assessing desire for sterilization reversal, and trends and patterns in women’s expressed desire for reversal may have changed since 2010. Most important, the Affordable Care Act likely accelerated the trend toward greater contraceptive coverage and options. Indeed, a study that looked at contraceptive use between 2008 and 2014 found a decline in the use of sterilization, especially among low-income women.33 Even though it will likely take time to see the full impact of these changes on women’s expressed desire for sterilization reversal, recent changes in method use suggest that we can expect to observe a decrease in the desire for reversal in the coming years—particularly among socioeconomically disadvantaged women.
Conclusion
While recent decades have seen improvements in contraceptive insurance coverage and method availability, female sterilization rates in the United States remain high. In addition, high levels of desire for reversal have persisted—though we found evidence of a decline among better educated women. Further investigation is needed to examine correlates of the desire for sterilization reversal and how the shift to full coverage of all contraceptive methods under the Affordable Care Act may affect patterns and trends.
Acknowledgments
This research was supported by grant F32HD078037 from the Eunice Kennedy Shriver National Institute of Child Health and Human Development (NICHD) and NICHD grant P2C-HD041022 to the California Center for Population Research, University of California, Los Angeles. The content of this article is the responsibility solely of the authors and does not necessarily represent the official views of the National Institutes of Health.
Footnotes
We did not use data from the most recent NSFG waves (2011‒2013 and 2013‒2015) because, as the result of a questionnaire routing error, women who were not currently married or in an opposite-sex partnership were not asked the question about “expressed desire for sterilization reversal” (source: U.S. Department of Health and Human Services, Public Use Data File Documentation, 2013–2015 National Survey of Family Growth: User’s Guide, 2016, https://www.cdc.gov/nchs/data/nsfg/nsfg_2013_2015_userguide_maintext.pdf#topicspec).
Whereas all three survey waves provide information on the date the respondent obtained a high school diploma, only the 1995 and 2006‒2010 waves provide information on the date she obtained a bachelor’s degree. Only 2% of respondents have different values on this alternative education variable and the one used for the main analyses.
Statistically speaking, it is not recommended that one interpret specific comparisons of a categorical variable in such cases.
Such costs may arise from economic constraints or from policies, such as those regarding family caps for welfare benefits, that deny additional cash aid for infants born to families already receiving assistance.
Contributor Information
Mieke C.W. Eeckhaut, Department of Sociology and Criminal Justice, University of Delaware, Newark..
Megan M. Sweeney, Department of Sociology and California Center for Population Research, University of California, Los Angeles..
Lei Feng, Department of Sociology, University of California, Los Angeles..
REFERENCES
- 1.Daniels K, Daugherty J and Jones J, Current contraceptive status among women aged 15–44: United States, 2011–2013, NCHS Data Brief, 2014, No. 173. [PubMed] [Google Scholar]
- 2.Grimes DA, Forgettable contraception, Contraception , 2009, 80(6):497–499, 10.1016/j.contraception.2009.06.005. [DOI] [PubMed] [Google Scholar]
- 3.Borrero SB et al. , Race, insurance status, and desire for tubal sterilization reversal, Fertility and Sterility , 2008, 90(2):272–277, 10.1016/j.fertnstert.2007.06.041. [DOI] [PMC free article] [PubMed] [Google Scholar]
- 4.Schmidt JE et al. , Requesting information about and obtaining reversal after tubal sterilization: findings from the U.S. Collaborative Review of Sterilization, Fertility and Sterility , 2000, 74(5):892–898, 10.1016/S0015-0282(00)01558-2. [DOI] [PubMed] [Google Scholar]
- 5.Chandra A, Surgical sterilization in the United States: prevalence and characteristics, 1965–95, Vital and Health Statistics , 1998, Series 23, No. 20. [PubMed] [Google Scholar]
- 6.Grady CD et al. , Does a history of unintended pregnancy lessen the likelihood of desire for sterilization reversal? Journal of Women’s Health , 2013, 22(6):501–506, 10.1089/jwh.2012.3885. [DOI] [PMC free article] [PubMed] [Google Scholar]
- 7.Jamieson DJ et al. , A comparison of women’s regret after vasectomy versus tubal sterilization, Obstetrics & Gynecology , 2002, 99(6):1073–1079. [DOI] [PubMed] [Google Scholar]
- 8.Finer LB, Jerman J and Kavanaugh ML, Changes in use of long-acting contraceptive methods in the United States, 2007–2009, Fertility and Sterility , 2012, 98(4):893–897, 10.1016/j.fertnstert.2012.06.027. [DOI] [PMC free article] [PubMed] [Google Scholar]
- 9.Sonfield A et al. , U.S. insurance coverage of contraceptives and the impact of contraceptive coverage mandates, 2002, Perspectives on Sexual and Reproductive Health , 2004, 36(2):72–79, 10.1363/3607204. [DOI] [PubMed] [Google Scholar]
- 10.Health Resources and Services Administration, Women’s preventive services guidelines, 2016, https://www.hrsa.gov/womens-guidelines/index.html. [Google Scholar]
- 11.Groves RM et al. , Planning and development of the continuous National Survey of Family Growth, Vital and Health Statistics , 2009, Series 1, No. 48. [PubMed] [Google Scholar]
- 12.Lepkowski JM et al. , National Survey of Family Growth, Cycle 6: sample design, weighting, imputation, and variance estimation, Vital and Health Statistics , 2006, Series 2, No. 142. [PubMed] [Google Scholar]
- 13.Martinez G, Daniels K and Chandra A, Fertility of men and women aged 15–44 years in the United States: National Survey of Family Growth, 2006–10, National Health Statistics Reports, 2012, No. 51. [PubMed] [Google Scholar]
- 14.Potter FJ et al. , National Survey of Family Growth, Cycle 5: design, estimation, and inference, Vital and Health Statistics , 1997, Series 2, No. 124. [PubMed] [Google Scholar]
- 15.Curtis KM, Mohllajee AP and Peterson HB, Regret following female sterilization at a young age: a systematic review, Contraception , 2006, 73(2):205–210, 10.1016/j.contraception.2005.08.006. [DOI] [PubMed] [Google Scholar]
- 16.Daniels K et al. , Current contraceptive use and variation by selected characteristics among women aged 15–44: United States, 2011–2013, National Health Statistics Reports , 2015, No. 86. [PubMed] [Google Scholar]
- 17.Jones J, Mosher W and Daniels K, Current contraceptive use in the United States, 2006–2010, and changes in patterns of use since 1995, National Health Statistics Reports , 2012, No. 60. [PubMed] [Google Scholar]
- 18.Kavanaugh ML et al. , Characteristics of women in the United States who use long-acting reversible contraceptive methods, Obstetrics & Gynecology , 2011, 117(6):1349–1357, 10.1097/AOG.0b013e31821c47c9. [DOI] [PubMed] [Google Scholar]
- 19.Smith JC and Medalia C, Health insurance coverage in the United States: 2014, Current Population Reports , 2015, Series P-28. [Google Scholar]
- 20.Sweeney MM, Eeckhaut MCW and Gipson JD, Reconsidering (in)equality in the use of IUDs: the changing context of contraceptive choice across the reproductive lifespan, paper presented at the annual meeting of the Population Association of America, Washington, DC, March 31–April 2, 2016. [Google Scholar]
- 21.Eeckhaut MCW and Sweeney MM, Gender, class, and contraception in ten low-fertility countries: the perplexing links between sterilization and disadvantage, Population Studies , 2016, 70(1):39–58, 10.1080/00324728.2015.1122209. [DOI] [PMC free article] [PubMed] [Google Scholar]
- 22.Cherlin A, Demographic trends in the United States: a review of research in the 2000s, Journal of Marriage and the Family , 2010, 72(3):403–419, 10.1111/j.1741-3737.2010.00710.x. [DOI] [PMC free article] [PubMed] [Google Scholar]
- 23.Eeckhaut MCW and Sweeney MM, Understanding sterilization regret in the United States: the role of relationship context, Journal of Marriage and Family , 2018, 10.1111/jomf.12500. [DOI] [PMC free article] [PubMed] [Google Scholar]
- 24.Wilcox LS, Chu SY and Peterson HB, Characteristics of women who considered or obtained tubal reanastomosis: results from a prospective study of tubal sterilization, Obstetrics & Gynecology , 1990, 75(4):661–665. [PubMed] [Google Scholar]
- 25.Kennedy S and Bumpass L, Cohabitation and children’s living arrangements: new estimates from the United States, Demographic Research , 2008, 19:1663–1692, 10.4054/DemRes.2008.19.47. [DOI] [PMC free article] [PubMed] [Google Scholar]
- 26.Martin SP, Trends in marital dissolution by women’s education in the United States, Demographic Research , 2006, 15(20):537–560, 10.4054/DemRes.2006.15.20. [DOI] [Google Scholar]
- 27.Schwartz CR and Han H, The reversal of the gender gap in education and trends in marital dissolution, American Sociological Review , 2014, 79(4):605–629, 10.1177/0003122414539682. [DOI] [PMC free article] [PubMed] [Google Scholar]
- 28.Borrero S et al. , Racial variation in tubal sterilization rates: role of patient-level factors, Fertility and Sterility , 2011, 95(1):17–22, 10.1016/j.fertnstert.2010.05.031. [DOI] [PMC free article] [PubMed] [Google Scholar]
- 29.Gilliam M et al. , A qualitative study of barriers to postpartum sterilization and women’s attitudes toward unfulfilled sterilization requests, Contraception , 2008, 77(1):44–49, 10.1016/j.contraception.2007.09.011. [DOI] [PubMed] [Google Scholar]
- 30.Kane JB et al. , The educational consequences of teen childbearing, Demography , 2013, 50(6):2129–2150, 10.1007/s13524-013-0238-9. [DOI] [PMC free article] [PubMed] [Google Scholar]
- 31.Sweeney MM and Raley RK, Race, ethnicity, and the changing context of childbearing in the United States, Annual Review of Sociology , 2014, 40:539–558, 10.1146/annurev-soc-071913-043342. [DOI] [PMC free article] [PubMed] [Google Scholar]
- 32.Hillis SD et al. , Poststerilization regret: findings from the United States Collaborative Review of Sterilization, Obstetrics & Gynecology , 1999, 93(6):889–895. [DOI] [PubMed] [Google Scholar]
- 33.Kavanaugh ML and Jerman J, Contraceptive method use in the United States: trends and characteristics between 2008, 2012 and 2014, Contraception, 2018, 97(1):14–21, 10.1016/j.contraception.2017.10.003. [DOI] [PMC free article] [PubMed] [Google Scholar]