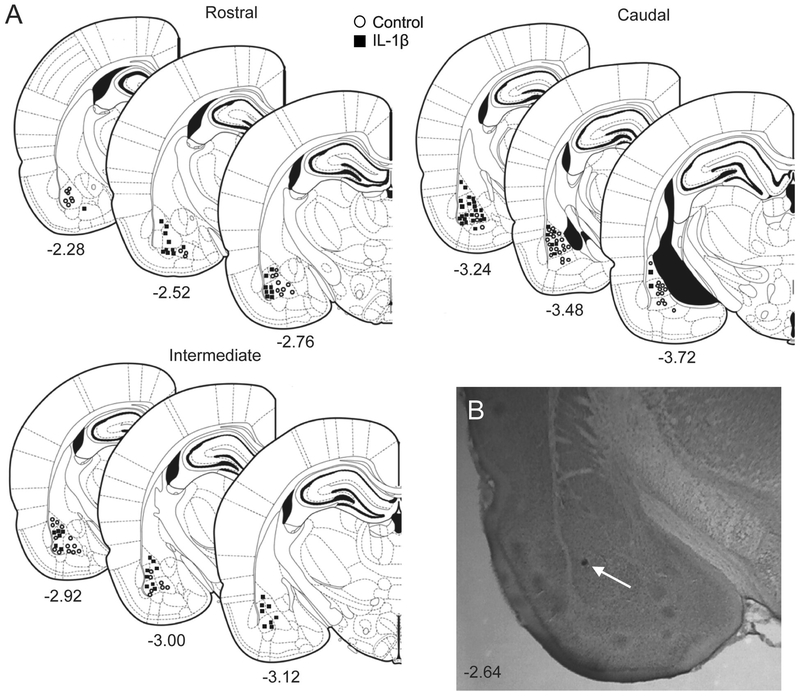
Figure 2: Location of recording sites in BLA.
Recording sites in the BLA were reconstructed from brain sections (Paxinos and Watson, 2009) after localization of the Pontamine Sky Blue dye ejected at the conclusion of in vivo recording. (A) Brain sections containing BLA recording sites are shown schematically, listed by bregma level. Recording sites from control group are marked by open circles while those from IL-1β group are shown by black boxes. The numbers below each section indicates distance (in mm) from bregma. (B) An example histological section of a rat brain counterstained with Cresyl Violet showing the location of ejected Pontamine Sky Blue dye in the BLA from an electrophysiological recording (indicated by white arrow).

