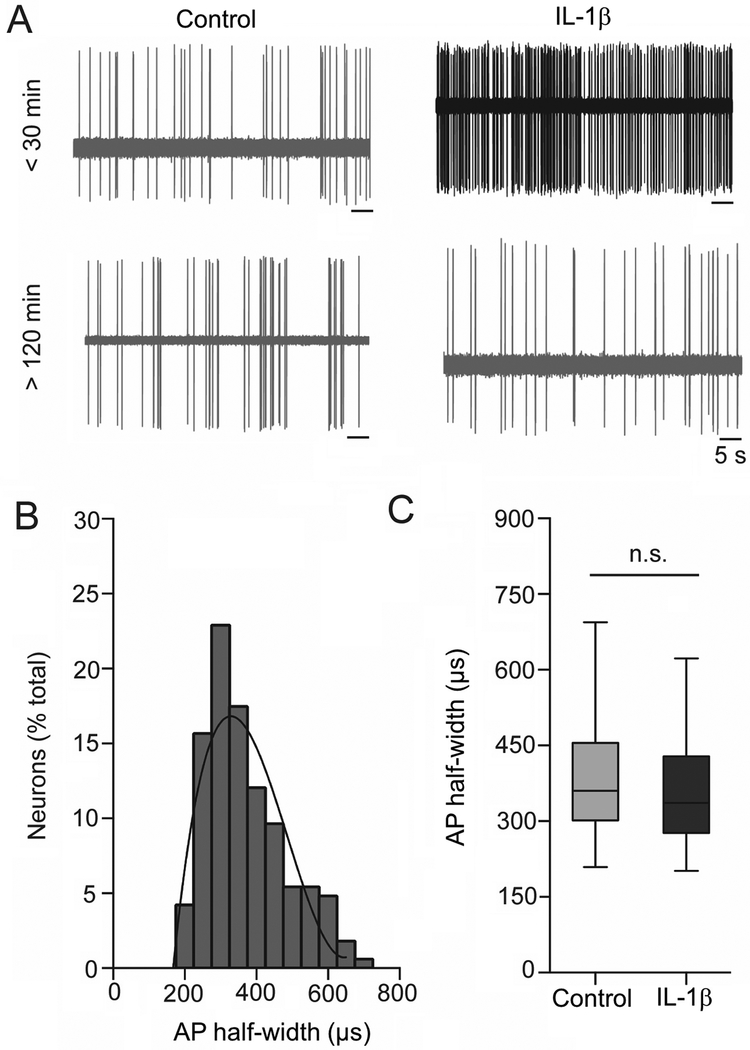
Figure 3: Extracellular electrophysiological recordings from BLA neurons.
(A) Neuronal firing traces in the control and IL-1β groups at <30 min (upper panel) and later time points (>120 min, lower panel) post-treatment. (B) BLA neurons can be tentatively separated into projection neurons and interneurons based on AP half-width. Frequency distribution of the AP half-widths (μs) from all recorded neurons is plotted here. The data distribution is best fit with one third-order polynomial curve, instead of two curves, indicating that all recordings were obtained from a single population of neurons, most likely BLA projection neurons. (C) There is no significant difference between AP half-widths of neurons from post-treatment control and IL-1β groups (p=0.355, Mann-Whitney U test), indicating that similar population of BLA neurons were sampled in both groups. n.s. indicates non-significance. Data represented with box and whisker plot showing the minimum, 25th percentile, median, 75th percentile and maximum values.

