Abstract
Background:
The cardiac sodium channel Nav1.5 is essential for the physiological function of the heart and causes cardiac arrhythmias and sudden death when mutated. Many disease-causing mutations in Nav1.5 cause defects in protein trafficking, a cellular process critical to the targeting of Nav1.5 to cell surface. However, the molecular mechanisms underlying the trafficking of Nav1.5, in particular, the exit from the endoplasmic reticulum (ER) for cell surface trafficking, remain poorly understood.
Methods and Results:
Here we investigated the role of the SAR1 GTPases in trafficking of Nav1.5. Overexpression of dominant-negative mutant SAR1A (T39N or H79G) or SAR1B (T39N or H79G) significantly reduces the expression level of Nav1.5 on cell surface, and decreases the peak sodium current density (INa) in HEK/Nav1.5 cells and neonatal rat cardiomyocytes. Simultaneous knockdown of SAR1A and SAR1B expression by siRNAs significantly reduces the INa density, whereas single knockdown of either SAR1A or SAR1B has minimal effect. Computer modeling showed that the three-dimensional structure of SAR1 is similar to RAN. RAN was reported to interact with MOG1, a small protein involved in regulation of the ER exit of Nav1.5. Co-immunoprecipitation showed that SAR1A or SAR1B interacted with MOG1. Interestingly, knockdown of SAR1A and SAR1B expression abolished the MOG1-mediated increases in both cell surface trafficking of Nav1.5 and the density of INa.
Conclusions:
These data suggest that SAR1A and SAR1B are the critical regulators of trafficking of Nav1.5. Moreover, SAR1A and SAR1B interact with MOG1, and are required for MOG1-mediated cell surface expression and function of Nav1.5.
Keywords: SAR1A and SAR1B, SCN5A, Nav1.5 sodium channel, MOG1, trafficking
1. Introduction
The human SCN5A gene is located on chromosome 3p21, and encodes the cardiac voltage-gated sodium channel α-subunit Nav1.5 [1]. Nav1.5 plays an essential role in the initiation and propagation of the cardiac action potential [2]. Mutations in SCN5A/Nav1.5 cause cardiac arrhythmias, including long QT syndrome (LQTS), Brugada syndrome (BrS), idiopathic ventricular tachycardia (VF) and fibrillation (VF), sudden infant death, sick sinus syndrome (SSS) and atrial fibrillation (AF) [3-7]. Little is known about the folding, maturation, translocation from the ER, and targeting of Nav1.5 to cell surface. However, numerous loss-of-function mutations in SCN5A disrupt the trafficking of Nav1.5, leading to decreased Nav1.5 expression on cell surface and reduced sodium current densities, and cause BrS, idiopathic VT/VF, and SSS [8-10]. However, the mechanisms by which Nav1.5 missense mutations cause impaired Nav1.5 trafficking to the cell surface are mostly unknown. Therefore, understanding the molecular basis of Nav1.5 trafficking may yield critical molecular insight into the pathogenesis of cardiac arrhythmias, and may suggest novel therapeutic strategies for prevention or treatment of cardiac arrhythmias.
Protein trafficking is regulated by small GTPases. Typically, these proteins have sequence homology and share several conserved domains, including consensus amino acid sequences responsible for interaction with guanosine-5'-diphosphate (GDP) and guanosine-5'-triphosphate (GTP), and a region for interacting with downstream effectors. SAR1 belongs to the family of small GTPases, and regulates the formation or assembly of the ER-derived coat protein complex II (COPII) vesicles involved in the ER export of proteins [11]. There are two paralogs of the SAR1 genes, SAR1A on chromosome 10q22 and SAR1B on chromosome 5q23-q31.1 (http://www.ensembl.org/index.html). Bioinformatics analysis showed that SAR1A and SAR1B share 89.9% identify at the amino acid level. However, the role of SAR1A or SAR1B GTPases in ER export of Nav1.5 is unknown and indeed the critical regulators of ER export of Nav1.5 remain poorly defined. We previously reported that MOG1 plays a role in ER export of Nav1.5 [12]. MOG1 is a small protein that was initially identified in S. cerevisiae as the multicopy suppressor of temperature sensitive gst1, a homolog to human RAN [13]. We showed that MOG1 interacted with an intracellular loop II of Nav1.5, and facilitated Nav1.5 cell surface expression to increase the sodium current density [14]. Knockdown of MOG1 expression caused retention of Nav1.5 in the ER and reduced targeting of Nav1.5 to cell surface, in particular, to the caveolae structure on cell surface [12]. In this study, we identified the essential role of SAR1A and SAR1B GTPases in the trafficking of Nav1.5 and generation of cardiac sodium current (INa). We further showed that SAR1A and SAR1B interacted with MOG1, and are required for MOG1-mediated trafficking of Nav1.5 to cell surface.
2. Materials and methods
2.1. Plasmids, mutagenesis, antibodies, and cell lines
The expression construct for the human cardiac sodium channel gene SCN5A (hH1a) in pcDNA3 (pcDNA3-SCN5A) was previously described [2]. Plasmids for GST-SAR1A (RSB3771) in pGEX2T and GST-SAR1B in pGEX2T (RSB3772) were described previously [15]. Plasmids Flag-SAR1A wild type and Flag-SAR1A:T39N were subcloned from RSB3771 and RSB3773 (GST-SAR1A:T39N in pGEX2T). Plasmids Flag-SAR1A:H79G was generated with a PCR-based mutagenesis method [16] using the wild type Flag-SAR1A as a template. Plasmids Flag-SAR1B wild type, Flag-SAR1B:T39N and Flag-SAR1B:H79G were described previously [17]. Plasmids for GFP-SAR1A wild type, GFP-SAR1A:T39N and GFP-SAR1A:H79G in pEGFP-C1 were subcloned from plasmids Flag-SAR1A wild type, Flag-SAR1A:T39N and Flag-SAR1A:H79G, respectively. Plasmids for GFP-SAR1B wild type, GFP-SAR1B:T39N and GFP-SAR1B:H79G in pEGFP-C1 were subcloned from plasmids Flag-SAR1B wild type, Flag-SAR1B:T39N and Flag-SAR1B:H79G, respectively.
A rabbit anti-Nav1.5 antibody (ASC-005, Alomone) was used at a dilution factor of 1:1000. A mouse anti-β-tubulin antibody (Millipore) and a mouse anti-FLAG (M185-3L, MBL) antibody were used at a dilution factor of 1:5000. A rabbit anti-FLAG antibody was used at a dilution factor of 1:1000 (20543-1-AP, Proteintech). A mouse anti-GFP antibody was used at a dilution factor of 1:2000 (66002-1-Ig, Proteintech). The goat anti-rabbit IgG (B900610) and goat anti-mouse IgG (B900620) were purchased from Proteintech, and used at a dilution factor of 1:10000. The goat anti-rabbit and anti-mouse IgG conjugated to HRP secondary antibodies were purchased from Millipore and used at a dilution factor of 1:10000. The goat anti-rabbit and anti-mouse IgG conjugated to IRDye secondary antibodies were used at a dilution factor of 1:10000 (Licor Biosciences, Lincoln, NE, USA).
The tsA201 cell line was from kindly provided by Charles Antzelevitch. HEK293 cell line was purchased from ATCC. A stable HEK293 cell line that over-expresses Nav1.5, HEK293/Nav1.5, was a generous gift from Glenn E. Kirsch [14, 18]. Cells were cultured and transfected as previously described [18].
2.2. Isolation and analysis of the expression level of cell-surface protein Nav1.5
Transfected cells were used for preparation of plasma membrane protein extracts using EZ-Link Sulfo-NHS-SS-Biotin (Pierce) as described previously [12, 18, 19]. Forty-eight hours after HEK293 cells were transiently co-transfected with 5 μg pcDNA3-SCN5A and 10 μg Flag-SAR1A constructs or the vector pcDNA3 using 20 μL lipofectamine 2000 (Invitrogen) respectively. Proteins on the PM were biotinylated at 4°C using EZ-Link Sulfo-NHS-SS-Biotin (Pierce) for 30 minutes. After quenching with 100 mM glycine in PBS, cells were lysed. One tenth of the lysates were saved for total protein analysis, the rest of the lysate containing biotinylated proteins from each treatment group was incubated with NeutrAvidin Agarose Resins (Pierce) to immobilize and precipitate the biotinylated proteins. The protein-Agarose complex were washed three times with PBS, resuspended in 2⃗SDS-PAGE sample buffer containing 50 mM DTT, and analyzed by Western blot analysis with an anti-Nav1.5 antibody, anti-β-tubulin antibody and anti-FLAG antibody.
2.3. RNA interference
The siRNAs against human SAR1A, SAR1B and scrambled control siRNA were designed and synthesized by GenePharma (Suzhou, Jiangsu, China). The sequences of the sense strands were as follows: SAR1A siRNA1, 5'-CCAACACUACAUCCGACAUTT-3'; SAR1A siRNA2, 5'-CCAAUGUGCCAAUCCUUAUTT-3'; and SAR1B siRNA1, 5'-CUACCUUCCUGCUAUCAAUTT-3'. The primers used in the RT-PCR analysis were as follows: SAR1A, forward primer 5'- CCAACACTACATCCGACATCAGAAGA-3', reverse primer 5'-TGCATCTGTTCTGTCAATTTTGTTACC-3'; SAR1B, forward primer 5'-GGGTGGACATGTTCAAGCTCGA-3', reverse primer 5'-TCGCAACCTCTCTTCACTGATGG-3'; and GAPDH, forward primer 5'-CAAAGTTGTCATGGATGACC-3', reverse primer 5'-CCATGGAGAAGGCTGGGG-3'. The efficiency of siRNA knockdown was determined by real-time RT-PCR analysis using ABI 7900 system (Applied Biosystems, Foster city, CA) as described [12].
2.4. Electrophysiological studies
Whole cell voltage clamp recordings of INa performed were as described previously [14, 20-23]. The pipette was filled with a solution containing 20 mM NaCl, 130 mM CsCl, 10 mM EGTA, and 10 mM HEPES (pH 7.2 adjust with CsOH). The bath solution contained 70 mM NaCl, 80 mM CsCl, 5.4 mM KCl, 2mM CaCl2, 10 mM HEPES, 10 mM glucose, and 1 mM MgCl2 (pH 7.4 adjust with CsOH). All reagents were obtained from Sigma-Aldrich (St Louis, MO). INa was recorded using a whole-cell voltage-clamp recording method with an Axon multiclamp 700B patch-clamp amplifier using the Digidata1440A (Axon Instruments, Sunnyvale, CA) at room temperature (22°C). INa was filtered at 5 kHz with a 4-pole Bessel filter and sampled at 50 kHz. Pipettes were pulled by a P-97 micropipette puller (Sutter Instruments, Novato, CA) with resistance between 2-3 MΏ when filled with the internal pipette solution. Serial resistance was electronically compensated at around 80% to minimize voltage errors. Details of each pulse protocol were shown schematically in related figures. INa density was normalized using the cell capacitance. All data acquisition and analysis were performed using a combination of Clampfit 10.2 (Molecular Devices), Microsoft Excel, and Origin 8.0 (Microcal Software, Northampton, MA).
2.5. Isolation of neonatal rat cardiomyocytes
Neonatal rat cardiomyocytes were isolated as described previously [12, 14]. 10–15 hearts were excised from euthanized 0-3-day-old Sprague-Dawley neonatal rats, washed in ice-cold PBS for several times to remove blood cells, minced into small pieces of approximately 1 mm3, and incubated in the isolation buffer (0.05% collagenase B from Roche and 0.05% trypsin from Amresco in 1 x PBS). Cardiomyocytes were purified using a differential adhesion method to remove cardiac fibroblasts, which attached to culture plates faster than cardiomyocytes.
The isolated cardiomyocytes were cultured in the DMEM medium (Gibco) supplemented with 20% FBS (Gibco) for 24 hours, and transiently co-transfected with a mammalian expression plasmid for GFP (500 ng, as a marker for cells with successful transfection) together with an expression plasmid (1 μg) for SAR1A, SAR1A:T39N, SAR1A:H79G, SAR1B, SAR1B:T39N, SAR1B:H79G or the pCMV10 empty vector control using 4.5 μL jetPRIME® (Polyplus) according to the manufacturer’s instruction. The transfection efficiency for neonatal cardiomyocytes was low (5%~10%), and only the GFP-positive cells with successful transfection were selected for patch-clamping as described previously [12, 14]. The study with animals was approved by the ethics committee of Huazhong University of Science and Technology.
2.6. Structural modeling of the MOG1-Ran and MOG1-SAR1 complexes
The ZDOCK online server was used to perform calculation for the interaction between MOG1 and Ran and between MOG1 and SAR1 (http://zdock.umassmed.edu/) as described [24].
2.7. GST pull-down analysis
The pull-down assay was performed as described previously [14]. The recombinant GST, GST-SAR1A, and GST-SAR1B fusion proteins were produced in BL-21 E. coli strain. Expression of the fusion proteins in E. coli BL21 cells was induced with 0.1 mM isopropylb-D-1-thiogalactopyranoside (IPTG) for 4 hours at 30°C GST and GST-SAR1 proteins were subsequently purified with glutathione-sepharose 4B beads according to the manufacturer’s instruction. Following overnight incubation at 4°C, the beads were washed three times with ice cold PBS. Cells were lysed in a buffer containing 25 mM HEPES, pH7.4, 130 mM NaCl, 20 mM MgCl2, 3 mM EDTA, 0.5% Triton x-100, and protease inhibitors (complete protease inhibitor cocktail tablets, Roche Diagnostics, Indianapolis, IN). The lysate was pre-cleared with GST bound beads for 30 min at 4°C. The pre-cleared lysate was incubated overnight in a rotator at 4°C with GST, GST-SAR1A, or GST-SAR1B bound beads. After three washes with the lysis buffer with 2 mM PMSF in the absence of DTT, SDS loading buffer was added. The eluents were separated in a 10 % SDS-PAGE gel, transferred to PVDF membranes, immune-blotted and imaged using Odyssey infrared imaging system according to manufacturer’s instruction (LiCor Corp, Lincoln, NE).
2.8. Co-immunoprecipitation (Co-IP) analysis
Co-IP experiments were performed as previously described [14, 18]. We transiently co-transfected a mammalian expression plasmid for Flag-tagged MOG1 (MOG1-Flag) together with a GFP-tagged expression plasmid for SAR1A-GFP, SAR1A:T39N-GFP, SAR1A:H79G-GFP, SAR1B-GFP, SAR1B:T39N-GFP or SAR1B:H79G-GFP into HEK293 cells. Forty-eight hours after transfection, the transfected cells were lysed in the buffer containing 150 mM NaCl, 50 mM Tris/HCl, pH 7.5, 1% Nonidet P-40, 2 mM EDTA, and protease inhibitors (complete protease inhibitor cocktail tablets, Roche Diagnostics, Indianapolis, IN). The cell lysate was centrifuged at 13,000g for 15 minutes at 4°C, and pre-cleared with 30 μL of Protein A/G PLUS-Agarose (sc-2003, Santa Cruz) for 30 min at 4°C. An equal volume of the pre-cleared lysate was incubated overnight in a rotator at 4°C with 1.5 μg of a rabbit anti-Flag antibody or 1.5 μg of control anti-rabbit IgG. 30 μL of Protein A/G PLUS-Agarose was added. The antibody-protein A/G PLUS-Agarose complex was incubated for 2 hours in a rotator at 4°C. Following overnight incubation at 4°C, the Protein A/G PLUS-Agarose was washed three times with ice-cold lysis buffer. After three washes with the lysis buffer with 2 mM PMSF, SDS loading buffer was added. The eluents were separated in a 12 % SDS-PAGE gel, and transferred to PVDF membranes. The membranes were subsequently probed with a mouse anti-GFP antibody, and the rest of procedures for Western blot analysis were as previously described by us [18].
For reciprocal Co-IP analysis, 1.5 μg of a mouse anti-GFP antibody was used for immunoprecipitation and the rabbit anti-Flag antibody was used for Western blot analysis. 1.5 μg of anti-mouse IgG antibody was substituted for the anti-GFP antibody as the negative control.
2.9. Statistical analysis
Data are presented as mean ± SEM (standard error of mean). Statistical analysis was performed using a two-tailed Student’s t-test to compare means between two groups and significance was set at p < 0.05 unless otherwise indicated.
3. Results
3.1. Both SAR1A and SAR1B regulate the cell surface expression level of Nav1.5
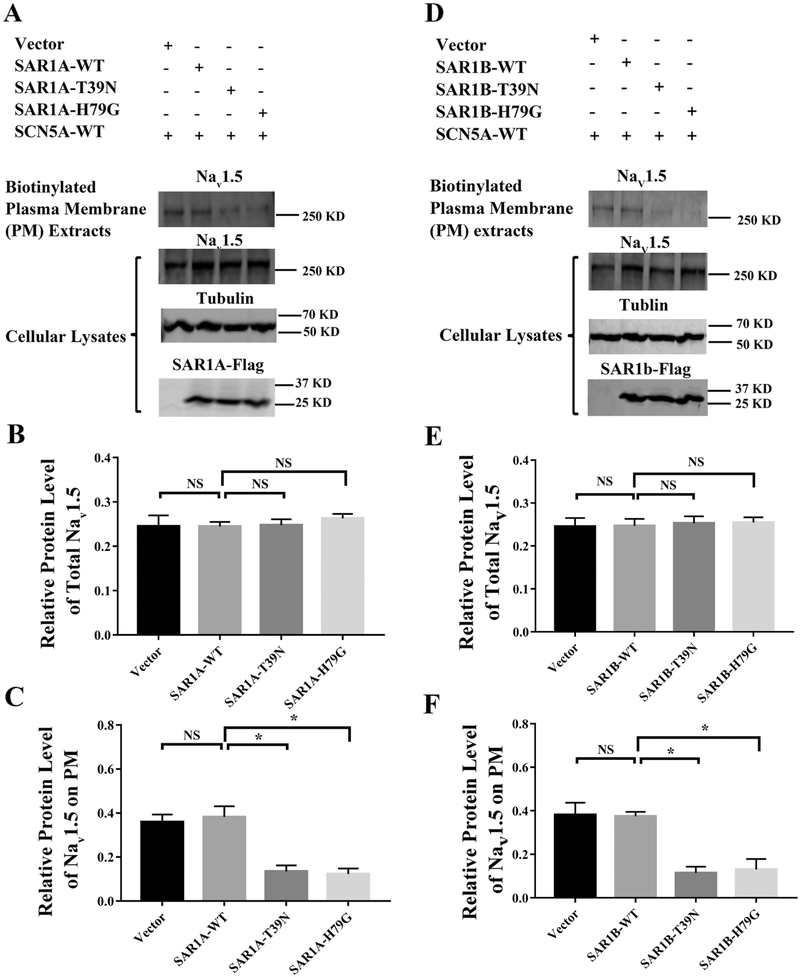
To investigate the potential role of small GTPases in the trafficking of Nav1.5 to the cell surface, we studied the SAR1 GTPases which regulate the ER export of proteins in COPII vesicles [11]. In mammals, there are two SAR1 paralogs, SAR1A and SAR1B [25]. We characterized SAR1A first by examining the level of Nav1.5 in plasma membranes (PM) when the SAR1A function was disrupted by dominant-negative mutations using Western blot analysis. We transiently co-transfected a mammalian expression plasmid for Nav1.5 together with an expression plasmid for a wild type Flag-tagged SAR1A (SAR1A-Flag), or a mutant Flag-tagged SAR1A with a dominant negative mutation T39N (SAR1A:T39N-Flag) or H79G (SAR1A:H79G-Flag) into HEK293 cells, respectively. Forty-eight hours after transfection, the transfected cells were used for preparation of plasma membrane protein extracts using EZ-Link Sulfo-NHS-SS-Biotin as described by us previously [14, 18]. Total cellular lysates were also prepared from the transfected cells, and used as loading control for cell-surface Nav1.5. Western blot analysis with an anti-Nav1.5 antibody showed that mutant SAR1A:T39N-Flag or SAR1A:H79G-Flag significantly decreased the level of cell surface Nav1.5 compared with wild type SAR1A-Flag or empty vector control (n=3, p<0.05) (Fig. 1A and1C). As control, either mutant SAR1A:T39N-Flag or SAR1A:H79G-Flag did not have any effect on the expression level of total Nav1.5 compared with wild type SAR1A-Flag or empty vector control (n=3, p>0.05) (Fig. 1A and1B). Wild type SAR1A-Flag did not affect the levels of either total Nav1.5 or plasma membrane Nav1.5 (n=3, p>0.05) (Fig. 1 A, 1B and 1C) probably because of a high endogenous expression level of SAR1. Together, these data suggest that mutant SAR1A:T39N-Flag or SAR1A:H79G-Flag decreased the level of cell surface Nav1.5 by a dominant-negative mechanism.
Fig. 1.
Mutant SAR1A and SAR1B GTPases with dominant negative mutations T39N and H79G decrease the cell surface expression of Nav1.5. (A) Western blot analysis of Nav1.5 using plasma membrane protein extracts or total cellular lysates from HEK293 cells transfected with expression plasmids for wild type (WT) SAR1A-Flag, SAR1A:T39N-Flag, and SAR1A:H79G-Flag, or the empty vector control. The plasma membrane protein extracts were prepared using the biotinylation procedure. (B) Quantified data from Western blot analysis as in (A) showing the relative amount of Nav1.5 over tubulin in total cell lysates. (C) Quantified data from Western blot analysis as in (A) showing the relative amount of Nav1.5 over tubulin in plasma membranes over Nav1.5 over tubulin in total cell lysates. (D) Western blot analysis of Nav1.5 using plasma membrane proteins extracts or total cellular lysates from HEK293 cells transfected with expression plasmids for wild type SAR1B-Flag, SAR1B:T39N-Flag, and SAR1B:H79G-Flag, or the empty vector control. The plasma membrane proteins extracts were prepared using the biotinylation procedure. (E) Quantified data from Western blot analysis as in (D) showing the relative amount of Nav1.5 over tubulin in total cell lysates. (F) Quantified data from Western blot analysis as in (D) showing the relative amount of Nav1.5 in plasma membranes over Nav1.5 in total cell lysates. All studies were repeated at least three times. Data are shown as mean ± SEM. NS, not significant; *P < 0.05 (n=3).
In mammals, two SAR1 paralogs, SAR1A and SAR1B, share 89% amino acid identity with each other. As for SAR1A, similar analysis was carried out for SAR1B. SAR1B:T39N-Flag or SAR1B:H79G-Flag significantly decreased the amount of Nav1.5 in plasma membranes (n=3, p<0.05) (Fig. 1D and 1F). SAR1B:T39N-Flag or SAR1B:H79G-Flag did not affect the expression level of total Nav1.5 (n=3, p>0.05) (Fig. 1D and 1E). These data suggest that similar to SAR1A, SAR1B regulates the cell surface expression level of Nav1.5, but not the expression level of total cellular Nav1.5.
3.2. Dominant-negative mutants of SAR1A and SAR1B significantly reduce the densities of cardiac sodium current INa in HEK293/Nav1.5 cells
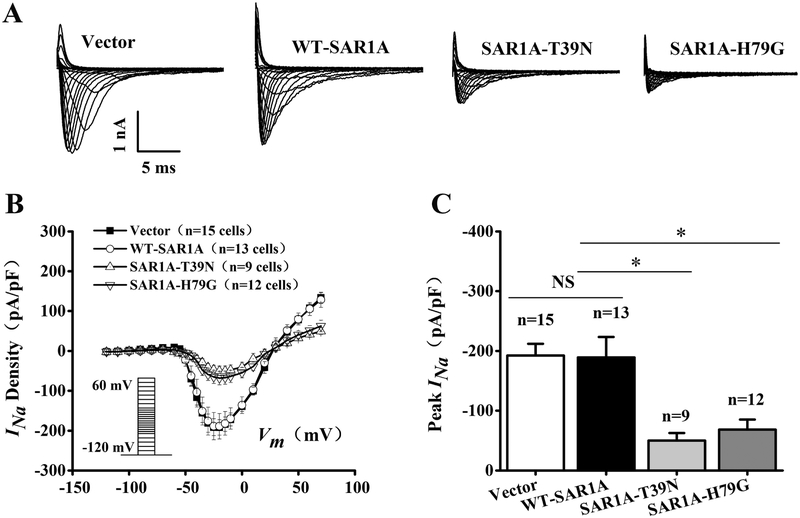
Because mutant SAR1A or SAR1B with the two dominant-negative mutations T39N and H79G significantly reduces the plasma membrane level of Nav1.5, we hypothesize that these two mutations will decrease the density of cardiac current INa. The hypothesis was tested using the whole-cell patch-clamping of HEK293 cells with stable expression of Nav1.5 (HEK293/Nav1.5) transfected with an expression plasmid for SAR1A-Flag, SAR1A:T39N-Flag, SAR1A:H79G-Flag, or the pCMV10 empty vector control. Representative whole-cell INa traces are shown in Fig. 2A. The relationship of average current densities (current normalized to cell capacitance) and voltage and relative peak INa current densities (pA/pF) are shown in Fig. 2B and2C, respectively. As shown in Fig. 2C, the T39N mutation of SAR1A significantly reduced the peak current density compared with the wild type control or empty vector (−50.05±12.52, n=9 cells for SAR1A.T39N-Flag vs. −192.16±19.70, n=15 cells for the vector control or −189.04±34.21, n=13 cells for SAR1A-Flag; p<0.05). Similarly, the H79G mutation of SAR1A significantly reduced the peak current density compared with the wild type control or empty vector (−68.39±16.87, n=12 cells for SAR1A:H79G-Flag vs. −192.16±19.70, n=15 cells for the vector control or −189.04±34.21, n=13 cells for SAR1A-Flag; p<0.05). These data suggest that SAR1A functionally regulates the density of INa.
Fig. 2.
Mutant SAR1A GTPases with dominant negative mutations T39N and H79G decrease sodium current INa in HEK/Nav1.5 cells. (A) Representative whole-cell sodium current traces recorded from HEK/Nav1.5 cells transfected with empty vector control or expression plasmids for wild type (WT) SAR1A-Flag, SAR1A:T39N-Flag or SAR1A:H79G-Flag. (B) The relationship between the average current density (current normalized to cell capacitance) and voltage. The voltage clamp protocol was shown in the inset. (C) The relative peak sodium current density at −25 mV among different treatment groups. Current density (pA/pF) was - 192.16±19.70 (n=15 cells) for the empty vector control, −50.05±12.52 (n=9 cells) for T39N-SAR1A-FLAG, −68.39±16.87 (n=12 cells) for H79G-SAR1A-FLAG, or −189.03±34.21 (n=13 cells) for WT-SAR1A-FLAG. Data are shown as mean ± SEM. NS, not significant; *P < 0.05.
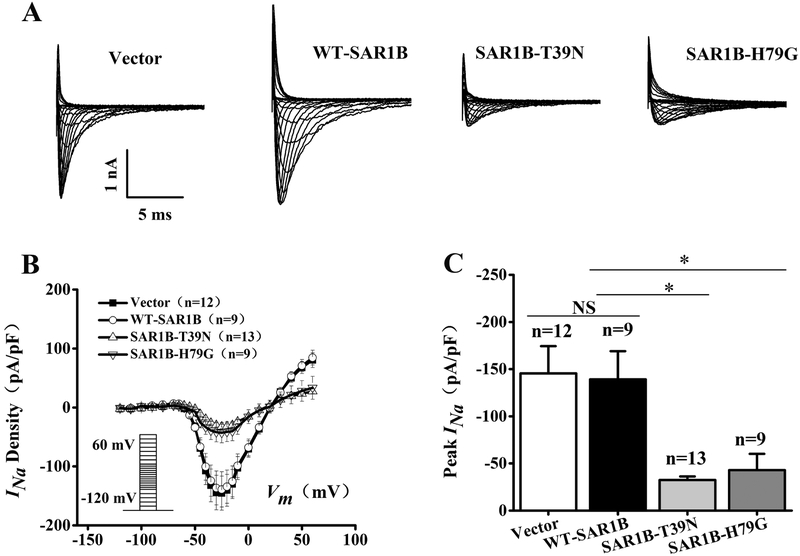
Whole-cell patch-clamping analysis also showed that SAR1B regulated the density of INa (Fig. 3). As shown in Fig. 3C, the T39N mutation of SAR1B significantly reduced the peak current density compared with the wild type control or empty vector −32.55±3.76, n=13 cells for SAR1B:T39N-Flag vs. −145.57±28.87, n=12 cells for the vector control or −139.08±29.98, n=9 cells for SAR1B-Flag; p<0.05). Similarly, the H79G mutation of SAR1A significantly reduced the peak current density compared with the wild type control or empty vector (−42.96±17.19, n=9 cells for SAR1B:H79G-Flag vs. −145.57±28.87, n=12 cells for the vector control or −139.08±29.98, n=9 cells for SAR1B-Flag; p<0.05).
Fig. 3.
Mutant SAR1B GTPases with dominant negative mutations T39N and H79G decrease densities of sodium current INa in HEK/Nav1.5 cells. (A) Representative whole-cell sodium current traces recorded from HEK/Nav1.5 cells transfected with the empty vector control or expression plasmids for wild type SAR1B-Flag, SAR1B:T39N-Flag or SAR1B:H79G-Flag. (B) The relationship between the average current density (current normalized to cell capacitance) and voltage. The voltage clamp protocol was shown in the inset. (C) The relative peak sodium current density at −25 mV among different treatment groups. Current densities (pA/pF) were −145.57±28.87 (n=12 cells) for empty vector control, −32.55±3.76 (n=13 cells) for SAR1B:T39N-FLAG, −42.97±17.19 (n=9 cells) for SAR1B:H79G-FLAG, and - 139.08±29.98 (n=9 cells) for WT-SAR1B-FLAG. Data are shown as mean ± SEM. NS, not significant; *P < 0.05.
3.3. Dominant-negative mutants of SAR1A and SAR1B significantly reduce the densities of cardiac sodium current INa in neonatal rat cardiomyocytes
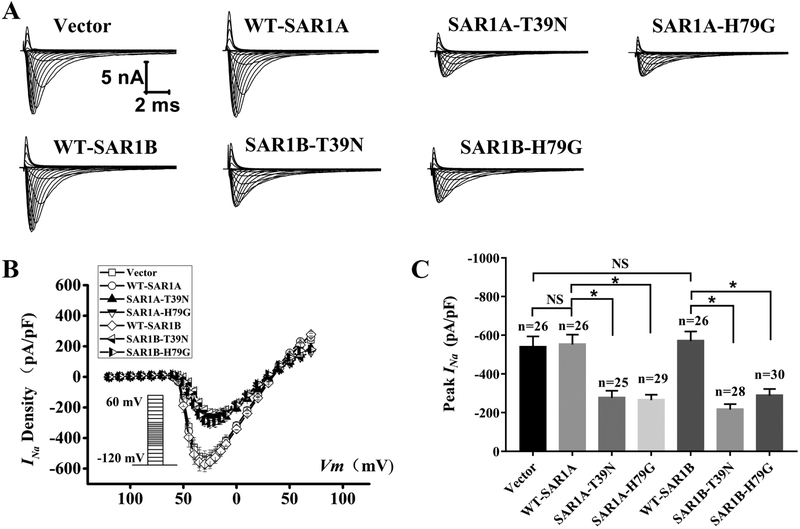
The findings that dominant-negative mutants of SAR1A and SAR1B significantly reduce the densities of INa in HEK293 cells were confirmed in primary neonatal cardiomyocytes. We carried out whole-cell patch-clamping of neonatal rat cardiomyocytes transfected with an expression plasmid for SAR1A-Flag, SAR1A:T39N-Flag, SAR1A:H79G-Flag or the pCMV10 empty vector control. Representative whole-cell cardiac INa traces are shown in Fig. 4A. The relationship of average current densities (current normalized to cell capacitance) and voltage and relative peak INa current densities (pA/pF) are shown in Fig. 4B and4C, respectively. As shown in Fig. 4C, the two dominant-negative mutations T39N and H79G of SAR1A significantly reduced the peak current densities of cardiac INa compared with wild type SAR1A (−552.17±51.53, n=26 cells for wild type SAR1A-Flag vs. −276.64±36.80, n=25 cells for SAR1A:T39N-Flag or −265.22±27.91, n=29 cells for SAR1A:H79G-Flag; p<0.05). Similarly, the T39N and H79G mutations of SAR1B also significantly reduced the peak current densities of cardiac INa compared with wild type SAR1B (−570.23±49.88, n=26 cells for wild type SAR1B-Flag vs. −216.39±28.29, n=28 cells for SAR1B:T39N-Flag or −288.51±34.55, n=30 cells for SAR1B:H79G-Flag; p<0.05) (Fig. 4). Compared with the empty vector control, wild type SAR1A did not show any significant effect on the peak current densities (−552.17±51.53, n=26 cells for SAR1A-Flag vs. −538.63±55.99, n=26 cells for empty vector control; p>0.05) (Fig. 4). Similarly, wild type SAR1B did not show any significant effect on the peak current density of cardiac INa compared with the empty vector control (−570.23 ± 49.88, n=26 cells for SAR1B-Flag vs. −538.63±55.99, n=26 cells for empty vector control; p>0.05) (Fig. 4). Together, these data suggest that dominant-negative mutants of SAR1A and SAR1B significantly reduce the densities of cardiac INa in neonatal rat cardiomyocytes, demonstrating a regulatory role of SAR1A and SAR1B in cardiac INa.
Fig. 4.
Mutant SAR1A and SAR1B GTPases with dominant negative mutations T39N and H79G decrease INa in neonatal rat cardiomyocytes. (A) Representative whole-cell sodium current traces recorded from neonatal rat cardiomyocytes transfected with the empty vector control or expression plasmids for wild type (WT) SAR1A-Flag, SAR1A:H79G-Flag, WT-SAR1B-Flag. SAR1B:T39N-Flag or SAR1B:H79G-Flag, respectively. (B) The relationship between the average current density (current normalized to cell capacitance) and voltage. The voltage clamp protocol was shown in the inset. (C) The relative peak sodium current density at −30 mV among different treatment groups. Current densities (pA/pF) were −538.63±55.99 (n=26 cells) for the empty vector control, −276.64±36.80 (n=25 cells) for T39N-SAR1A-Flag, −265.22±27.91 (n=29 cells) for H79G-SAR1A-Flag, −552.17±51.53 (n=26 cells) for WT-SAR1A-Flag, −216.39±28.29 (n=28 cells) for SAR1B:T39N-Flag, −288.51±34.55 (n=30 cells) for SAR1B:H79G-Flag, and −570.23 ± 49.88 (n=26 cells) for WT-SAR1B-Flag. Data are shown as mean ± SEM. NS, not significant; *P < 0.05.
3.4. Simultaneous knockdown of both SAR1A and SAR1B expression significantly decreases peak INa density
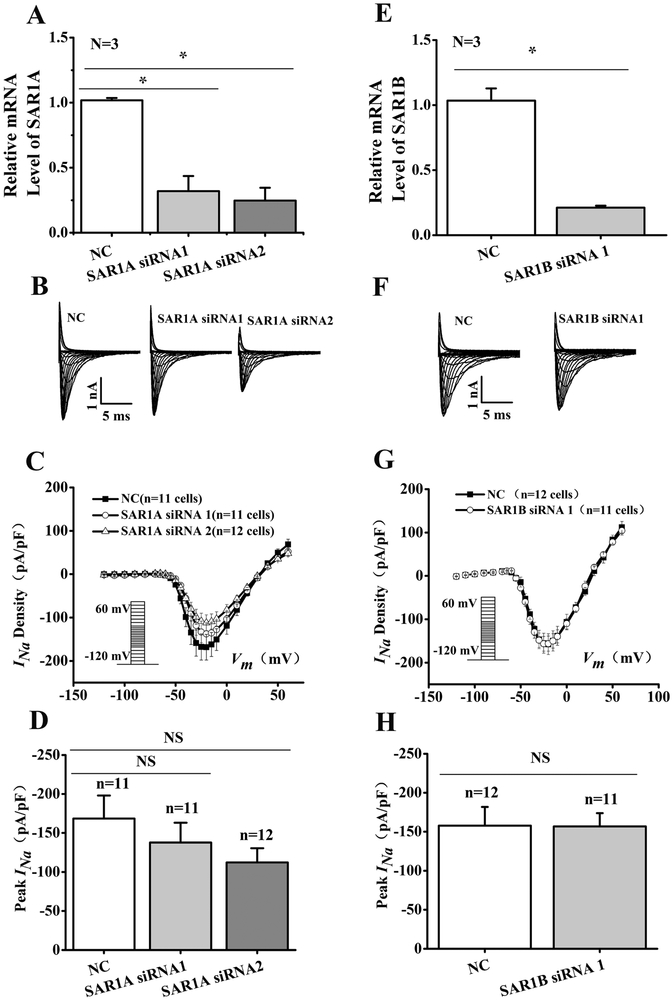
Both SAR1A and SAR1B are endogenously expressed in HEK 293 cells (Fig. 5). To further determine their effect on Nav1.5 cell surface expression, SAR1A or SAR1B were knocked down with siRNAs in HEK293/Nav1.5 cells (Fig. 5). Real time qRT-PCR analysis showed successful knockdown of the expression of SAR1A or SAR1B by their respective siRNAs compared with control scramble siRNA (p<0.05) (Fig. 5A and5E). However, analysis of the representative INa traces or the peak current densities from HEK293/Nav1.5 cells transfected with SAR1A or SAR1B siRNAs respectively did not have significant effect on INa density (Fig. 5).
Fig. 5.
Knockdown of either SAR1A or SAR1B expression does not affect INa in HEK/Nav1.5 cells. (A, E) Real-time RT-PCR analysis showing successful knockdown of SAR1A or SAR1B expression in HEK/Nav1.5 cells transfected with siRNA to SAR1A or SAR1B and scrambler siRNA (NC) as a control. (B, F) Representative whole-cell sodium current traces recorded from HEK/Nav1.5 cells transfected with SAR1A and SAR1B siRNAs or NC siRNAs. (C, G) The relationship of average current densities (current normalized to cell capacitance) and voltage in HEK/Nav1.5 cells transfected with SAR1A siRNAs or SAR1B siRNA compared to NC siRNA. The voltage clamp protocol was shown in the inset. (D) Relative peak sodium current densities (pA/pF) for SAR1A siRNAs at −25 mV. Current densities (pA/pF) were −137.69±25.35 for SAR1A siRNA1 (n=11 cells), −112.22+18.12 for SAR1A siRNA2 (n=12 cells) and −168.35±29.55 for NC siRNA (11 cells). (H) Relative peak sodium current densities (pA/pF) for SAR1B siRNA at −25 mV. Current densities (pA/pF) were −156.82±16.97 for SAR1B siRNA1 (n=11 cells), and −157.70±24.03 for NC siRNA (12 cells). Data are shown as mean ± SEM. NS, not significant; *P < 0.05.
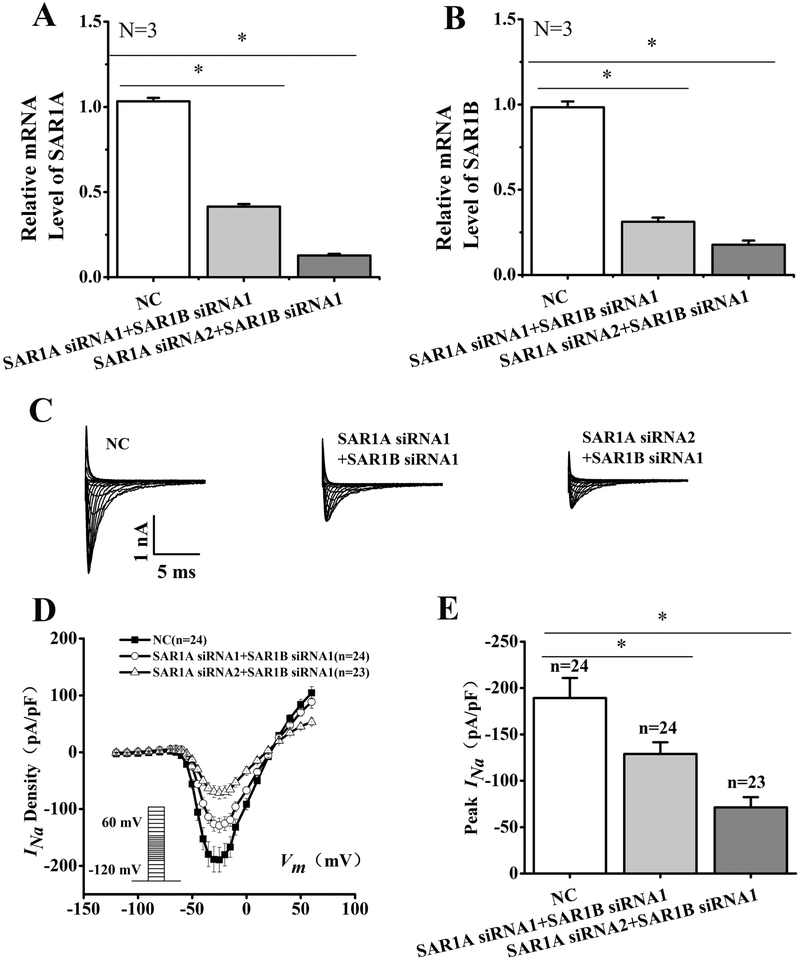
A possible explanation for the lack of effects of the individual knockdown of either SAR1A or SAR1B on the density of cardiac sodium current is the redundant role of the two genes. Therefore, we tested the effect of double knockdown of both SAR1A and SAR1B (Fig. 6). The combination of either SAR1A siRNA1 and SAR1B siRNA1 or SAR1A siRNA2 and SAR1B siRNA1 successfully reduced the expression levels of both SAR1A (Fig. 6A) and SAR1B (Fig. 6B) in HEK293/Nav1.5 cells compared with control scramble siRNA (NC) (n=3, p<0.05). Whole-cell patch-clamping recordings showed that compared to NC, SAR1A siRNA1+SAR1B siRNA1 and SAR1A siRNA2+SAR1B siRNA1 significantly reduced the density of INa (Fig. 6C and6D). The peak INa current density was reduced significantly by 32% by SAR1A siRNA1+SAR1B siRNA1 (−128.97±12.56 pA/pF, n=24 cells for SAR1A siRNA1+SAR1B siRNA1 vs. −189.25±21.57 pA/pF, n=24 cells for NC, p<0.05). The reduction of the peak INa current density by SAR1A siRNA2+SAR1B siRNA1 was more dramatic (by 62%) (−71.31±10.94 pA/pF, n=23 cells for SAR1A siRNA2+SAR1B siRNA1 vs. −189.25±21.57 pA/pF, n=24 cells for NC, p<0.05). Together, these data showed that knockdown of expression of individual SAR1A or SAR1B alone did not affect the INa density in HEK/Nav1.5 cells, however, simultaneous knockdown of both SAR1A and SAR1B caused a significant decrease of INa densities.
Fig. 6.
Simultaneous double knockdown of SAR1A and SAR1B expression by siRNAs significantly reduces INa density in HEK/Nav1.5 cells. (A) Real-time RT-PCR analysis showing successful knockdown of SAR1A expression in HEK/Nav1.5 cells transfected with SAR1A siRNA1+SAR1B siRNA1 or SAR1A siRNA2+SAR1B siRNA1 as compared with scrambler negative control siRNA (NC). (B) Real-time RT-PCR analysis showing successful knockdown of SAR1B expression in HEK/Nav1.5 cells transfected with SAR1A siRNA1+SAR1B siRNA1 or SAR1A siRNA2+SAR1B siRNA1 as compared with scrambler negative control siRNA (NC). (C) Representative whole-cell sodium current traces. (D) The relationship of average current densities (current normalized to cell capacitance) and voltage. The voltage clamp protocol was shown in the inset. (E) Relative peak sodium current densities (pA/pF) at −25 mV. Current densities (pA/pF) were −128.97±12.56 for SAR1A siRNA1+SAR1B siRNA1 (n=24), −71.31+10.94 for SAR1A siRNA2+SAR1B siRNA1 (n=23) and −189.25±21.57 for NC siRNA (n=24). Data are shown as mean ± SEM. NS, not significant; *P < 0.05.
3.5. MOG1 interacts with SAR1A and SAR1B
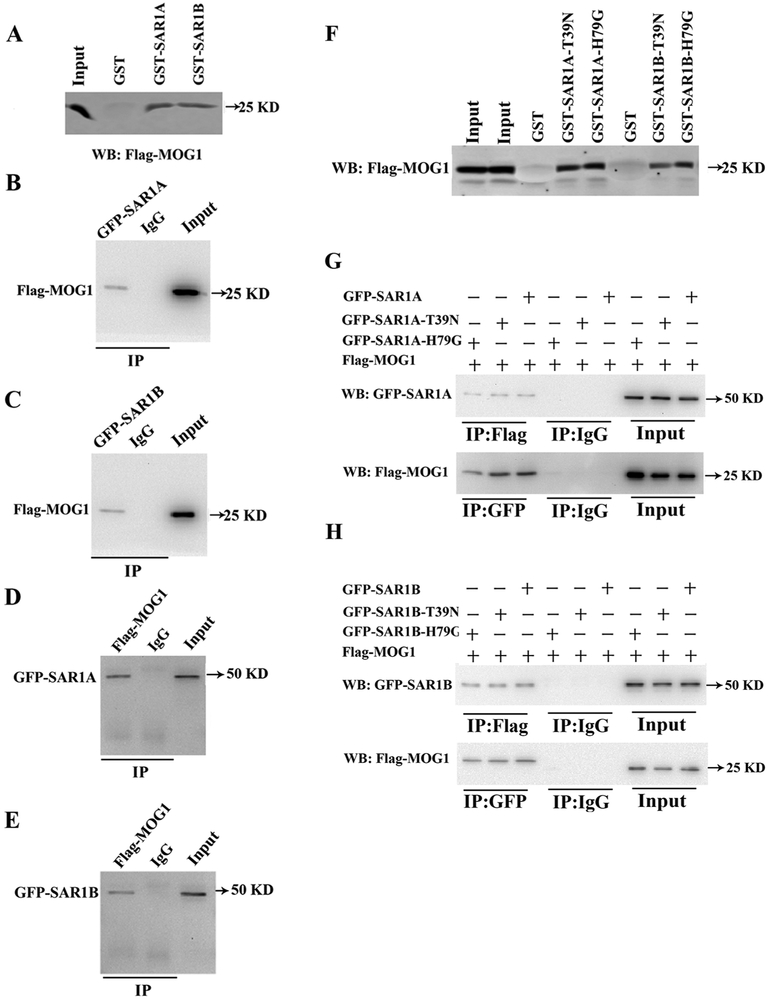
We previously reported that MOG1 regulated the ER export of Nav1.5, which is the first step in the trafficking of Nav1.5 to the plasma membrane [12]. SAR1 is also known to be involved in the ER export of proteins [11]. The ER-to-Golgi trafficking or ER export of a membrane protein involves the biogenesis/assembly of coat protein (COPII)-coated vesicles, which starts with the activation of SAR1 that recruits and captures the target protein cargo into the COPII-coated vesicles [11, 26-29]. Due to the shared functionality of SAR1 and MOG1, we investigated the potential interaction between the two proteins. MOG1 is a RAN-binding protein [30-32]. Despite the low sequence identity shared by Ran and SAR1, computer modeling showed that the two proteins shared similar structures with each other (Fig. S1A), which suggests that MOG1 could interact with SAR1 in a similar way as MOG1 interaction with RAN. Therefore, we modelled the MOG1-SAR1 complex through modeling of the MOG1-RAN complex. Previous studies identified the key interface residues for the interaction between MOG1 and RAN [30, 32], including MOG1 residues Asp62, Glu65 and RAN residue Lys136. Steggerda et al. [32] identified a conserved loop in MOG1 that interacts with RAN. The binding site information was used for facilitating the modeling by ZDOCK. Specifically, MOG1 (pdb code: 1EQ6, chain is: A) was treated as the receptor, whereas RAN (pdb code: 1A2K, chain id: C) and SAR1 (pdb code: 1F6B, chain id: B) were treated as the ligand, respectively. We set MOG1 residues Asp53, Arg58, Asp62, Glu65 and RAN residue Lys141 as the contacting residues to filter the MOG1-RAN complex data. Fifty-six models were retained after contact filtering. The top 5 complexes are shown as Fig. S1B. Since we obtained the MOG1-RAN models from docking, we superimposed SAR1 onto the MOG1-RAN models to generate the MOG1-Sar1 complex models. The top 5 complex models are shown as Fig. S1C. The MOG1-RAN complex models are similar to the MOG1-SAR1 complex models. Therefore, we hypothesized that MOG1 also interacts with SAR1. To test the hypothesis, we overexpressed the GST-SAR1 fusion protein (GST as control) in E. coli, extracted the GST-SAR1 or control GST proteins, and incubated with cellular extracts from HEK293 cells transfected with a MOG1 expression plasmid. GST-pulldown showed that both SAR1A and SAR1B, but not GST alone, interacted with MOG1 (Fig. 7A). These data suggest that MOG1 interacts with SAR1A and SAR1B.
Fig. 7.
SAR1A and SAR1B interact with MOG1. (A) GST-pulldown analysis showed that Flag-MOG1 overexpressed in HEK293 cells was pulled down by either GST-SAR1A or GST-SAR1B, but not by GST. (B) Co-IP analysis showed that Flag-MOG1 in HEK293 cells was successfully precipitated by an anti-GFP antibody recognizing GFP-SAR1A, but bot by the control anti-mouse IgG. (C) Co-IP analysis showed that Flag-MOG1 in HEK293 cells was successfully precipitated by an anti-GFP antibody recognizing GFP-SAR1B, but bot by the control anti-mouse IgG. (D) Reciprocal Co-IP analysis showed that GFP-SAR1A in HEK293 cells was successfully precipitated by an anti-FLAG antibody recognizing Flag-MOG1, but not by the control anti-rabbit IgG. (E) Reciprocal Co-IP analysis showed that GFP-SAR1B in HEK293 cells was successfully precipitated by an anti-FLAG antibody recognizing Flag-MOG1, but not by the control anti-rabbit IgG. (F) GST-pulldown analysis showed that Flag-MOG1 in HEK293 cells was successfully pulled down by GST-SAR1A:T39N, GST-SAR1A:H79G, GST-SAR1B:T39N or GST-SAR1B:H79G, but not GST alone. (G) Top image: Co-IP analysis showed that the anti-Flag antibody recognizing Flag-MOG1, but not the control anti-rabbit IgG, successfully precipitated GFP-SAR1A, GFP-SAR1A:T39N or GFP-SAR1A:H79G. Bottom image: Reciprocal Co-IP analysis showed that the anti-GFP antibody recognizing GFP-SAR1A, GFP-SAR1A:T39N or GFP-SAR1A:H79G, but not the anti-mouse IgG, successfully precipitated Flag-MOG1. (H) Top image: Co-IP analysis showed that the anti-Flag antibody recognizing Flag-MOG1, but not the control anti-rabbit IgG, successfully precipitated GFP-SAR1B, GFP-SAR1B:T39N or GFP-SAR1B:H79G. Bottom image: Reciprocal Co-IP analysis showed that anti-GFP antibody recognizing GFP-SAR1B, GFP-SAR1B:T39N or GFP-SAR1B:H79G, but not the control anti-rabbit IgG, successfully precipitated Flag-MOG1.
To further confirm that MOG1 interacts with SAR1A or SAR1B, we performed Co-IP assays using proteins extracts from HEK293 cells transiently co-transfected with a mammalian expression plasmid for Flag-tagged MOG1 (Flag-MOGl) together with an expression plasmid for GFP-tagged SAR1A (GFP-SAR1A) or GFP-SAR1B. The HEK293 protein extracts were immunoprecipitated using a mouse anti-GFP antibody or anti-mouse IgG as a negative control, and the precipitates were analyzed by Western blot analysis with a rabbit anti-Flag antibody recognizing Flag-MOG1. The anti-GFP antibody recognizing GFP-SAR1A or GFP-SAR1B successfully precipitated Flag-MOG1, but the anti-mouse IgG failed to precipitate Flag-MOG1 (Figure. 7B and7C). Reciprocal Co-IP assays showed that the anti-Flag antibody recognizing Flag-MOG1, but not the control anti-rabbit IgG, precipitated GFP-SAR1A/B (Figure 7D and7E). The Co-IP experiments confirmed the GST pull-down data that MOG1 interacted with SAR1A and SAR1B in HEK293 cells.
We also assessed whether MOG1 interacts with the two dominant-negative mutations T39N and H79G of both SAR1A and SAR1B. GST-pull down assays showed that mutant SAR1A or SAR1B with dominant-negative mutations T39N or H79G of SAR1A and SAR1B successfully pulled Flag-MOG1 down (Figure. 7F). Furthermore, Co-IP assays showed that the anti-Flag antibody recognizing Flag-MOG1 successfully precipitated both wild type and mutant GFP-SAR1A and SAR1B with dominant-negative mutations T39N or H79G (Figure. 7G). Reciprocal Co-IP assays showed that the anti-GFP antibody recognizing wild type and mutant SAR1A or SAR1B precipitated Flag-MOG1 (Figure. 7H). These data suggest that dominant-negative mutations T39N and H79G of SAR1A and SAR1B do not affect the interaction between MOG1 and SAR1A or SAR1B, and that mutations T39N and H79G may exert their dominant-negative effects by affecting other functions or activities of SAR1A and SAR1B, for example, catalytic GTPase activities.
3.6. The MOGl-mediated increase of peak INa density is dependent on SAR1A and SAR1B
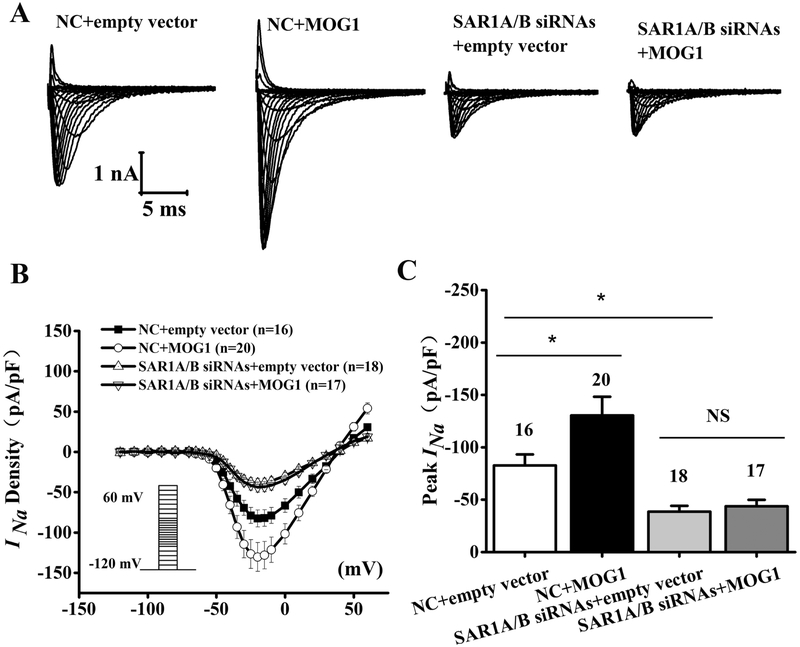
Because MOG1 interacts with SAR1A and SAR1B, we determined whether the effect of MOG1 on the peak INa density was affected by SAR1A and SAR1B knockdown in HEK/Nav1.5 cells by whole-cell patch-clamping (Fig. 8). As shown in Fig. 8A-C, overexpression of MOG1 significantly increased the INa density (compare NC+empty vector and NC+MOG1) (P<0.05). The peak INa density (pA/pF) was increased by 58% by MOG1 (−82.72±10.56, n=16 cells for NC+empty vector, −130.37±17.84, n=20 cells for NC+MOG1; P<0.05). However, in HEK/Nav1.5 cells transfected with SAR1A siRNA1+SAR1B siRNA2, the increased INa density by MOG1 was lost (−38.54±5.68, n=18 cells for empty vector+SAR1A/B siRNAs and −41.52±6.24, n=18 cells for MOG1+SAR1A/B siRNAs, P>0.05). These data suggest that SAR1A and SAR1B are required for the effect of MOG1 on sodium current.
Fig. 8.
MOG1-increased INa density is abolished when SAR1A and SAR1B expression is knocked down. (A) Representative whole-cell sodium current traces recorded from HEK/Nav1.5 cells transfected with the empty vector control vs. a MOG1 expression plasmid in combination with SAR1AB siRNAs (SAR1A siRNA2 + SAR1B siRNA1) vs. negative control (NC) siRNA. (B) Relationship of average current densities (current normalized to cell capacitance) and voltage. The voltage clamp protocol was shown in the inset. (C) Relative peak sodium current densities (pA/pF) at −25 mV. Data are shown as mean ± SEM. NS, not significant; *P < 0.05.
3.7. MOG1-mediated trafficking of Nav1.5 is dependent on SAR1A and SAR1B
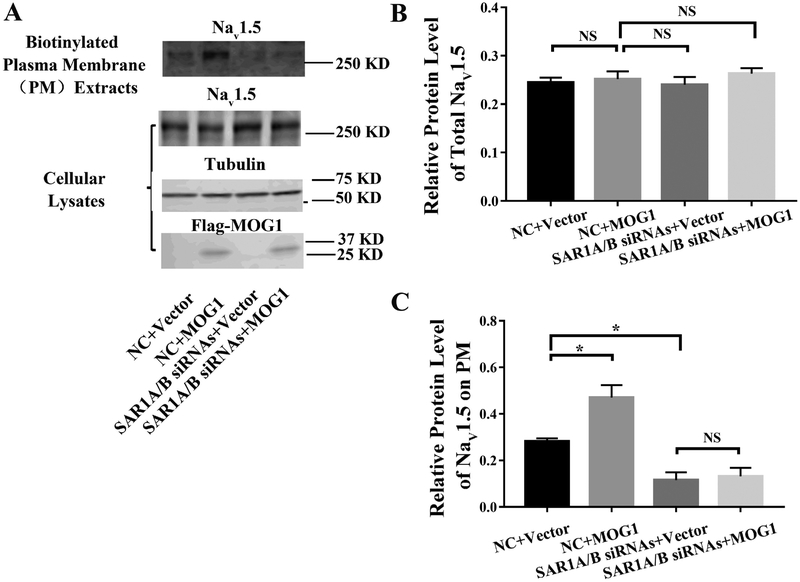
We characterized the trafficking of Nav1.5 to cell surface by Western blot analysis with biotinylated plasma membrane protein extracts from HEK293 cells with overexpression of MOG1 and with or without knockdown of SAR1A or SAR1B expression (Fig. 9). In addition to plasma membrane protein extracts, Western blot analysis was also carried out for total cellular protein extracts from a separate set of cells. As shown in Fig. 9A and9B, overexpression of MOG1 did not have any effect on the level of total Nav1.5 as reported previously by us [12, 14]. Similarly, knockdown of SAR1A and SAR1B did not have any effect on the level of total Nav1.5 (Fig. 9A and9B). On the contrary, overexpression of MOG1 significantly increased the level of plasma membrane Nav1.5, and knockdown of both SAR1A and SAR1B significantly decreased the level of plasma membrane Nav1.5 (Fig. 9A and9C). Most interestingly, the increased level of plasma membrane Nav1.5 by MOG1 was abolished in cells with knockdown of both SAR1A and SAR1B expression (Fig. 9A and9C). These data are consistent with the data on INa in Fig. 8. Together, these data suggest that knockdown of SAR1A and SAR1B reduced the INa density by decreasing the level of plasma membrane Nav1.5. Moreover, the increased trafficking of Nav1.5 to plasma membranes and enhanced INa density by MOG1 is dependent on SAR1A/B.
Fig. 9.
MOG1-mediated plasma membrane trafficking of Nav1.5 is abolished when SAR1A and SAR1B expression is knocked down. (A) Western blot analysis of Nav1.5 using either biotinylated plasma membrane protein extracts or total cellular lysates from HEK293 cells transfected with the empty vector control vs. a MOG1 expression plasmid in combination with SAR1A/B siRNAs vs. negative control (NC) siRNA. Tubulin was used as a loading control. (B) Quantified data from Western blot analysis as in (A) showing the relative amount of Nav1.5 over tubulin in total cellular lysates. (C) Quantified data from Western blot analysis as in (A) showing the relative amount of Nav1.5 over tubulin in plasma membranes over Nav1.5 over tubulin in total cellular lysates. All studies were repeated at least three times. Data are shown as mean ± SEM. NS, not significant; *P < 0.05 (n=3).
4. Discussion
ER exit for many membrane proteins is one of the early steps for the trafficking of these proteins to plasma membranes. ER exit involves the assembly and disassembly of the COPII-associated vesicles from ER membranes and requires recruitment of small SAR1 GTPases to the ER outer membrane, which leads to recruitment of coat complexes and formation of the exit sites [17, 33-35]. In addition to this conventional COPII-complex pathway, there are non-conventional trafficking pathways for some other membrane proteins [36, 37]. In this study, we show that the two SAR1 GTPases, SAR1A and SAR1B, regulate the trafficking of Nav1.5. Double knockdown of both SAR1A and SAR1B reduced the trafficking of Nav1.5 to plasma membranes and caused significant reduction of INa densities (Fig. 6). Furthermore, overexpression of dominant negative mutants SAR1A:H79G, SAR1A:T39N, SAR1B:H79G, or SAR1B:T39N significantly inhibited the cell surface expression of Nav1.5 (Figs. 1) and decreased the peak sodium current densities (Figs. 2, 3 and 4). These data for the first time show that SAR1A and SAR1B are required for Nav1.5 transport from the ER to the cell surface and that the conventional ER-derived COPII-coated vesicles likely regulate the trafficking of Nav1.5.
SAR1A and SAR1B appear to play a redundant role in the regulation of the trafficking of Nav1.5. Knockdown of either the SAR1A gene or the SAR1B gene alone by siRNAs did not have any effect on the cell surface expression of Nav1.5 or INa densities (Fig. 5). Only simultaneous knockdown of both SAR1A and SAR1B genes caused significantly reduction of the cell surface expression of Nav1.5 and INa densities (Fig. 6). Moreover, SAR1A and SAR1B may form a heterodimer because a single dominant-negative mutation of SAR1A (T39N or H79G) or a single dominant-negative mutation of SAR1B (T39N or H79G) was sufficient to inhibit the cell surface expression of Nav1.5 and reduce INa densities significantly (Figs. 1, 2, 3 and 4). The single dominant-negative mutant SAR1A needs to form a heterodimer to impair the functions of both SAR1A and SAR1B, and vice versa for single dominant-negative mutant SAR1B. However, it is important to note that both SAR1A and SAR1B proteins may function together as either homodimers or heterodimers at the same bud site and the same ER exit site to collectively drive vesicle formation (as multiple SAR1 molecules are utilized in the budding of a single vesicle). We previously demonstrated that MOG1 facilitated Nav1.5 cell surface expression through regulating its ER exit [12]. As the function of SAR1A and SAR1B in protein trafficking is also the regulation of ER exit, it is not surprising to find that MOG1 interacted with SAR1A and SAR1B (Fig. 7). Moreover, both SAR1A and SAR1B were essential for MOG1-promoted increases of Nav1.5 expression levels on the cell surface and the densities of INa (Figs. 8 and 9). The interactions between SAR1A/SAR1B and MOG1 and between MOG1 and Nav1.5 may assist the recruitment and capture of the target protein cargo Nav1.5 into the COPII-coated vesicles that later shed their coats before fusing with their target membranes. Alternatively, it is also likely that the interaction between SAR1A/SAR1B and MOG1 may regulates the SAR1 GTPase activity involved in protein trafficking because MOG1 can regulate nucleotide release or exchange on RAN GTPase. These and other detailed underlying molecular mechanisms need to be further characterized in the future.
Overexpression of MOG1 increased the densities of cardiac INa in HEK293 cells and cardiomyocytes [12, 14], however, overexpression of wild type SAR1A or SAR1B did not affect INa (Figs. 2, 3 and 4). One possible reason is that the endogenous expression level of SAR1A or Sar1B is high so that a further increase of its expression may have a minimal effect on INa. However, there may be other explanations and future studies are required to address the issue why overexpression of wild type SAR1A or SAR1B did not affect INa.
In summary, this study demonstrates that both SAR1A and SAR1B are required for the trafficking of Nav1.5 to cell surface and generation of INa. Moreover, SAR1A and SAR1B interact with MOG1 and knockdown of SAR1A and SAR1B abolishes the function of MOG1. These findings provide important insights into the molecular mechanism of Nav1.5 trafficking, and further characterization of Nav1.5 trafficking by dissecting the SAR1A/SAR1B-MOG1-Nav1.5 interaction complex during ER exit may facilitate the unraveling of novel therapeutic targets for increasing INa through promoting Nav1.5 cell surface expression. The finding also suggest novel molecular mechanisms for designing therapeutic strategies to treat diseases associated with Nav1.5 trafficking.
Supplementary Material
Highlights.
Cardiac sodium channel Nav1.5 causes cardiac arrhythmias and sudden death when mutated.
Small GTPases SAR1A and SAR1B regulate Nav1.5 trafficking by interacting with MOG1.
SAR1A and SAR1B are required for MOG1-mediated cell surface expression and function of Nav1.5
These findings provide insights into trafficking of Nav1.5 and cardiac electrophysiology.
Acknowledgments
We thank Dr. Hanxiang Gao for technical assistance when she was a Predoctoral Fellow at Cleveland Clinc, Dr. Glenn Kirsch for HEK/Nav1.5 cell line, Dr. Charles Antzelevitch for the tsA201 cell line, and Dr. Randy Schekman (university of California, Berkeley) for plasmids for GST-SAR1A (RSB3771) in pGEX2T, GST-SAR1B in pGEX2T (RSB3772) and GST-SAR1A:T39N in pGEX2T (RSB3773).
Funding
This study was supported by NIH/NHLBI grant R01 HL126729, Chinese National Basic Research Programs (973 Program 2013CB531101), the National Natural Science Foundation of China grants (81630002, 31430047 and 91439129), Hubei Province’s Innovative Team grant 2017CFA014, 2016 Top-Notch Innovative Talent Development Project from the Bureau of Human Resources and Social Security of Wuhan City, Hubei Province Natural Science Key Program 2016CFB224), China Postdoctoral Science Foundation funded project (2017M622409), a Key Project in the National Science & Technology Pillar Program during 395 the Twelfth Five-year Plan Period (2011BAI11B19), Specialized Research Fund for the Doctoral Program of Higher Education from the Ministry of Education, and the “Innovative Development of New Drugs” Key Scientific Project (2011ZX09307-001-09), NIH/NHLBI grant R01 HL121358, and Hubei Province’s Outstanding Medical Academic Leader Program.
Footnotes
Publisher's Disclaimer: This is a PDF file of an unedited manuscript that has been accepted for publication. As a service to our customers we are providing this early version of the manuscript. The manuscript will undergo copyediting, typesetting, and review of the resulting proof before it is published in its final citable form. Please note that during the production process errors may be discovered which could affect the content, and all legal disclaimers that apply to the journal pertain.
Disclosures
The authors declare that they have no conflicts of interest with the contents of this article.
REFERENCES
- [1].Wang Q, Li Z, Shen J, Keating MT, Genomic organization of the human SCN5A gene encoding the cardiac sodium channel, Genomics, 34 (1996) 9–16. [DOI] [PubMed] [Google Scholar]
- [2].Wang Q, Chen Q, Towbin JA, Genetics, molecular mechanisms and management of long QT syndrome, Ann Med, 30 (1998) 58–65. [DOI] [PubMed] [Google Scholar]
- [3].Wang Q, Shen J, Splawski I, Atkinson D, Li Z, Robinson JL, Moss AJ, Towbin JA, Keating MT, SCN5A mutations associated with an inherited cardiac arrhythmia, long QT syndrome, Cell, 80 (1995) 805–811. [DOI] [PubMed] [Google Scholar]
- [4].Priori SG, Napolitano C, Giordano U, Collisani G, Memmi M, Brugada syndrome and sudden cardiac death in children, Lancet, 355 (2000) 808–809. [DOI] [PubMed] [Google Scholar]
- [5].Chen Q, Kirsch GE, Zhang D, Brugada R, Brugada J, Brugada P, Potenza D, Moya A, Borggrefe M, Breithardt G, Ortiz-Lopez R, Wang Z, Antzelevitch C, O'Brien RE, Schulze-Bahr E, Keating MT, Towbin JA, Wang Q, Genetic basis and molecular mechanism for idiopathic ventricular fibrillation, Nature, 392 (1998) 293–296. [DOI] [PubMed] [Google Scholar]
- [6].Darbar D, Kannankeril PJ, Donahue BS, Kucera G, Stubblefield T, Haines JL, George AL Jr., Roden DM, Cardiac sodium channel (SCN5A) variants associated with atrial fibrillation, Circulation, 117 (2008) 1927–1935. [DOI] [PMC free article] [PubMed] [Google Scholar]
- [7].Ackerman MJ, Priori SG, Willems S, Berul C, Brugada R, Calkins H, Camm AJ, Ellinor PT, Gollob M, Hamilton R, Hershberger RE, Judge DP, Le Marec H, McKenna WJ, Schulze-Bahr E, Semsarian C, Towbin JA, Watkins H, Wilde A, Wolpert C, Zipes DP, S. Heart Rhythm, A. European Heart Rhythm, HRS/EHRA expert consensus statement on the state of genetic testing for the channelopathies and cardiomyopathies: this document was developed as a partnership between the Heart Rhythm Society (HRS) and the European Heart Rhythm Association (EHRA), Europace, 13 (2011) 1077–1109. [DOI] [PubMed] [Google Scholar]
- [8].Kapplinger JD, Tester DJ, Alders M, Benito B, Berthet M, Brugada J, Brugada P, Fressart V, Guerchicoff A, Harris-Kerr C, Kamakura S, Kyndt F, Koopmann TT, Miyamoto Y, Pfeiffer R, Pollevick GD, Probst V, Zumhagen S, Vatta M, Towbin JA, Shimizu W, Schulze-Bahr E, Antzelevitch C, Salisbury BA, Guicheney P, Wilde AA, Brugada R, Schott JJ, Ackerman MJ, An international compendium of mutations in the SCN5A-encoded cardiac sodium channel in patients referred for Brugada syndrome genetic testing, Heart Rhythm, 7 (2010) 33–46. [DOI] [PMC free article] [PubMed] [Google Scholar]
- [9].Tan HL, Bink-Boelkens MT, Bezzina CR, Viswanathan PC, Beaufort-Krol GC, van Tintelen PJ, van den Berg MP, Wilde AA, Balser JR, A sodium-channel mutation causes isolated cardiac conduction disease, Nature, 409 (2001) 1043–1047. [DOI] [PubMed] [Google Scholar]
- [10].Viswanathan PC, Balser JR, Inherited sodium channelopathies: a continuum of channel dysfunction, Trends Cardiovasc Med, 14 (2004) 28–35. [DOI] [PubMed] [Google Scholar]
- [11].Barlowe C, d'Enfert C, Schekman R, Purification and characterization of SAR1p, a small GTP-binding protein required for transport vesicle formation from the endoplasmic reticulum, J Biol Chem, 268 (1993) 873–879. [PubMed] [Google Scholar]
- [12].Chakrabarti S, Wu X, Yang Z, Wu L, Yong SL, Zhang C, Hu K, Wang QK, Chen Q, MOG1 rescues defective trafficking of Na(v)1.5 mutations in Brugada syndrome and sick sinus syndrome, Circ Arrhythm Electrophysiol, 6 (2013) 392–401. [DOI] [PMC free article] [PubMed] [Google Scholar]
- [13].Oki M, Nishimoto T, A protein required for nuclear-protein import, Mog1p, directly interacts with GTP-Gsp1p, the Saccharomyces cerevisiae ran homologue, Proc Natl Acad Sci U S A, 95 (1998) 15388–15393. [DOI] [PMC free article] [PubMed] [Google Scholar]
- [14].Wu L, Yong SL, Fan C, Ni Y, Yoo S, Zhang T, Zhang X, Obejero-Paz CA, Rho HJ, Ke T, Szafranski P, Jones SW, Chen Q, Wang QK, Identification of a new co-factor, MOG1, required for the full function of cardiac sodium channel Nav 1.5, J Biol Chem, 283 (2008) 6968–6978. [DOI] [PubMed] [Google Scholar]
- [15].Loftus AF, Hsieh VL, Parthasarathy R, Modulation of membrane rigidity by the human vesicle trafficking proteins Sar1A and Sar1B, Biochem Biophys Res Commun, 426 (2012) 585–589. [DOI] [PubMed] [Google Scholar]
- [16].Zhang X, Chen S, Yoo S, Chakrabarti S, Zhang T, Ke T, Oberti C, Yong SL, Fang F, Li L, de la Fuente R, Wang L, Chen Q, Wang QK, Mutation in nuclear pore component NUP155 leads to atrial fibrillation and early sudden cardiac death, Cell, 135 (2008) 1017–1027. [DOI] [PubMed] [Google Scholar]
- [17].Long KR, Yamamoto Y, Baker AL, Watkins SC, Coyne CB, Conway JF, Aridor M, Sar1 assembly regulates membrane constriction and ER export, J Cell Biol, 190 (2010) 115–128. [DOI] [PMC free article] [PubMed] [Google Scholar]
- [18].Huang Y, Wang Z, Liu Y, Xiong H, Zhao Y, Wu L, Yuan C, Wang L, Hou Y, Yu G, Huang Z, Xu C, Chen Q, Wang QK, alphaB-Crystallin Interacts with Nav1.5 and Regulates Ubiquitination and Internalization of Cell Surface Nav1.5, J Biol Chem, 291 (2016) 11030–11041. [DOI] [PMC free article] [PubMed] [Google Scholar]
- [19].Gee HY, Noh SH, Tang BL, Kim KH, Lee MG, Rescue of DeltaF508-CFTR trafficking via a GRASP-dependent unconventional secretion pathway, Cell, 146 (2011) 746–760. [DOI] [PubMed] [Google Scholar]
- [20].Zhao Y, Huang Y, Li W, Wang Z, Zhan S, Zhou M, Yao Y, Zeng Z, Hou Y, Chen Q, Tu X, Wang QK, Huang Z, Post-transcriptional regulation of cardiac sodium channel gene SCN5A expression and function by miR-192-5p, Biochim Biophys Acta, 1852 (2015) 2024–2034. [DOI] [PMC free article] [PubMed] [Google Scholar]
- [21].Wang P, Yang Q, Wu X, Yang Y, Shi L, Wang C, Wu G, Xia Y, Yang B, Zhang R, Xu C, Cheng X, Li S, Zhao Y, Fu F, Liao Y, Fang F, Chen Q, Tu X, Wang QK, Functional dominant-negative mutation of sodium channel subunit gene SCN3B associated with atrial fibrillation in a Chinese GeneID population, Biochem Biophys Res Commun, 398 (2010) 98–104. [DOI] [PMC free article] [PubMed] [Google Scholar]
- [22].Zhang T, Yong SL, Drinko JK, Popovic ZB, Shryock JC, Belardinelli L, Wang QK, LQTS mutation N1325S in cardiac sodium channel gene SCN5A causes cardiomyocyte apoptosis, cardiac fibrosis and contractile dysfunction in mice, Int J Cardiol, 147 (2011) 239–245. [DOI] [PMC free article] [PubMed] [Google Scholar]
- [23].Yong SL, Ni Y, Zhang T, Tester DJ, Ackerman MJ, Wang QK, Characterization of the cardiac sodium channel SCN5A mutation, N1325S, in single murine ventricular myocytes, Biochem Biophys Res Commun, 352 (2007) 378–383. [DOI] [PMC free article] [PubMed] [Google Scholar]
- [24].Chen CT, Peng HP, Jian JW, Tsai KC, Chang JY, Yang EW, Chen JB, Ho SY, Hsu WL, Yang AS, Protein-protein interaction site predictions with three-dimensional probability distributions of interacting atoms on protein surfaces, PLoS One, 7 (2012) e37706. [DOI] [PMC free article] [PubMed] [Google Scholar]
- [25].Kim SD, Pahuja KB, Ravazzola M, Yoon J, Boyadjiev SA, Hammamoto S, Schekman R, Orci L, Kim J, The [corrected] SEC23-SEC31 [corrected] interface plays critical role for export of procollagen from the endoplasmic reticulum, J Biol Chem, 287 (2012) 10134–10144. [DOI] [PMC free article] [PubMed] [Google Scholar]
- [26].Barlowe C, Orci L, Yeung T, Hosobuchi M, Hamamoto S, Salama N, Rexach MF, Ravazzola M, Amherdt M, Schekman R, COPII: a membrane coat formed by Sec proteins that drive vesicle budding from the endoplasmic reticulum, Cell, 77 (1994) 895–907. [DOI] [PubMed] [Google Scholar]
- [27].Barlowe C, COPII-dependent transport from the endoplasmic reticulum, Curr Opin Cell Biol, 14 (2002) 417–422. [DOI] [PubMed] [Google Scholar]
- [28].Kuge O, Dascher C, Orci L, Rowe T, Amherdt M, Plutner H, Ravazzola M, Tanigawa G, Rothman JE, Balch WE, Sar1 promotes vesicle budding from the endoplasmic reticulum but not Golgi compartments, J Cell Biol, 125 (1994) 51–65. [DOI] [PMC free article] [PubMed] [Google Scholar]
- [29].Aridor M, Bannykh SI, Rowe T, Balch WE, Sequential coupling between COPII and COPI vesicle coats in endoplasmic reticulum to Golgi transport, J Cell Biol, 131 (1995) 875–893. [DOI] [PMC free article] [PubMed] [Google Scholar]
- [30].Baker RP, Harreman MT, Eccleston JF, Corbett AH, Stewart M, Interaction between Ran and Mog1 is required for efficient nuclear protein import, J Biol Chem, 276 (2001)41255–41262. [DOI] [PubMed] [Google Scholar]
- [31].Steggerda SM, Paschal BM, The mammalian Mog1 protein is a guanine nucleotide release factor for Ran, J Biol Chem, 275 (2000) 23175–23180. [DOI] [PubMed] [Google Scholar]
- [32].Steggerda SM, Paschal BM, Identification of a conserved loop in Mog1 that releases GTP from Ran, Traffic, 2 (2001) 804–811. [DOI] [PubMed] [Google Scholar]
- [33].Sato K, Nakano A, Mechanisms of COPII vesicle formation and protein sorting, FEBS Lett, 581 (2007) 2076–2082. [DOI] [PubMed] [Google Scholar]
- [34].Sato K, Nakano A, Reconstitution of coat protein complex II (COPII) vesicle formation from cargo-reconstituted proteoliposomes reveals the potential role of GTP hydrolysis by Sar1p in protein sorting, J Biol Chem, 279 (2004) 1330–1335. [DOI] [PubMed] [Google Scholar]
- [35].Lee MC, Orci L, Hamamoto S, Futai E, Ravazzola M, Schekman R, Sar1p N-terminal helix initiates membrane curvature and completes the fission of a COPII vesicle, Cell, 122 (2005) 605–617. [DOI] [PubMed] [Google Scholar]
- [36].Yoo JS, Moyer BD, Bannykh S, Yoo HM, Riordan JR, Balch WE, Non-conventional trafficking of the cystic fibrosis transmembrane conductance regulator through the early secretory pathway, J Biol Chem, 277 (2002) 11401–11409. [DOI] [PubMed] [Google Scholar]
- [37].Zheng H, McKay J, Buss JE, H-Ras does not need COP I- or COP II-dependent vesicular transport to reach the plasma membrane, J Biol Chem, 282 (2007) 25760–25768. [DOI] [PubMed] [Google Scholar]
Associated Data
This section collects any data citations, data availability statements, or supplementary materials included in this article.


