Abstract
Background:
Proton magnetic resonance spectroscopy (MRS) is a well-known device for analyzing the biological fluids metabolically. Obtaining accurate and reliable information via MRS needs a homogeneous magnetic field in order to provide well-defined peaks and uniform water suppression. There are lots of reasons which can disturb the magnetic field homogeneity which can be corrected by a process known as shimming. This study is intended to recall the importance of shimming and also the significant role of quality control (QC) in achieving an accurate quantification.
Material and Method:
An acrylic cylindrical quality control phantom was designed as an analog of brain MRS test phantoms in order to control the accuracy of the obtained signal of a 1.5 T Siemens MRI system which belonged to one of Shiraz hospitals. The signal of NAA, Cho, Cr, the combination of these metabolites and also the distilled water, which was used in this study, was evaluated using separate phantoms. A QC test was performed using Siemens QC phantom and a standard test phantom.
Results:
The spectrum of our home- made phantom had a significant difference with the expected spectrum. The results of checking the spectrum of metabolites separately also confirmed that there was a systemic problem that affects all the signals originated from all metabolites and even the pure distilled water. The MRS system could not pass QC tests, and peak broadening was common in all spectra. The complex spectrum of standard test phantom was not produced successfully by the MRS system.
Discussion:
By a simple check of the water peak characteristics, lots of information can be obtained, one of which is the status of shimming that has a considerable effect on the accuracy of the spectrum. Thus, performing an automatic or manual shimming is not a criterion of the spectrum accuracy, and performing a periodic quality control using a test phantom by a specialist is necessary.
Conclusion:
Briefly, the quality control of MRS and all the other clinical device must be taken seriously. Sometimes QC can be the boundary of a right or a wrong decision for the patient.
Keywords: Magnetic resonance spectroscopy , Shimming , Quality control , Quality assurance
Introduction
Nowadays, proton magnetic resonance spectroscopy (MRS) is a well-known device for analyzing the biological fluids metabolically. MRS has been particularly advantageous for brain studies[1-6]. It is also a very interesting research tool with the ability to provide useful additional information of brain diseases such as brain tumors, metabolic and systemic disorders [7-11].
Obtaining an accurate and reliable information via MRS needs a homogeneous magnetic field in order to provide well-defined peaks and uniform water suppression [12]. Unfortunately, there are lots of causes which can disturb the magnetic field homogeneity, one of which is the magnetic field of the environment. Iron structures in the examination room, even the iron components inside the wall or floor can be magnetized and interrupt in the field of the scanner. There are also some other magnetic fields stems from the slightly magnetized probe and the patient as a result of the strong magnetic field [13,14].
All of these disturbing factors make the magnetic field inhomogeneous, which in turn lead to createbroad peaks that cannot be resolved from each other. Poor peak resolution makes the quantification difficult and unreliable [15]. All the advantages of MRS originates from the accurate relative quantification of metabolites such as choline (Cho), creatine (Cr), N-acetyl-l-aspartic acid (NAA), Myoinositol (M-ins), Lactate (Lac), Glutamic acid (Glu) and other metabolites, consequently, not being able to do this, making it unserviceable.
Accordingly, there are some processes to correct these inhomogeneities that is known as shimming. Depending on the source of the residual inhomogeneity of the magnetic field, it may call as shimming the magnet, shimming the probe or shimming the sample [16].
Shimming is fine-tuning the signal resolution by optimizing the magnetic field homogeneity. It can be done by surrounding the sample with shim coils. Each shim coil provides a small magnetic field with a spatial profile that can be applied to nullify the main magnetic field inhomogeneities. By adjusting the current through each coil a desirable homogeneity can be achieved. The shims are characterized based on the filed profiles that they produce. For instance, the shims which are labeled as x, y and z, can produce varying magnetic fields in the analogous directions. Shimming can perform automatically or manually [17-21].
The full width at half maximum (FWHM) is the spectral width at the half amplitude of the signal. It is one of the indices of shimming, since if the shimming was poor, the peaks will be broad and so that FWHM will be larger. The desirable FWHM at 1.5 and 3 T MRS devices is less that 15 and 30 Hz respectively [22].
The automatic shimming performs before each procedure, and manual shimming has recommended for providing better shim. Although, there are some recommendations and advice to perform shimming, but there is still a question, is performing the shimming automatically or manually enough to make sure that the signal and the quantifications are accurate, or we need to check the system tuning and calibration periodically.
MRS has not found its right place in developing countries so that its main application is in research, not in clinical routines. As a consequence, there are not many skillful people to be able to diagnose miscalibrations and other imperfections, so that most of the times periodic evaluation of equipment is ignored. However, even in the centers that MRS is not clinical routine, tuning the system is the matter of importance to be confident about the results of that limited number of MRS studies which may perform in that center. This study is intended to recall the importance of shimming and also the significant role of quality control in achieving an accurate quantification.
Material and Method
An acrylic cylindrical quality control phantom was designed and produced as an analog of brain MRS test phantoms (Figure 1) in order to control the accuracy of MRS signal provided by a 1.5 T Siemens magnetom avanto MRI system which belonged to one of Shiraz hospitals. The required metabolites to fill the phantom were purchased from Merck and Sigma Aldridge Corporation. The characteristics of the metabolites were demonstrated in Table 1 [23].
Figure1.
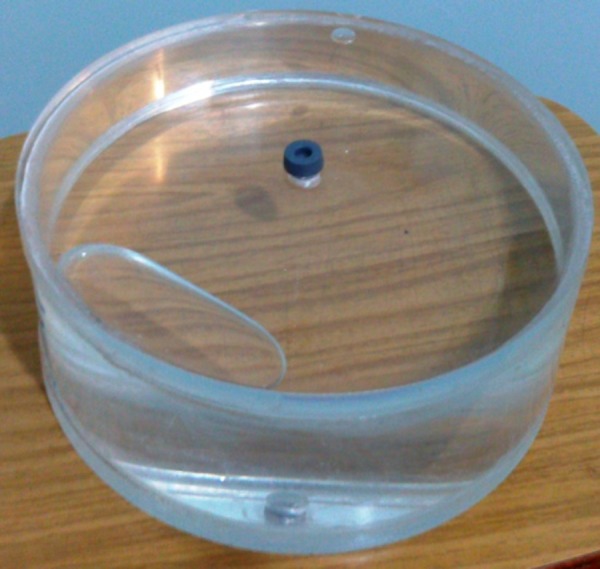
Home-made acrylic cylindrical MRS quality control phantom which contains the metabolites mimicking the brain metabolite combination.
Table 1.
characteristics of the metabolites used in home-made phantom. This component of metabolites simulates the brain metabolite composition [23].
| Metabolite | Concentration (mM) | Peak position (ppm) |
|---|---|---|
| NAA | 12.5 | 2.00 |
| Cho | 3 | 3.2 |
| Cr | 10 | 3.00 and 3.90 |
| M-ins | 7.5 | 3.52 and 4.05 |
| Lac | 5 | 1.30 |
| Glu | 12.5 | 2.50 and 2.63 |
The standard spectrum, which is expected to obtain was known from AAPM #9 [12]. In order to perform single voxel spectroscopy (SVS), the phantom was placed in the head coil and the PRESS sequence with the TE of 144 and 36 ms, TR=1500 ms and voxel size= 8 cm3 was applied. Surprisingly, the spectrum had a significant difference from the expected one.
In order to be sure that this difference was not originating from the material impurity or any other issue relating to the material, the signals of NAA, Cho, Cr, the combination of these metabolites with the same concentrations as explained in Table 1, and also the distilled deionized water which was used in this study were evaluated separately. Moreover, if one of the metabolites or even the water was the source of the problem, it could be detected. The results of all spectroscopic imaging were indicating that there is a systemic problem.
The impurity of water, which existed in all phantoms, was checked by a laboratory specialist. Besides, performing a quality assurance (QA) test seemed to be necessary. The Siemens QA phantom and QA sequences were used to evaluate, free induction decay (FID) raw data and shim quality.
In order to perform the QA tests, the Siemens spherical phantom filled with a 0.1 M solution of sodium acetate and lithium lactate was placed inside the head coil and a body loader phantom was located on the table (Figure 2). The QA sequences such as qa-localizer, qa-fid, and qa- press and steam sequences were applied [22]. The single shot spectrum, single shot time domain data, and accumulated spectrum were checked by the inline display.
Figure2.
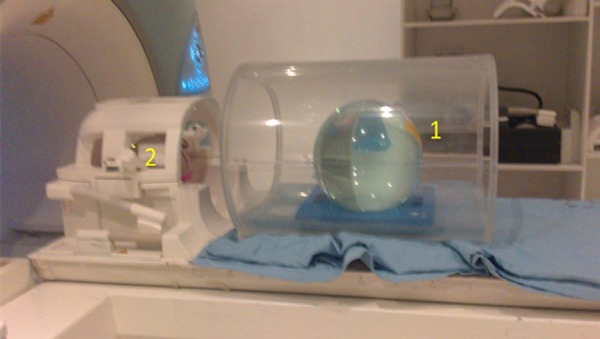
The position of phantoms for QA test. 1- body loader phantom. 2- spherical QA phantom inside the head coil.
For further evaluation of complex signal a standard MRS test phantom manufactured by general electric (GE) company (model 2152220) was assessed by both GE and this Siemens system. This test phantom that has similar metabolites with similar concentrations, has a known signal, and also its evaluation is free from the disturbing factors such as material purity or phantom structure.
Results
The results of SVS from our home- made test phantom using the PRESS sequence, TE 36 and 144 ms has indicated in Figures 3 and 4.
Figure3.
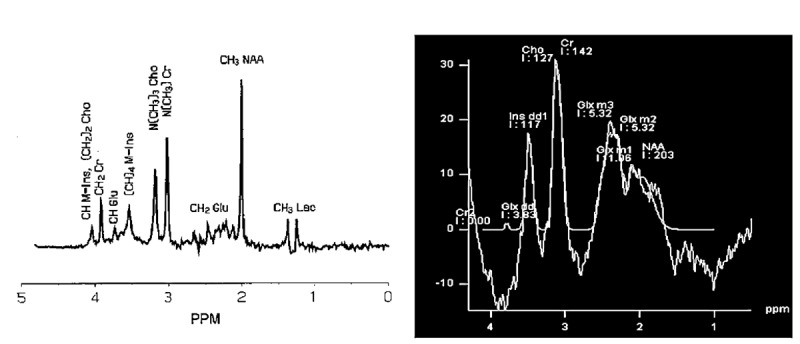
Left image: the expected spectrum of the test phantom provided by 1.5 T Siemens MRI, TR=1500 ms, voxel size= 8 cm3 and TE=36 ms [12]. Right image: the spectrum of the produced phantom with the same metabolite concentration as the test phantom with our 1.5 T Siemens MRI, TR=1500 ms, voxel size= 8 cm3 and TE=36 ms.
Figure4.
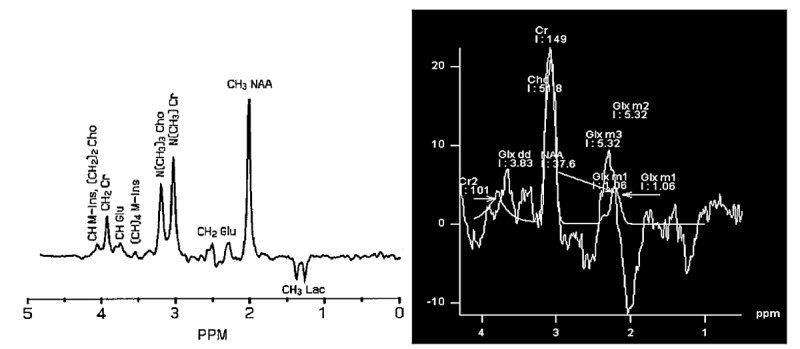
Left image: the expected spectrum of the test phantom provided by 1.5 T Siemens MRI, TR=1500 ms, voxel size= 8 cm3 and TE=144 ms [12]. Right image: the spectrum of the produced phantom with the same metabolite concentration as the test phantom with our 1.5 T Siemens MRI, TR=1500 ms, voxel size= 8 cm3 and TE=144 ms.
Since the results had a significant difference with the expected phantom, and there was a possibility that this problem may result from the impurity of metabolites, NAA, Cho, Cr metabolites and the solvent water signal was checked separately. The results demonstrated in Figures 5 and 6.
Figure5.
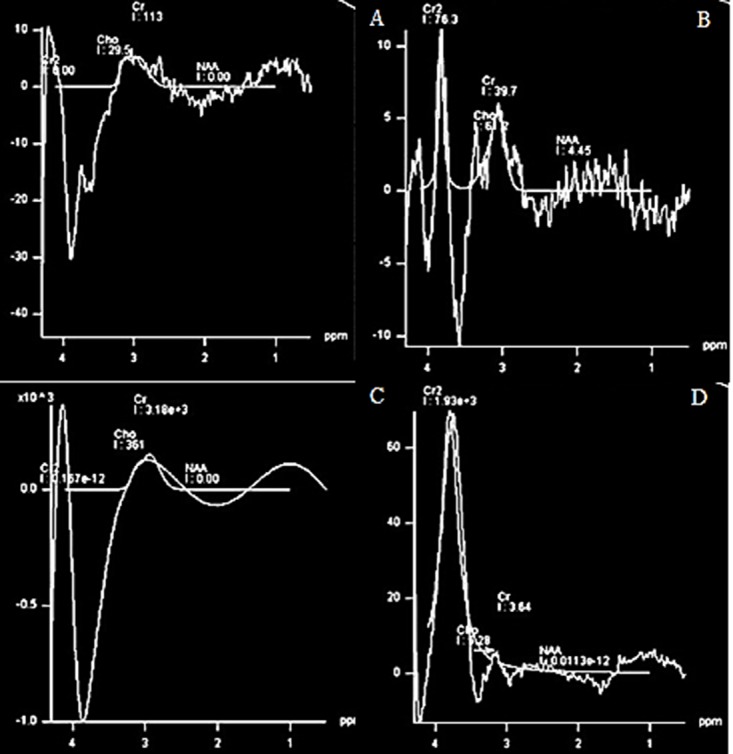
The spectra resulted from A) NAA, B) Cho, C) Cr and D) combination of NAA, Cho, Cr with a concentrations similar to test phantom, using PRESS sequence, TR=1500 ms, TE= 135 and voxel size 8 cm3.
Figure6.
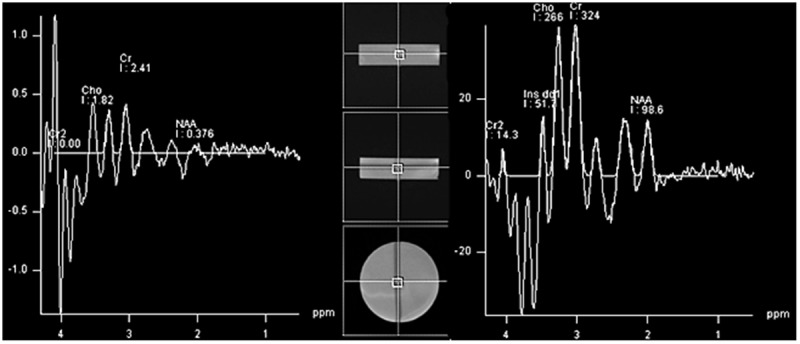
Signal of distilled water using PRESS sequence, TR=1500 ms, voxel size= 8 cm3 and TE=135 ms (left image), TE=30 ms (right image).
Although the water signal at TE= 30 ms showed a mild signal of Cr, Cho, and NAA, the results of laboratory test were that the water is pure enough with a few impurities which is normal in distilled water.
For the reason that all obtained signal were odd and wide, the QA procedure was performed and FID raw data and shim quality were checked. The results of QA tests illustrated in Figure 7.
Figure7.
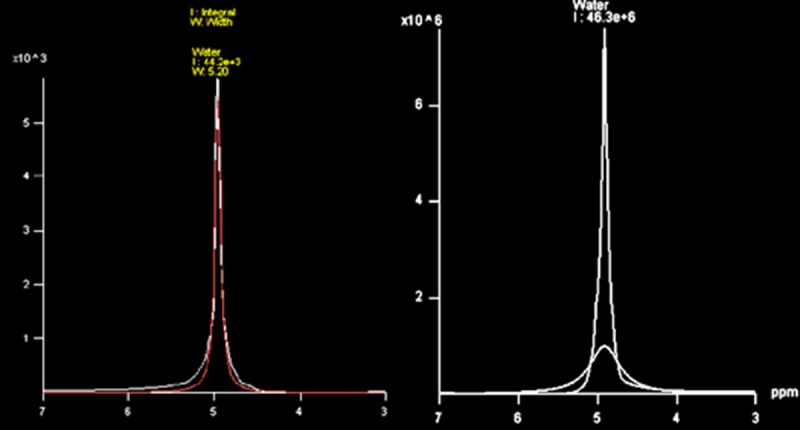
Obtained FID raw data, FWHM= 5.20 (right image), in comparison to expected raw data of FID, FWHM= 29.30 (left image). The width of the signal should be less than 15 Hz.
All the other QA sequences containing PRESS and STEAM with different TEs were performed. The results presented in Figure 8.
Figure8.
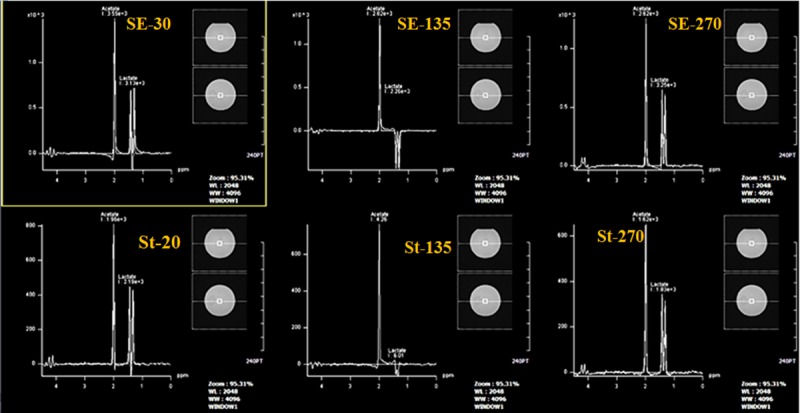
upper row: Results of PRESS sequences with the TEs of 30, 135 and 270 ms. lower row: STEAM sequences with the TEs of 20, 135 and 270 ms.
The other test was real time observing the single shot spectrum, single shot time domain data, and accumulated spectrum during 30 min to check the signal drifts. The results demonstrated in Figure 9.
Figure9.
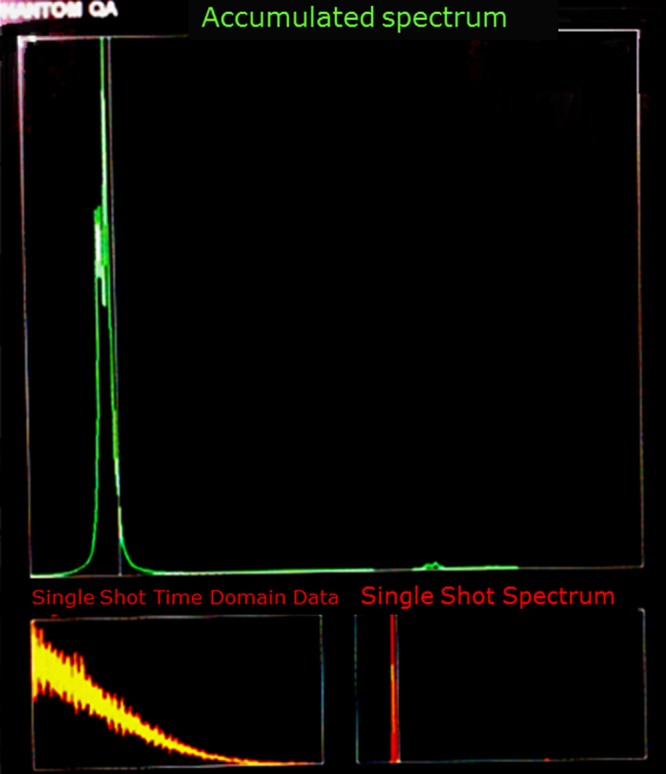
Inline display of single shot spectrum, single shot time domain data, and accumulated spectrum during 30 min.
To check a complex signal from multiple metabolites, the signal of the GE test phantom was provided by both GE and this Siemens system. The spectra obtained from each device was shown in Figure 10.
Figure10.
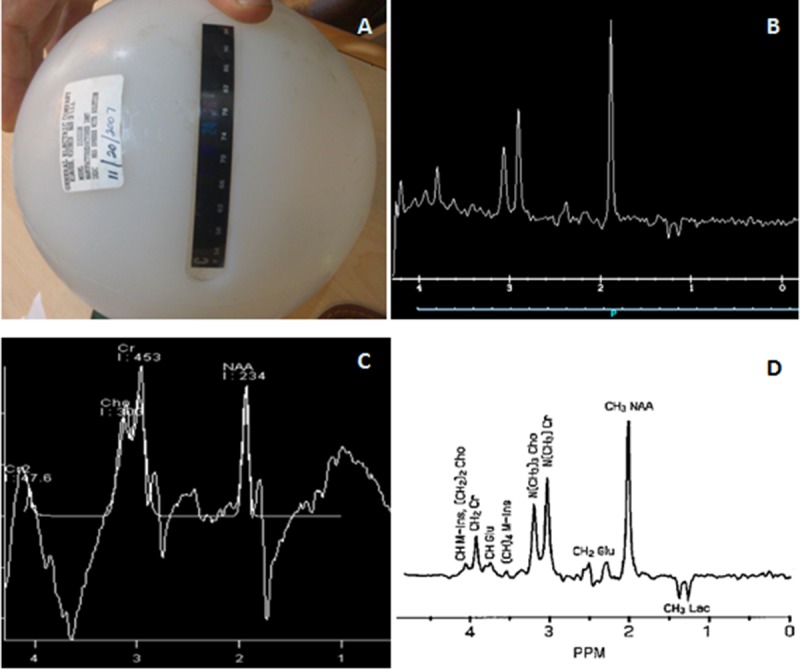
A) GE test phantom, B) spectrum obtained by GE system, C) spectrum provided by our system, D) spectrum which expected to be seen.
Discussion
Periodic QA and system tuning is a necessity for medical diagnostic devices, especially the sensitive devices which apply to be able to make the deterministic hard decisions for the patient. For instance, MRS can differentiate different brain tumors from each other or it can determine the tumor stage, with this information, according to patient prognosis the physician can choose the proper treatment method. Consequently, having or not having an accurate information can save or kill the patient. QA and tuning result in providing the reliable information.
In this study, a research project lead to detecting a serious problem of the MRI system. Despite there was no report of the problem in the spectra produced by the system, but it did not provide a standard spectrum from our home- made phantom and even it could not pass the other quality control tests.
Figures 3 and 4 which were the results of the spectra provided by the mentioned system compared with expected spectra. The figures revealed that there is a problem in the system. The spectra achieved from PRESS sequences with TEs of 144 and 36 ms were not similar to expected signal. The peaks were broad and the relative quantifications or simply the ratio of metabolite signal was not accurate. For instance, considering the concentration of metabolites (Table 1) the ratio of NAA/ Cho should be 4.16 but the ratio of NAA and Cho integrals provided at TE=36 ms, was 1.6. Furthermore, the peaks of Cho and Cr couldn’t be resolved.
The NAA, Cho, Cr and water signals were evaluated in separate acrylic phantom and in a mixture with the concentrations as Table 1. Figures 5 and 6 also confirmed that there was a systemic problem that affects all the signals originated from all metabolites and even the distilled water. Figure 5A to C which are the spectra of NAA, Cho and Cr should have a sharp peak at 2, 3.2 and 3 ppm, but none of them demonestrated a correct spectrum. Figure 5D which is the spectra of the mentioned metabolite mixture, should have shown a sharp peak of NAA with a more amplitude in comparison to Cr, Cr2, and Cho peaks, but the spectrum showed a broad peak of Cr2, and other peaks of metabolites were not even close to which expected. There are even some disturbing signals in the pure water is more obvious at TE=30 ms.
Peak broadening was common in all spectra, which can suddenly be recognized and confirmed in the evaluation of FID raw data. Figure 7 revealed that the signal was very broad with the FWHM of 29.30 Hz, which is two times wider than acceptable criteria (FWHM=15 Hz). The evaluation of other QA sequences, including PRESS and STEAM with different TEs should have demonstrated acetate and lactate signals. The spectrums should have a clean baseline with sharp peaks of acetate and lactate doublets which were in the phantom solution. The phases of acetate and lactate signals should be in phase at TE= 30 and 270 ms but inverted phased at TE= 135 ms in PRESS sequences, but using STEAM sequences the signals should be always in phase. All sequences followed this rule except the STEAM sequence which presented an inverted phased signal at TE= 135ms (Figure 8).
Figure 9 also confirmed the peak broadening, since accumulated spectrum demonestrated a broad peak, which was not centered at the reference frequency like single shot spectrum. The complex spectrum of standard test phantom was produced successfully by GE MRI system and the spectrum resembled expected spectrum. However, our system could not provide an acceptable spectrum of test phantom.
In order to diagnose the problem, the defective device was evaluated and tuned up by the engineers of Iranian Siemens representation. An error was observed in eddy current compensation evaluation, which was attributed to the fault in gradient power amplifier (GPA) y and z.
As it was explained before, Shimming is regulating the resolution of the signal by improving the homogeneity of the magnetic field. Eddy currents create extra magnetic fields which add to the static field B0 so that just like magnet inhomogeneities, these currents can destroy the shimming and result in peak shape distortion.
Conclusion
AAPM #9 suggests that the MRS test phantom should use every 1-4 weeks with all sequences so as to check the system regarding water and metabolite peak areas, peak FWHMs, and baseline noise. By a simple check of the water peak characteristics, lots of information can be obtained, one of which is the status of shimming that has a considerable effect on the accuracy of the spectrum. Thus, performing an automatic or manual shimming is not a criterion of the spectrum accuracy, and performing a periodic quality control using a test phantom by a specialist is necessary. Furthermore, the staff that work with MRS should be trained to understand the spectrum and can recognize at least the major problems of the system such as peak broadening and report to MRI physicist.
Briefly, the quality control of MRS and all the other clinical device must be taken seriously. Sometimes QC can be the boundary of a right or a wrong decision for the patient.
Acknowledgement
The present study was sponsored by a research grant (number: 1396-01-48-15547) from the Vice Chancellor for research, Shiraz University of Medical Sciences.
Conflict of Interest:On behalf of all authors, the corresponding author states that there is no conflict of interest.
References
- 1.Blüml S. Magnetic resonance spectroscopy: basics. MR spectroscopy of pediatric brain disorders: Springer; 2013. pp. 11–23. [Google Scholar]
- 2.Wuthrich K. Protein structure determination in solution by nuclear magnetic resonance spectroscopy. Science. 1989;243:45–50. doi: 10.1126/science.2911719. [DOI] [PubMed] [Google Scholar]
- 3.Leary SM, Davie CA, Parker GJ, Stevenson VL, Wang L, Barker GJ, et al. 1H magnetic resonance spectroscopy of normal appearing white matter in primary progressive multiple sclerosis. J Neurol. 1999;246:1023–6. doi: 10.1007/s004150050507. [DOI] [PubMed] [Google Scholar]
- 4.Van der Knaap MS, Pouwels P. Magnetic resonance spectroscopy: basic principles and application in white matter disorders. Magnetic resonance of myelination and myelin disorders: Springer; 2005. pp. 859–80. [Google Scholar]
- 5.Kurth J, Defeo E, Cheng LL. Magnetic resonance spectroscopy: a promising tool for the diagnostics of human prostate cancer? Urol Oncol. 2011;29:562–71. doi: 10.1016/j.urolonc.2011.05.016. [ PMC Free Article] [DOI] [PMC free article] [PubMed] [Google Scholar]
- 6.Faghihi R, Zeinali-Rafsanjani B, Mosleh-Shirazi MA, Saeedi-Moghadam M, Lotfi M, Jalli R, et al. Magnetic Resonance Spectroscopy and its Clinical Applications: A Review. Journal of Medical Imaging and Radiation Sciences. 2017 doi: 10.1016/j.jmir.2017.06.004. [DOI] [PubMed] [Google Scholar]
- 7.Stork C, Renshaw PF. Mitochondrial dysfunction in bipolar disorder: evidence from magnetic resonance spectroscopy research. Mol Psychiatry. 2005;10:900–19. doi: 10.1038/sj.mp.4001711. [DOI] [PubMed] [Google Scholar]
- 8.Maudsley AA, Govind V, Levin B, Saigal G, Harris L, Sheriff S. Distributions of Magnetic Resonance Diffusion and Spectroscopy Measures with Traumatic Brain Injury. J Neurotrauma. 2015;32:1056–63. doi: 10.1089/neu.2014.3505. [ PMC Free Article] [DOI] [PMC free article] [PubMed] [Google Scholar]
- 9.Öz G. Magnetic resonance spectroscopy of degenerative brain diseases: Springer; 2016. [Google Scholar]
- 10.Chitty KM, Lagopoulos J, Hickie IB, Hermens DF. A longitudinal proton magnetic resonance spectroscopy study investigating oxidative stress as a result of alcohol and tobacco use in youth with bipolar disorder. J Affect Disord. 2015;175:481–7. doi: 10.1016/j.jad.2015.01.021. [DOI] [PubMed] [Google Scholar]
- 11.Wright A, Ma R, Hummer T, Francis M, Mehdiyoun N, Dydak U, et al. SU-F-SPS-07: Magnetic Resonance Spectroscopy Findings in Early-Phase Psychosis. Med Phys. 2016;43:3351. [Google Scholar]
- 12.Drost DJ, Riddle WR, Clarke GD, Group AMT. Proton magnetic resonance spectroscopy in the brain: report of AAPM MR Task Group #9. Med Phys. 2002;29:2177–97. doi: 10.1118/1.1501822. [DOI] [PubMed] [Google Scholar]
- 13.Chmurny GN, Hoult DI. The ancient and honourable art of shimming. Concepts in Magnetic Resonance. 1990;2:131–49. [Google Scholar]
- 14.Juchem C, de Graaf RA. B0 magnetic field homogeneity and shimming for in vivo magnetic resonance spectroscopy. Anal Biochem. 2017;529:17–29. doi: 10.1016/j.ab.2016.06.003. [ PMC Free Article] [DOI] [PMC free article] [PubMed] [Google Scholar]
- 15.McLean MA [Internet] 1D and 2D Quantification Methods. Available from: http://afni.nimh.nih.gov/sscc/staff/rwcox/ISMRM_2006/Syllabus%202006%20-%203340/files/G_04.pdf .
- 16.Hull WE. NMR Tips for Shimming, Part II. Computerized shimming with the Simplex algorithm Bruker SpinReport. 2004:154–5. [Google Scholar]
- 17.Tkac I, editor Shimming, & MRS. Proc Intl Soc Magn Reson Med; 2010. [Google Scholar]
- 18.Schneider E, Glover G. Rapid in vivo proton shimming. Magn Reson Med. 1991;18:335–47. doi: 10.1002/mrm.1910180208. [DOI] [PubMed] [Google Scholar]
- 19.de Graaf RA, Juchem C. B0 Shimming Technology. In: Webb AG, editor. Magn Reson Technol Hardw Syst Compon Des. London: Royal Society of Chemistry; 2016. pp. 166–207. [Google Scholar]
- 20.Zhang H, Xue H, Alto S, Hui L, Kannengiesser S, Berthold K, et al. Integrated Shimming Improves Lesion Detection in Whole-Body Diffusion-Weighted Examinations of Patients With Plasma Disorder at 3 T. Invest Radiol. 2016;51:297–305. doi: 10.1097/RLI.0000000000000238. [DOI] [PubMed] [Google Scholar]
- 21.O’Reilly T. New Developments in Dielectric Shimming for Neuroimaging in MRI at 7T 2015. [Google Scholar]
- 22.Siemens Healthineers. Syngo MR B19, basic manual- spectroscopy. 2012. [Google Scholar]
- 23.Belkic K. Molecular imaging through magnetic resonance for clinical oncology: Cambridge Int Science Publishing; 2004. [Google Scholar]


