

ABSTRACT
Macrophages in the tumor microenvironment respond to complex cytokine signals. How these responses shape the phenotype of tumor-associated macrophages (TAMs) is incompletely understood. Here we explored how cytokines of the tumor milieu, interleukin (IL)-6 and IL-4, interact to influence target gene expression in primary human monocyte-derived macrophages (hMDMs). We show that dual stimulation with IL-4 and IL-6 synergistically modified gene expression. Among the synergistically induced genes are several targets with known pro-tumorigenic properties, such as CC-chemokine ligand 18 (CCL18), transforming growth factor alpha (TGFA) or CD274 (programmed cell death 1 ligand 1 (PD-L1)). We found that transcription factors of the signal transducer and activator of transcription (STAT) family, STAT3 and STAT6 bind regulatory regions of synergistically induced genes in close vicinity. STAT3 and STAT6 co-binding further induces the basic leucine zipper ATF-like transcription factor (BATF), which participates in synergistic induction of target gene expression. Functional analyses revealed increased MCF-7 and MDA-MB 231 tumor cell motility in response to conditioned media from co-treated hMDMs compared to cells incubated with media from single cytokine-treated hMDMs. Flow cytometric analysis of T cell populations upon co-culture with hMDMs polarized by different cytokines indicated that dual stimulation promoted immunosuppressive properties of hMDMs in a PD-L1-dependent manner. Analysis of clinical data revealed increased expression of BATF together with TAM markers in tumor stroma of breast cancer patients as compared to normal breast tissue stroma. Collectively, our findings suggest that IL-4 and IL-6 cooperate to alter the human macrophage transcriptome, endowing hMDMs with pro-tumorigenic properties.
Keywords: primary human monocyte derived macrophages (hMDMs), interleukins, RNA sequencing, signal transducer and activator of transcription (STAT), basic leucine zipper ATF-like transcription factor (BATF), CRISPR interference (CRISPRi)
Introduction
Crosstalk of tumor and immune cells is critical to promote tumor progression and metastasis.1-3 A major outcome of this interaction helps in reshaping of gene expression landscapes and functional properties of tumor-resident and infiltrating myeloid cells, such as myeloid derived suppressor cells (MDSCs) or tumor-associated macrophages (TAMs).4,5 As a result, tumor myeloid cells promote tumor growth and invasiveness, support angiogenesis, and help tumor cells evade immune surveillance mechanisms.6 Among immunosuppressive actions exerted by tumor myeloid cells, surface expression of a T-cell inhibitory receptor, programmed cell death 1 ligand 1 (PD-L1, synonym CD274) is prominent in TAMs, MDSCs as well as in tumor cells. PD-L1 expression is induced by IFNγ or under hypoxic conditions.7-9 Induction of PD-L1 induces T cell anergy or inhibits cytotoxic T lymphocyte activation,10-13 thereby facilitating tumor progression. TAMs may also promote malignant cell evasion from the antibody-dependent cell-mediated phagocytosis by activating inhibitory Fc receptors (FCGR2B/CD32b) or inhibiting activation receptors (FCGR1A/CD16, FCGR3A/CD64).14 Furthermore, TAMs release numerous cytokines and chemokines, some of them, such as CC-chemokine ligand 18 (CCL18), with distinct pro-tumorigenic properties.15,16
Pro-tumorigenic phenotype remodeling of tumor-infiltrating myeloid cells is greatly influenced by soluble factors secreted by tumor and stromal cells such as chemokines, cytokines and metabolites. For instance, breast tumor cells release high amounts of lactate and GM-CSF, switching TAMs towards a pro-metastatic phenotype characterized by high levels of CCL18 secretion.15,17 Another prominent cytokine of the tumor microenvironment is interleukin-6 (IL-6)18 that acts either pro- or anti-inflammatory in a context-dependent manner. IL-6 binds to the IL-6 receptor α chain and transduces downstream signaling via gp130 receptor that recruits Jak2 tyrosine kinases and signal transducer and activator of transcription 3 (STAT3) transcription factors. Activated STAT3 induces IL-6 target genes, such as suppressor of cytokine signaling 3 in macrophages. IL-6 is released in the tumor microenvironment by tumor as well as stromal cells, including fibroblasts, endothelial cells and macrophages.19-22 The mode of IL-6 action is influenced by its cooperation with other cytokines. For example, cooperation of IL-6 with IL-1β and TNFα potentiates pro-inflammatory outcomes whereas complementing IL-6 with IL-4/IL-13 is anti-inflammatory.18,23,24 Similarly, the cytokines IL-4 and IL-13 released by adipose tissue, Th2 T cells and tumor cells in breast, pancreatic, and glioblastoma cancers25,26 can polarize TAMs towards an anti-inflammatory phenotype to support tumor progression and metastasis.27–29
How combinations of cytokines and other soluble factors of the tumor microenvironment shape the TAM phenotype is poorly understood. Investigating different cytokine polarization patterns gives insights into designing effective therapies to reprogram TAMs towards anti-tumor phenotypes.30 Recently, a study investigating the synergistic effects of IL-4 and IL-6 to promote TAMs pro-invasive properties was reported in murine bone marrow-derived macrophages (BMDMs).31 Another example of cytokine interactions depicted an antagonism of IFNγ-stimulated transcriptional response by IL-4.32 However, the mechanism how IL-6 maintains its dichotomous role in shaping the phenotype of human macrophages is unclear. In this study, we address the mechanistic and functional aspects of how IL-6 interacts with IL-4 to polarize primary human monocyte derived macrophages (hMDMs) and explore co-regulated target genes.
Results
Analysis of human macrophage transcriptome changes in response to IL-4 and IL-6
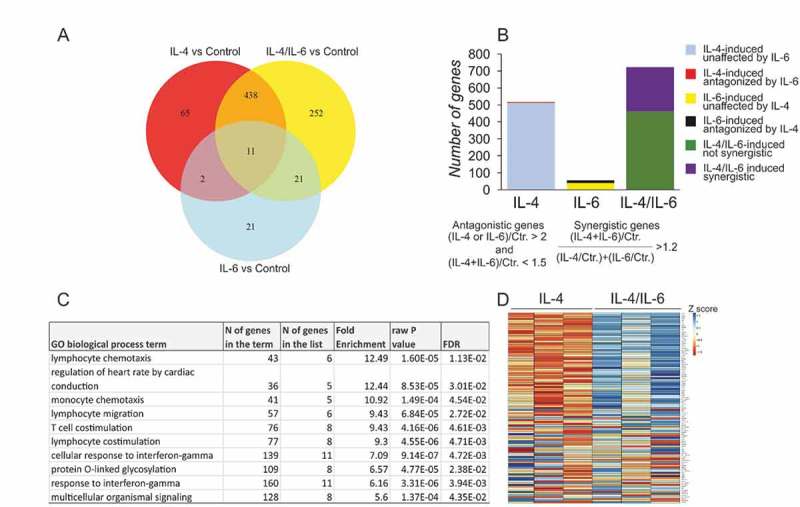
To explore how the human macrophage transcriptome changes in response to single and combined IL-4/IL-6-treatments, we performed RNA sequencing of hMDMs stimulated for 24h with IL-4 or IL-6 alone, and in combination (Suppl. Table S1). Principal component analysis (PCA) revealed a diverse response between biological replicates, as reported earlier33 (Suppl. Figure 1A). However, we could show while comparing the response to two different stimuli between biological replicates, the fold-changes agree by and large (Suppl Figure 1B). We next curated differentially expressed genes between control, single and combined cytokine treatment conditions with a (│log2FoldChange│≥ 1, p ≤ 0.05) relative to untreated control (Suppl. Table S2). Figure 1A shows the overlap between upregulated genes (log2FoldChange≥ 1, p ≤ 0.05) upon treatments with IL-4, IL-6 and IL-4/IL-6 in Venn diagram (Suppl. Table S3). We noted that of the 722 genes upregulated genes in co-treated (IL-4/IL-6) hMDMs, 60% were also upregulated upon IL-4 stimulation (438), but only 3% were upregulated by IL-6 alone (21). Considerably fewer genes are uniquely upregulated upon either IL-6 (21) or IL-4 (65) treatment. Interestingly, we found 252 genes uniquely upregulated when hMDMs were co-treated with both IL-4 and IL-6. These genes are neither individual IL-4 or IL-6 targets, but their expression is induced at least by a factor of 2-fold relative to the control upon dual stimulation. We find amongst these genes membrane receptors, cytokines and immune activation receptors (Suppl. Table S3). A Gene Ontology (GO) analysis34,35 of these 252 genes using online Panther tool’s GO biological process annotation revealed enrichment of IFNγ-signaling pathways as well as extracellular cell matrix and adhesion pathways (Suppl. Figure 1C).
Figure 1.
Transcriptome changes in macrophages upon IL-4 and IL-6 stimulation.
(A) Venn diagram displaying numbers of upregulated genes in hMDMs following IL-4, IL-6, and IL-4/IL-6 treatments relative to control. (B) Visualization of numbers of synergistically and antagonistically regulated genes. (C) List of top 10 significantly enriched GO biological processes for synergistically induced IL-4/IL-6 target genes. (D) Heat map of 109 differentially regulated genes between IL-4/IL-6 and IL-4 treatments.
In addition, we identified genes that are controlled by IL-4 and IL-6 in an antagonistic or in a synergistic fashion upon dual stimulation (Figure 1B, Suppl. Table S4) according to previously described criteria (see material and methods for detailed description).36 Our results indicate that IL-6 has almost no opposing effects on the IL-4-induced genes, however IL-4 co-treatment does antagonize 25% (14 out of 55) of IL-6 target genes. Remarkably, 262 out of 722 upregulated genes upon dual stimulation (log2FoldChange≥ 1, p < 0.05) were synergistically induced. GO analysis of synergistically induced genes revealed significantly enriched pathways associated with immune cells (Figure 1C). Importantly, lymphocyte and monocyte chemotaxis as well as lymphocyte co-stimulation and the response to IFNγ were among top 10 significantly enriched biological processes.
Whereas IL-6 on its own induces relatively few genes, it has a considerable impact on the IL-4-induced gene expression. Therefore, we analyzed IL-6 mediated changes in dual stimulation by performing a differential gene expression analysis between IL-4/IL-6 and IL-4-treated conditions (│log2FoldChange│≥ 1, p ≤ 0.05). We observed that 109 genes were differentially regulated between IL-4/IL-6 and IL-4 stimulations (Figure 1D, Suppl. Table S5). Amongst these 109 genes, 23 IL-4 target genes (e.g. CCL18, CCL8, CCL17, CCL23, TGFA, BATF) were upregulated and 2 were downregulated (BCL11B, INPP4B) upon dual stimulation. In addition, 11 IL-6 target genes (e.g. FAM20A, AQP3, SOCS3) were upregulated and 4 were downregulated (FPR, FPR2, GPR85, KCNK15). 61 of the 109 differentially regulated targets were unique to dual stimulation and 8 genes were not only differentially expressed under IL-4/IL-6 relative to IL-4-treatment conditions, but were also differentially expressed in IL-4 vs control and IL-6 vs control (e.g. TGFB1, ENPP2, EHF, GGT5).
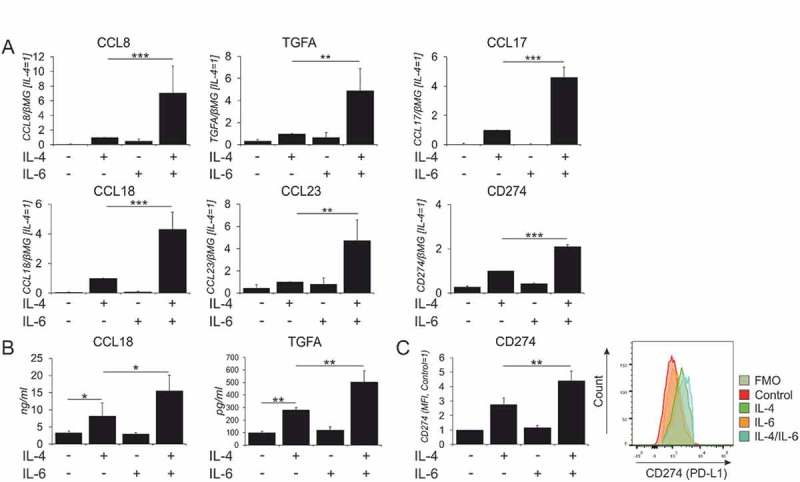
We validated transcriptome changes revealed by RNA sequencing for selected synergistically induced genes with known functions in macrophages by Q-PCR and protein expression analyses. Particularly, dual stimulation enhances the expression of several chemokines targeted by IL-4 (CCL17, CCL18, CCL23 and CCL8). We observed induction of TGFA gene encoding an EGF receptor ligand as well as upregulation of CD274, coding for an immunosuppressive PD-L1 cell surface receptor at mRNA (Figure 2A) and protein levels (Figure 2B, C). We also validated genes uniquely induced by dual stimulation (Suppl. Figure 2A), including membrane receptors (CFI, CLEC7A) and chemokines (CCL2, CXCL13). In addition, we confirmed that IL-4 stimulation antagonized some IL-6 target genes (e.g. CD163 and FCGR1A) (Suppl. Figure 2B, 2C). Since the inhibitory immunoglobulin receptor FCGR2B was synergistically upregulated after IL-4/IL-6 co-treatment (Suppl. Table S4), we measured the expression levels of IgG Fc receptors and found upregulation of the inhibitory receptor FCGR2B at mRNA and protein level, whereas the activation receptors, FCGR1A and FCGR3A were downregulated in IL-4- and IL-4/IL-6-treated cells (Suppl. Figure 2 C-E). Analysis of typical markers associated with anti-inflammatory macrophage polarization revealed that CD206 mRNA expression was enhanced in dual stimulation as compared to control and single cytokine stimulations, but there were no alterations of IL-10 and TGFB1 mRNA expression relative to control or individual treatments (Suppl. Figure 2F).
Figure 2.
In vitro validation of synergistically induced IL-4/IL-6 target genes..
(A) mRNA expression analysis for indicated genes in macrophages treated for 24h with IL-4 and IL-6 alone or in combination. (n ≥ 4–5) (B) Protein secretion of CCL18 and TGFα determined by ELISA (n = 3) and (C) MFI for surface expression of CD274 in macrophages treated for 48h with IL-4 and IL-6 alone or in combination (left) and representative FACS histogram (right) (n = 4). Data are presented as mean± SD. *, p < 0.05, **, p < 0.01, ***, p < 0.005. mRNA expression is normalized to housekeeping gene β2-microglobulin (βMG).
Recent analysis of IL-4/IL-6 co-treated murine macrophages31 showed a critical role of inositol requiring enzyme-1α (IRE-1α) branch of unfolded protein response in mediating the synergy of IL-4 and IL-6 to alter gene expression. Comparing the corresponding data to that generated during our analysis revealed considerable differences (Suppl. Table S6). We found neither differences in IRE-1α-dependent or -independent ER stress responses (Suppl. Figure 3A), nor mRNA or protein changes for the majority of cathepsin genes upregulated in the murine system (Suppl. Figure 3B, C).
Figure 3.
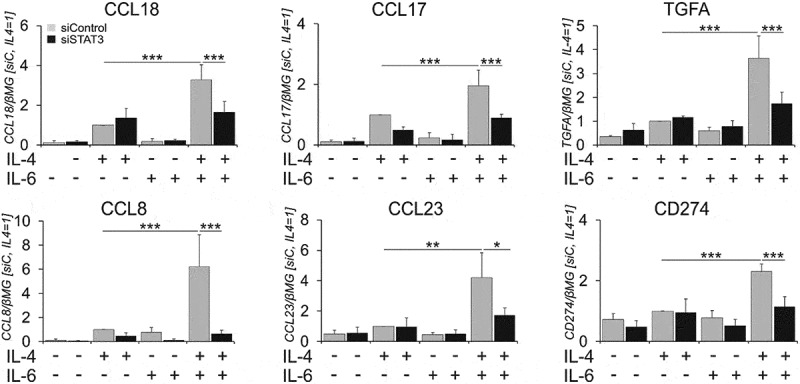
IL-6 synergy with IL-4 requires STAT3..
mRNA expression of indicated genes in macrophages transfected with control or STAT3 siRNAs for 72h prior to 24h-treatments with IL-4 and IL-6 alone or in combination (n = 4). Data are presented as mean± SD. *, p < 0.05, **, p < 0.01, ***, p < 0.005. mRNA expression is normalized to housekeeping gene β2-microglobulin (βMG). siC, control siRNA.
Since it was shown that IL-13 employs similar signaling as IL-4, whereas signaling by IL-6 may be partly mimicked by IL-10, we asked whether IL-13 and IL-10 can substitute for IL-4 and IL-6 to induce IL-4/IL-6 co-regulated genes. Both IL-4/IL-10 and IL-13/IL-6 had similar effects on the induction of CCL18, TGFA and CD274 as compared to IL-4/IL-6 treatment (Suppl. Figure 4A).
Figure 4.
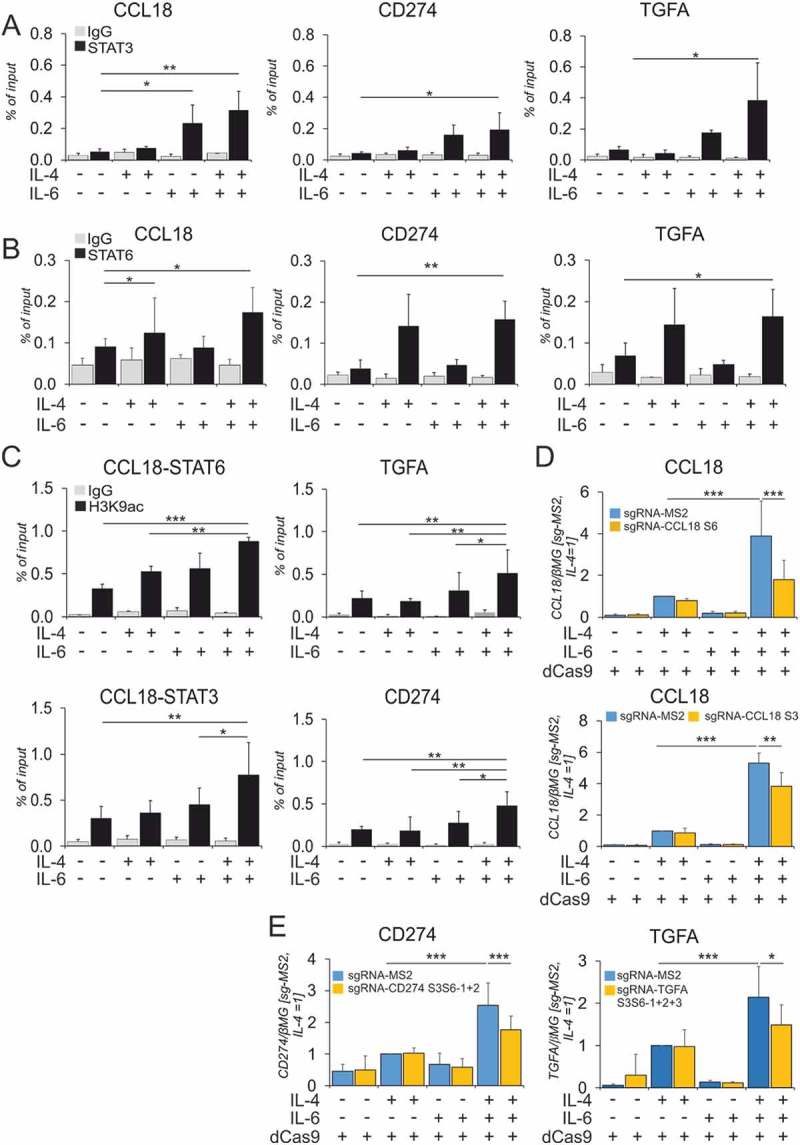
STAT3 and STAT6 bind the GRRs of co-induced target genes..
(A-C) Macrophages were treated for 1h with IL-4 and IL-6 alone or in combination for (A) STAT3 ChIP, (B) STAT6 ChIP and 6h for (C) H3K9ac ChIP for indicated genes (n ≥ 4–6). mRNA expression of (D) CCL18 after inhibition of STAT6- (upper panel) and STAT3- (lower palnel) binding sites in CCL18 GRR (n = 9) and (E) CD274 and TGFA expression after blocking two STAT3/STAT6 and three STAT3/STAT6 co-binding sites (n ≥ 5–6) using CRISPRi-KRAB for 24h followed by stimulation with IL-4 and IL-6 for 24h. Data are presented as mean± SD. *, p < 0.05, **, p < 0.01, ***, p < 0.005. mRNA expression is normalized to housekeeping gene β2-microglobulin (βMG). sg-RNA-MS2, sg-RNA-S3 or sg-RNA-S6 denote empty non-targeting control, sgRNA targeting STAT3 or STAT6 binding sites in CCL18 GRR. sgRNA S3S6-1 + 2 or S3S6-1 + 2 + 3 denote individual sgRNAs used to target different STAT3 or STAT6 co-binding (2-10bp apart) sites in the CD274 or TGFA GRRs. dCas9 denotes dead-Cas9 fused to KRAB repressor domain vector.
Il-6-induced upregulation of IL-4 target genes is stat3-dependent
Signals by IL-4 and IL-6 are majorly transduced by STAT6 and STAT3, respectively. Upon receptor activation, STAT6 and STAT3 undergo tyrosine phosphorylation and nuclear translocation. Analyzing tyrosine phosphorylation of STAT3 and STAT6 in whole cell lysates (Suppl. Figure 5A) or nuclear extracts (Suppl. Figure 5B) upon IL-6 and IL-4 stimulation, we observed expected increases of STAT3 phosphorylation in IL-6-treated cells and STAT6 phosphorylation in IL-4-treated cells. However, neither changes in STAT6, nor STAT3 phosphorylation were detected after dual stimulation as compared to single cytokine treatments. To assess the role of STAT3 in upregulating IL-4 target genes upon dual stimulation, we silenced STAT3 expression using siRNA, followed by single and dual cytokine treatments. A STAT3 knockdown reduced target gene expression in co-treated cells to levels observed in cells treated with IL-4 alone (Figure 3. Suppl Figure 5 C, D), indicating that STAT3 is critical for the stimulatory effect of IL-6.
Figure 5.
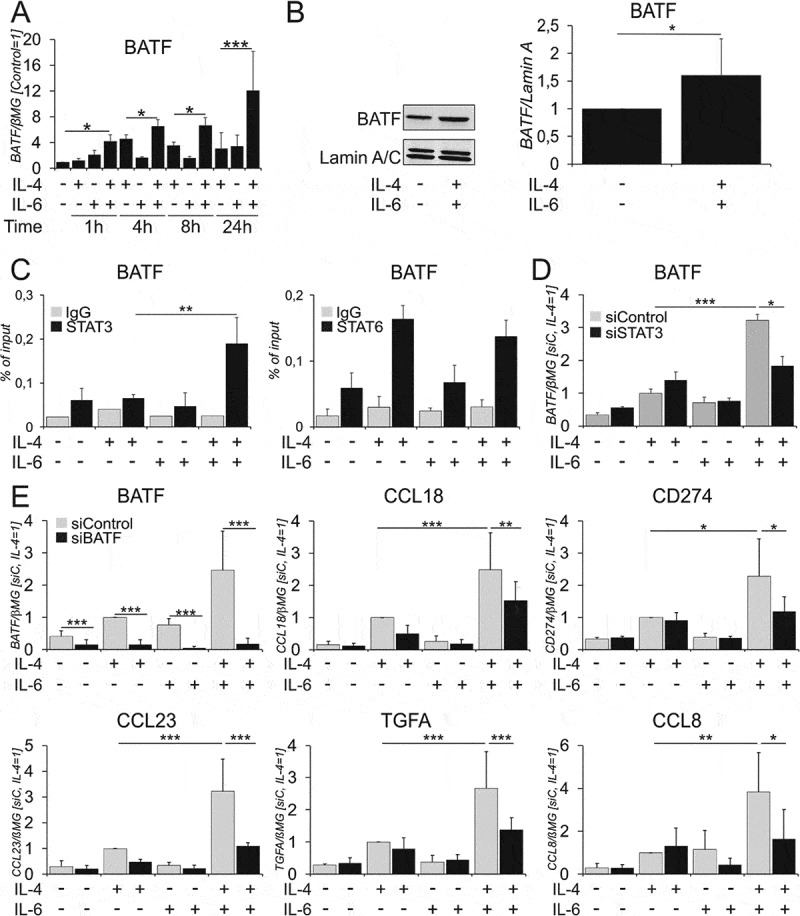
BATF cooperates with STAT3 and STAT6 to regulate the expression of co-induced genes..
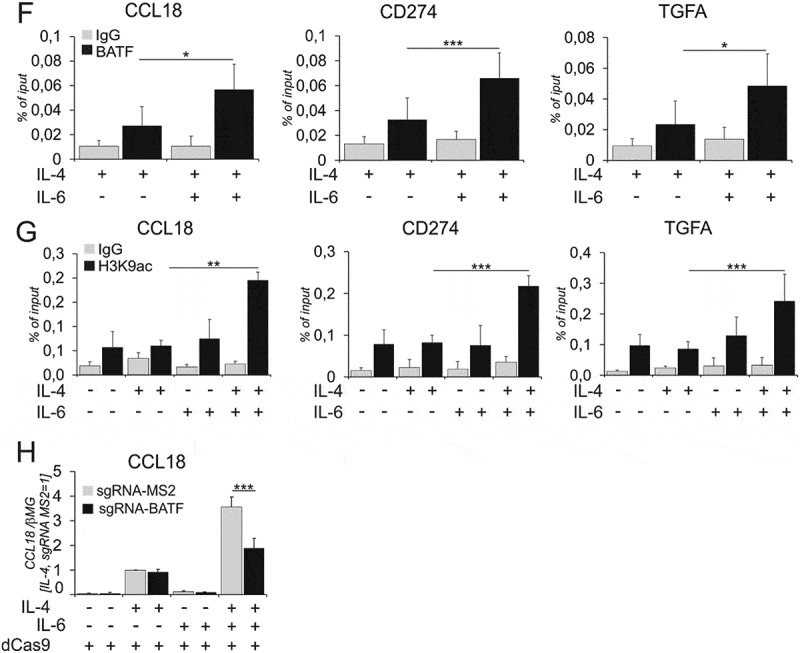
(A) Time course of BATF mRNA expression after treatments with IL-4 and IL-6 alone or in combination (n = 4). (B) BATF protein in nuclear extracts of human macrophages treated with IL-4 and IL-6 for 1h (n = 11). P-value was calculated via two-tailed paired Student’s t-test, *p < 0.05. (C) STAT3 and STAT6 binding in the GRRs of BATF 1h after cytokine treatments (n = 4). (D) BATF mRNA expression in macrophages transfected with STAT3 siRNA 72h prior to 24h cytokine treatments. (n = 3) (E) mRNA expression of indicated genes in macrophages transfected with BATF siRNA 24h prior to 24h cytokine treatments (n = ≥ 6–7). (F, G) ChIP analysis of BATF binding (n ≥ 3) (F) and histone H3 K9 acetylation (G) at GRRs of indicated genes in macrophages treated for 6h with IL-4 and IL-6 alone and in combination (n ≥ 3–6) (H) CCL18 mRNA expression in macrophages transfected with CRISPRi against the BATF binding sites and treated for 24h with IL-4 and IL-6 alone and in combination (n = 3). Data are presented as mean± SD. *, p < 0.05, **, p < 0.01, ***, p < 0.005. mRNA expression is normalized to housekeeping gene β2-microglobulin (βMG). sg-RNA-BATF represents sgRNA blocking BATF binding site in CCL18 GRR, dCas9 is dead-Cas9 fused to KRAB repressor domains.
From the synergistically induced target genes, we focused on three candidates: CD274 as a target involved in T cell immunosuppression, CCL18, a chemokine promoting tumor cell invasion and metastasis, and TGFA, a growth factor promoting tumor cell proliferation. We next investigated STAT3 and STAT6 binding to cognate sites in target gene regulatory regions (GRRs) upon single and combined cytokine treatments. We explored the STAT3/STAT6 binding sites using transcription factor binding site prediction software JASPAR37 as well as existing ChIP-seq data across different cell lines.38-40 We validated multiple sites (Suppl. Table S7) for co-binding of STAT3 (Figure 4A) and STAT6 (Figure 4B) in GRRs of CCL18, TGFA and CD274. STAT3 bound 8.1Kb upstream and STAT6 7.6Kb upstream of the transcription start site (TSS) in the CCL18 GRR, whereas STAT3 and STAT6 bound in close proximity (2–10bp apart) for CD274 (9Kb downstream of the TSS) and TGFA (37.6Kb downstream of the TSS). In total we found 2, 3 and 4 STAT6 binding sites and 1, 3 and 6 STAT3 binding sites for CCL18, CD274 and TGFA (Suppl. Table S7). Whereas IL-4 induced binding of STAT6 and IL-6 increased binding of STAT3 for some of the investigated targets, significantly increased co-binding of STAT3 and STAT6 to target GRRs was detected only in the presence of both, IL-4 and IL-6.We observed no significant increase in STAT6 or STAT3 binding upon dual stimulation as compared to single cytokine treatments.
Epigenetic landscape modulates transcription factor binding,41,42 and previous studies32,36 highlighted the role of histone acetylation in transcription factor recruitment to chromatin in cytokine-treated hMDMs. Therefore, we investigated changes of histone acetylation in the regulatory regions of co-induced genes after single and combined cytokine treatments. Analyzing levels of Lys9-acetylated histone H3 at STAT-binding sites of co-induced genes, we found increased H3 Lys9 acetylation upon co-treatment as compared to single treatments (Figure 4C).
To validate that the STAT3/6 binding sites indeed regulate target gene expression, we used CRISPR interference (CRISPRi).43,44 We prevented the binding of STAT3/STAT6 to their cognate sites at the CCL18 GRR by transfecting the cells with dCas9-KRAB (catalytically inactive Cas9 fused with KRAB repressor domain) and sgRNA plasmids targeting STAT3 and STAT6 binding sites (lying 500bp apart) individually. As seen in Figure 4D, in dCas9-KRAB and empty sgRNA vector (sg-RNA-MS2)-transfected cells IL-4 and IL-6 synergistically induced CCL18 expression. This effect was attenuated by blocking either the STAT6 or STAT3 binding sites individually. We further tested our hypothesis for STAT3/STAT6 binding sites in GRRs of CD274 and TGFA. However, blocking STAT3 and STAT6 co-binding sites for the respective genes individually did not result in reduction of synergized target gene expression in dual stimulation (data not shown). Therefore, we blocked the binding sites in combinations i.e. 2 STAT3/-6 binding sites for CD274 (9 and 0.1Kb downstream of TSS, Figure 4E left) and 3 STAT3/-6 binding sites for TGFA (29.3Kb, 37.5Kb and 74.5Kb downstream of TSS, Figure 4E right). Collectively, these data suggest that binding of STAT3 and STAT6 in proximity to each other is required to mediate the synergism of IL-4 and IL-6 in inducing CCL18, CD274 and TGFA mRNA expression.
BATF cooperates with STAT3 and STAT6 to synergistically induce a subset of IL-4 target genes
We questioned whether co-treatment with IL-4 and IL-6 also induced transcription factors that may cooperate with STAT3/STAT6 resulting in the increased expression of co-induced genes. Inspection of IL-4/IL-6 dual stimulation transcriptome revealed increased expression of basic leucine zipper ATF-like transcription factor (BATF) upon IL-4/IL-6 co-treatment as compared to single treatments (Suppl. Table S5). To explore the role of BATF in more detail, we time-dependently tracked the changes of BATF mRNA (Figure 5A) expression. BATF mRNA expression increased as early as 1h upon dual stimulation. Accordingly, we observed increased levels of BATF protein in nuclear fractions of IL-4/IL-6 co-treated within 1h (Figure 5B). We further investigated STAT3 and STAT6 binding to the BATF GRR using ChIP in cells stimulated with IL-4/IL-6 for 1h (Figure 5C). STAT3 and STAT6 binding sites were 1.2Kb downstream of the TSS and were only 5bp apart. We found no significant increase in STAT6 binding between IL-4 and IL-4/IL-6 stimulations. However, we found an increased STAT3 binding upon dual stimulation as compared to single cytokine treatments (Figure 5C). STAT3 silencing abrogated the increase of BATF expression after dual stimulation, indicating that STAT3 along with STAT6 regulates BATF expression (Figure 5D). To further investigate the impact of BATF on IL-4/IL-6-dependent gene expression we performed BATF silencing. Indeed, the mRNA expression of IL-4/IL-6 target genes (CCL18, CD274, TGFA, CCL8 and CCL23) was inhibited upon BATF knockdown (Figure 5E, Suppl. Figure 6A), indicating a possible role of BATF in cooperating with STAT3 and STAT6 to regulate co-induced target genes. Using BATF ChIP-seq data45,46 and JASPAR software we identified putative BATF binding sites in CCL18, TGFA and CD274 GRRs, 10, 29.5 and 37Kb downstream of respective TSS. Using ChIP, we further explored whether BATF binds to these elements. Figure 5F shows that BATF binding to target gene GRRs increased in IL-4/IL-6 co-treated cells as compared to cells treated with IL-4. We further analyzed the effects of histone acetylation at BATF binding sites (Figure 5G) and observed an increase of H3K9 acetylation upon dual stimulation, indicating increased chromatin accessibility at the BATF binding regions. We blocked BATF binding sites in CCL18 GRR using CRISPRi and detected decreased co-induction of CCL18 mRNA in cells transfected with sgRNA-BATF compared to cells transfected with empty sgRNA-vector, confirming that BATF binding functionally regulates STAT3 and STAT6 synergism (Figure 5H).
Figure 6.
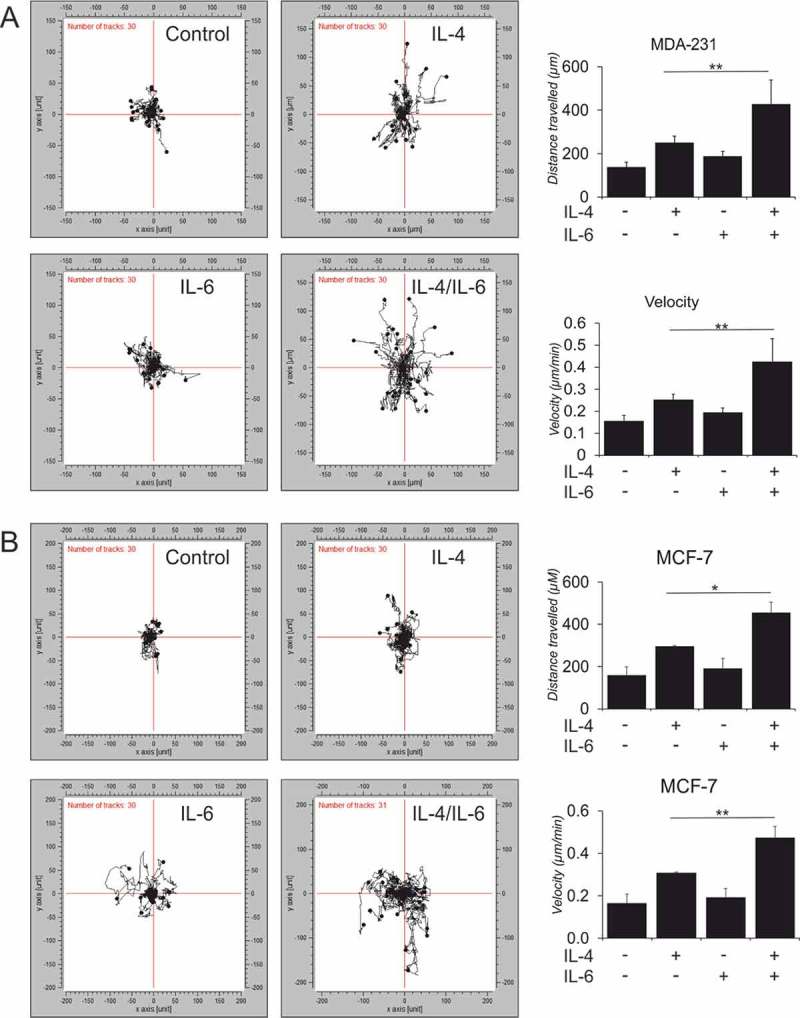
Activity assays investigating the downstream effects of IL-4/IL-6 dual stimulation..
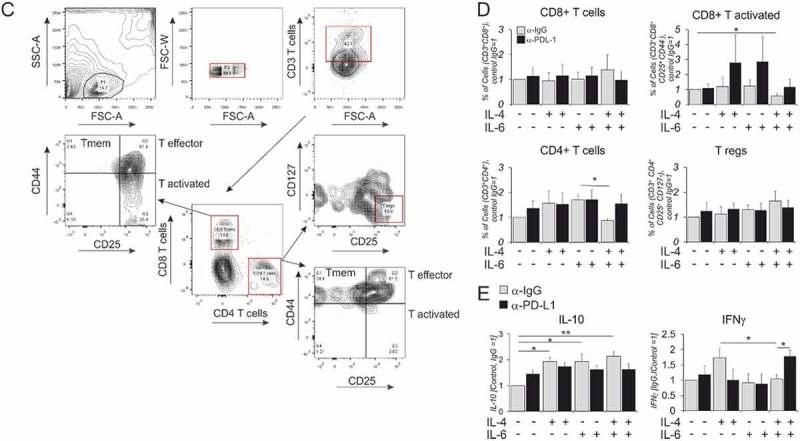
Representative tracks from 3D cell chemotaxis assays with (A) MDA-MB 231 and (B) MCF-7 cells incubated for 16h with conditioned media from polarized macrophages and quantified for accumulated distance travelled and velocity. (n ≥ 3, 90 cells) in total were tracked (C-E) hMDMs were stimulated with indicated cytokines for 48h followed by co-culture with autologous CD3/2/28 bead-activated T cells for the next 72h in the presence of isotype control IgG or anti-PD-L1 antibody. (n ≥ 6–9) (C) FACS panel indicating different T cell markers profiled after co-culture along with respective fluorescent minus one (FMO) controls. (D) Percentages of T cell subtypes after the co-culture. (E) IL-10 and IFNγ secretion measured by cytometric bead-based cytokine quantification for total CD3+T cells upon co-culture. One-way ANOVA pair wise analysis with Bonferroni multiple corrections was performed to calculate significance levels. Data are presented as mean± SD. *, p < 0.05, **, p < 0.01
Figure 5.
(Continued).
Functional analysis of IL-4/IL-6 co-treated macrophages
We explored functional implications of IL-4/IL-6 synergism for macrophage interactions with tumor and immune cells. As CCL18 was ascribed an important role in stimulating breast tumor cell migratory and pro-invasive phenotypes, we tested whether the secretome of cytokine-treated hMDMs promoted breast cancer cell migration. We tracked the migration of MCF-7 (ER+, PR+ Her2−, luminal-like invasive ductal carcinoma (IDC)) and aggressive MDA-MB 231 (ER−, PR− Her2−, basal like metastatic triple negative breast carcinoma (TNBC)) cells stimulated by conditioned medium from hMDMs treated with IL-4 and IL-6 alone or in combination in 3D chemotaxis assays using Cell Observer technology. The motility and migration of both MCF-7 (Figure 6A) and MDA-MB 231 cells (Figure 6B) increased upon stimulation with conditioned media from IL-4/IL-6-stimulated hMDMs as compared to cells incubated with conditioned media from single cytokine-treated cells. The extent of migratory response was highly similar in both MCF-7 and MDA-MB 231 cells treated with supernatants of stimulated hMDMs. Breast cancer cells treated with supernatants from dually stimulated hMDMs migrated twice the distance with a 2-fold higher velocity compared to cells exposed to supernatants of hMDMs stimulated with IL-4 alone. We found no difference in breast cancer cell proliferation for either MCF-7 or MDA-MB 231 cells after 72h of tracking (data not shown). We next investigated if viable cell conditioned media (VCM) from different mammary carcinoma cell lines (SKBR3, MCF-7 and MDA-MB 231) could induce a similar phenotype that we observe in hMDMs upon IL-4/IL-6 stimulations. Therefore, we incubated hMDMs for 24h with serum-free VCM generated from breast cancer cell lines. Surprisingly, we found that most of our target genes as well as CD206 and CD163 were induced only by VCM generated from MDA-MB 231 cells (Suppl. Figure 7A). Testing for levels of IL-4, IL-10, IL-13 or IL-6 in VCM we could detect only IL-6 released by MDA-MB 231 cells (Suppl. Figure 7B), suggesting that other factors released by the tumor cells may substitute for IL-4/IL-13.
Figure 7.
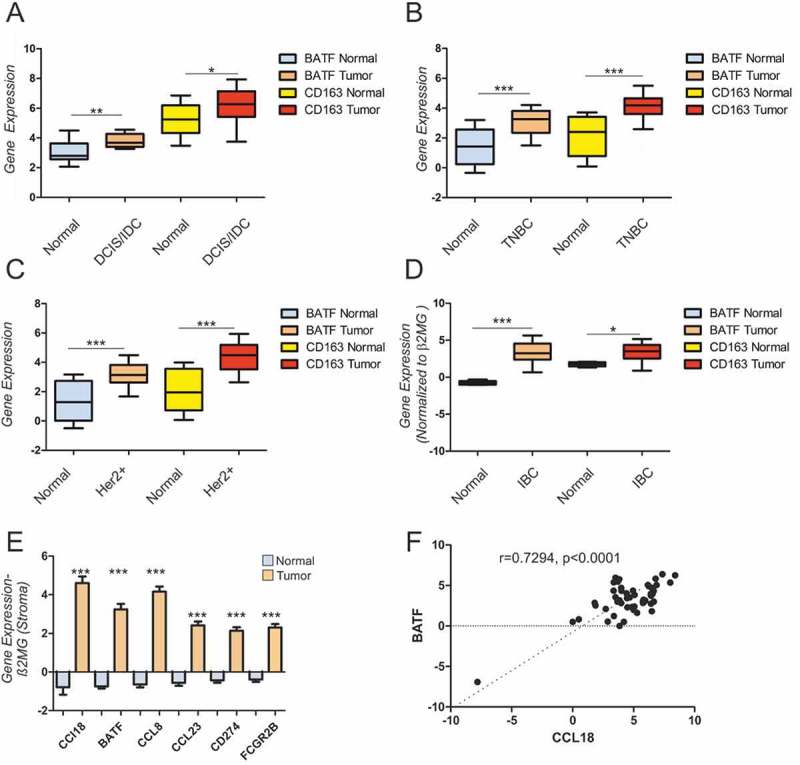
BATF expression in tumor stroma correlates with IL-4/IL-6 target genes..
Datasets from previously published studies by Ma et al. (A), Saleh et.al (B), Liu et.al (C), and Finak et al. (D-F) were analysed using GEO2R. (A-C) Box and whiskers plots with 10–90% error bars for BATF, macrophage marker (CD163) expression in normal tissue (A, n = 14; B, n = 12; C, n = 14; D, n = 6) versus tumor stroma (A, n = 18; B, n = 58; C, n = 39; D, n = 53) in breast carcinoma samples. (E) Gene expression for indicated genes in tumor versus normal stroma. Two tailed, 95% confidence, non-parametric t-test was used for statistical analysis (A-E) (F) Pearson correlation analysis for BATF and CCL18 expression in tumor stroma shows a positive correlation (R = .7294, p < .0001, n = 53). Data are presented as mean± 10–90% SEM. *, p < 0.05, **, p < 0.01. ***, p < 0.005.
Next, we validated the functionality of CD274 upregulation by performing a T cell activation assay with CD3/CD2/CD28 bead-activated T cells co-cultured for 3d in the presence of an isotype control (IgG) or an anti-CD274/PD-L1 antibody (Atezolizumab) with autologous hMDMs polarized with IL-4 and IL-6 individually or in combination for 48h prior to co-culture. A representative FACS panel (Figure 6C) shows the gating scheme for analyzing T cell subsets distinguishing following subtypes: total T cells (CD3+), CD3+CD4+ T helper cells, CD3+CD8+ cytotoxic T cells, CD3+CD4+CD25+CD127− regulatory T cells (Treg). We also quantified CD3+CD44+ CD25− memory T cells (Tmem),47 CD3+CD25+CD44+ effector T cells (Teff), CD25+CD44− activated T cells (Tact.) for both CD4+ and CD8+ T cell subtypes.
Figure 6.
(Continued).
We found no major changes in relative cell abundance between the different treatment groups. There was a minor inhibition of percentages of CD8+ Tact cells upon co-culture with IL-4/IL-6 stimulated hMDMs in the presence of isotype control antibody (Figure 6D, upper panel). We also found 50% inhibition of total CD4 + T cells after co-culture with dually stimulated hMDMs as compared with hMDMs exposed to single IL-6 treatment (Figure 6D, lower panel). The decreased percentages of CD8+ Tact cells and CD4+ T cells were partially rescued in the presence of anti-PD-L1 antibody. We observed a 1.5-fold yet non-significant increase in the percentage of Treg after co-culture with dually stimulated vs. unstimulated hMDMs. We detected no significant changes in the percentages of CD4+ or CD8+ Teff or Tmem cells or surface expression (Suppl. Fig. 8E-G). We also analyzed the expression of inhibitory T cell markers TIM3, LAG3, PD1 or CTLA4 either for CD4+ or CD8+ T cells, which showed no discernable changes after co-culture (Suppl. Fig. 8A). However, TIM3, CTLA-4 and PD-1 expression on CD4+T cells co-cultured with IL-4 polarized hMDMs increased in the presence of PD-L1 blocking antibody. This may occur as a compensatory mechanism to maintain increased expression of inhibitory receptors on CD4+T cell surface.
Although only minor changes in T cell surface marker expression were noticed, we observed altered cytokine production by T cells in co-cultures. Increased IL-10 levels, which may be produced by regulatory T cells, were detected upon treating macrophages with any of the cytokine combinations. However, this effect was PD-L1 independent (Figure 6E, left panel). While levels of the TH2 cytokine IL-4 and the TH17 cytokine IL-17 were unaltered (data not shown), increased levels of IFNγ were observed after co-culture with IL-4 polarized hMDMs, an effect that was inhibited in dually stimulated hMDMs (Figure 6E, right panel). This observation could be explained by decreased numbers of CD8+ Tact cells or CD4+ T cells, which might be TH1 polarized, in co-cultures with dually stimulated macrophages. Importantly, we confirmed the role of increased CD274 in immunosuppression by dually stimulated hMDMs, since IFNγ levels in this group were markedly increased upon anti-PD-L1 treatment. The observed and unexpected increase in IFNγ expression after co-culture with IL-4 polarized hMDMs could be explained by increased expression of macrophage co-stimulatory receptors CD40, CD80 and CD86 (Suppl. Table S2, Suppl. Fig. 8B-D)
Our experiments functionally validated that hMDMs co-treated with IL-4 and IL-6 released factors enhanced breast tumor cell motility. Furthermore, dual stimulated hMDMs augmented immunosuppressive molecules (PD-L1) inhibiting CD8+ T cell activation, as well as total CD4+ T cell percentages and likely IFNγ production. Through these mechanisms, hMDMs stimulated with IL-4 and IL-6 in combination potentially act in a pro-tumorigenic manner.
BATF expression is elevated in primary breast tumor stroma
We investigated the relevance of our findings for human breast cancer by analyzing mRNA expression levels of BATF along with macrophage marker CD16348 in breast tumor stroma using GEO2R analysis. Exploring publicly available breast cancer datasets for tumor stroma BATF expression, we found significantly increased BATF expression in tumor stroma compared to normal tissue stroma in ductal carcinoma in situ/invasive ductal carcinoma (DCIS/IDC),49(Figure 7A, triple negative breast carcinoma (TNBC),50(Figure 7B, HER2+ breast carcinoma,51(Figure 7C, and invasive breast carcinoma (Figure 7D),52 The relative expression of TAM’s genes (CD163) were also upregulated in tumor versus normal stroma. BATF expression was induced along with other IL−4/IL−6 target genes (CCL18, CCL8, CCL23, CD274, FCGR2B) in breast tumor versus normal tissue stroma (Figure 7E. Analysis of sample-matched expression of BATF and CCL18 in tumor stroma revealed significant positive correlation (Figure7E). These data indicate that cells in tumor stroma, such as macrophages, express high levels of BATF that can potentially contribute to tumor progression.
Discussion
TAMs are subjected to a variety of cytokines promoting their tumor-supportive phenotype. Here we carried out mechanistic and functional analyses to elucidate how two cytokines of the tumor microenvironment, IL−4 and IL−6, cooperate in altering the transcriptome of hMDMs. Comparing our data with a previously published analysis of IL−4/IL−6 co-treated transcriptome of murine macrophages31 revealed an explicit non-redundancy in synergistic responses upon dual stimulation in human versus mouse systems. Thus, whereas synergistic effects of IL-6 and IL-4 on gene expression in murine BMDMs were suggested to depend on the activation of the unfolded protein response (UPR)-mediating enzyme IRE-1α,31 we found no evidence involving UPR and its IRE-1α branch in the hMDM transcriptome response to IL-4/IL-6 dual stimulation. In contrast to mouse data, dual stimulation elicited no change of mRNA or protein expression for the majority of cathepsins in hMDMs. In fact, only 2 genes were synergistically induced both in murine and human data sets. However, similar classes of genes were induced, e.g. chemokines or C-type lectins. These discrepancies are reminiscent of previously acknowledged differences between human and murine macrophages regarding IL-4 stimulation.53,54
We explored the mechanism of IL-6 mediated synergism and found neither increased differences in STAT3 or STAT6 nuclear translocation nor IL-4 receptor expression as suggested earlier.23 STAT3 silencing confirmed its central role in the synergistic effects of dual stimulation. Speculating that STAT6/STAT3 co-binding in the GRRs of target genes upon dual stimulation drives increased gene expression,23 we found and validated closely spaced (500bp for CCL18 and 2–10 bp apart for CD274 and TGFA) STAT6/STAT3 binding sites in GRRs of synergistically induced genes. Furthermore, increased H3K9 acetylation in these GRRs was detected upon dual stimulation, indicating enhanced chromatin accessibility for transcription factor binding.55,56 Using CRISPRi, we validated functionality of STAT3/STAT6 binding sites for CCL18, CD274 and TGFA co-induction wherein the dCas9 fused KRAB repressor domain blocks the binding of TF in 20bp regions. Individual or combined blocking of STAT6 binding sites in CCL18 GRR alleviates synergistic induction of CCL18 in IL-4/IL-6 polarized hMDMs. For CD274 and TGFA, were the STAT3 and STAT6 binding sites were only 2-10 bp apart, we used a common sg-RNA for different co-binding sites. Unlike CCL18, blocking STAT3/STAT6 binding sites in GRR of CD274 and TGFA individually did not inhibit the synergistic gene induction, necessitating blocking 2 STAT3 and STAT6 co-binding sites for CD274 and 3 co-binding sites for TGFA in combination to observe reduced synergistic induction. This could be explained by multiple STAT3/STAT6 binding sites mediating induction of CD274/TGFA and compensation by other STAT6/STAT3 sites upon individual TF blocking.
We further investigated whether STAT6/STAT3 co-binding induced transcription factors cooperated in transmitting synergistic effects of IL-4/IL-6 co-treatment and identified BATF as one such factor. BATF is a pivotal transcription factor shown to control IL-4 production by T follicular helper cells,57 to function as an early CD8+ T cells differentiation checkpoint58 or to regulate IL-23-driven colitis by acting on Th17 cells.59 However, the function and roles of BATF are largely unexplored in myeloid settings. Synergistic induction of BATF was STAT3-dependent as confirmed by STAT3 knockdown and STAT3/STAT6 binding to the BATF GRR as revealed by ChIP experiments. Silencing BATF repressed synergistically induced IL-4/IL-6 target genes in correspondence to STAT3 knockdown. Furthermore, these genes harbored BATF binding sites showing increased BATF occupancy and H3K9 acetylation upon dual stimulation. Using CRISPRi to block BATF binding in the CCL18 GRR we found decreased CCL18 induction, further supporting BATF involvement in target gene regulation. Therefore, we suggest that STAT3 and STAT6 binding induces BATF, which binds the GRR along with STAT3/STAT6 of IL-4/IL-6 co-induced genes and thus cooperates in their synergistic upregulation.
To functionally characterize the role of differentially regulated genes, we performed a series of activity assays, observing increased motility of MCF-7 and MDA-MB 231 cells incubated with conditioned media from IL-4/IL-6-treated hMDMs. This increase could be due to the enhanced chemokine release by co-treated hMDMs. One such potential chemokine could be CCL18 as it was previously described to bind the PITPNM3 receptor and induce motility in MDA-MB 231 cells.15
We further noticed that hMDMs upon dual stimulation inhibit CD8+T cell activation as evidenced by reduced IFNγ secretion and reduced percentages of CD8+ activated T cells from autologous CD3/2/28 bead-activated T cell in co-culture assays. We found this effect to be PD-L1 dependent as using PD-L1 blocking antibody rescued the above phenotypes. Of interest was increased IFNγ release upon co-culture of T cells with IL-4 polarized hMDMs. We speculate that the increased surface expression of immune co-stimulatory receptors (CD40, CD80 and CD86) and modest induction of PD-L1 in IL-4- polarized hMDMs shifts the macrophage phenotype towards immune/T cell activation. This effect is reversed after dual cytokine treatments through synergistic induction of PD-L1, whose immunosuppressive effects override the co-stimulatory hMDM cell surface phenotype, leading to reduced IFNγ secretion by CD8+ Tact cells and TH1 cells. We also note that although IL-4-treated hMDMs show increased mRNA expression of CD40 and CD86 as compared to untreated cells, direct comparison showed reduced mRNA levels of these markers in IL-4 vs lipopolysaccharide plus IFNγ polarized human macrophages (GSE5099).60
Analysis of GEO datasets revealed elevated expression of BATF together with CD163 macrophage marker in breast tumor versus normal stroma, which positively correlated with CCL18 and several other IL-4/IL-6 target genes. While this may suggest that BATF levels increase because of enhanced macrophage infiltrates, other immune cells express BATF as well, and as our study indicates BATF levels may increase in macrophage upon activation. Nevertheless, these data suggest that macrophages expressing BATF may be of clinical relevance in the progression of breast cancer.
In summary, our study provides evidence for a pro-tumorigenic polarization of hMDMs by IL-4/IL-6. Our data support the central role of STAT3 as a transcription factor driving IL-6-elicited alterations of the macrophage transcriptome and reveal a novel role of BATF transcription factor in shaping the transcriptional response of IL-4/IL-6 stimulated macrophages, suggesting its potential importance as a target to suppress pro-tumorigenic properties of TAMs.
Materials and methods
Cell culture and stimulations
Peripheral blood mononuclear cells (PBMCs) were isolated from buffy coats supplied by DRK-Blutspendedienst Baden-Württemberg-Hessen (Frankfurt, Germany) using Ficoll density centrifugation. PBMCs were cultured for 1-2h in serum-free RPMI-1640 medium (Life technologies), differentiated for 7-8d in RPMI-1640 medium containing 3% heat-inactivated AB-positive human serum. Differentiated macrophages were stimulated for 24h with 20ng/ml of IL-4 and/or IL-6 (Immunotools).
Studies conform to the principles outlined in the Declaration of Helsinki and were approved by the ethics committee of the faculty of medicine at Goethe-University Frankfurt. The ethics committee waived the necessity of written informed consent when using the buffy coats from anonymized blood donors.
Real time PCR
Total RNA from macrophages was isolated using PeqGold RNAPure kit (PeqLab) and reverse transcribed using cDNA Synthesis kit (Fermentas). Quantitative real time PCR was performed using CFX96 system from Bio-Rad and iQ SYBR green Supermix (Bio-Rad). Primer sequences are available upon request. Expression was normalized to β2-microglobulin.
Chromatin immunoprecipitation
Differentiated macrophages were fixed in 1% paraformaldehyde, quenched with 0.125M glycine and washed in PBS. Cells were lysed in buffer I (20mM Tris-HCl pH 8.0, 85mM KCl, 0.5% NP-40) to release cytosolic proteins and debris and the nuclear pellet was lysed in 200µl nuclei lysis buffer (50mM Tris-HCl pH 8.0, 10mM EDTA, 1% SDS) and sonified with Branson Sonifier. Soluble chromatin was diluted with dilution buffer (0.01% SDS, 1.1% Triton X 100, 1.1mM EDTA, 20mM Tris-HCl pH 8.0, 167mM NaCl). The lysate was pre-cleared with sepharose CL-4B beads for 1h and 1% of input was stored at 4°C. The rest of soluble chromatin was pulled down overnight at 4°C using following primary antibodies: STAT6 (M-20, sc-981), STAT3 (C-20, sc-482) (both Santa-Cruz), BATF (m14-108, CDI/Neobiotechnologies), IgG (abcam, ab2410). Protein A/G beads were used to precipitate antibody-protein complexes for 2h at 4°C. The beads were washed once with low salt buffer (0.1% SDS, 1% Triton-X100, 2mM EDTA, 20mM Tris-HCl pH 7.4, 150mM NaCl), once with high salt buffer (0.1% SDS, 1% Triton-X100, 2mM EDTA, 20mM Tris-HCl pH 7.4, 500mM NaCl) and twice with LiCl buffer (250mM LiCl, 10mM Tris-HCl, pH7.4, 1% NP-40, 1% sodium deoxycholate, 1mM EDTA) at 4°C and twice with TE-buffer at room temperature. The beads were then eluted in 200µl of elution buffer (100mM NaHCO3, 1% SDS) at 55°C. The eluate was reverse crosslinked with RNAse and proteinase K at 65°C for 4h. The decrosslinked DNA was then purified using Qiagen Ampure purification kit and eluted in 80µl of elution buffer. The BATF ChIP was performed according to the company’s protocol using BATF-antibody coupled to Dynabeads and magnetic isolation (available upon request).
Western blot analysis
Protein lysates from macrophages were run on 7.5–15% polyacrylamide gels and blotted on nitrocellulose membranes using Biorad Transblot Turbo transfer system. Following incubations with primary antibodies (p-STAT6 (#9361), STAT6 (#5397), p-STAT3 (#9131), STAT3 (#9139) (all Cell Signaling Technology), Nucleolin (sc-13057, Santa-Cruz), BATF (WW8, Santa-Cruz)), membranes were incubated with IRDye 700/800-coupled secondary antibodies, scanned and quantified using Odyssey imaging system (Licor).
Elisa
2x10⁶ primary human macrophages were stimulated with cytokines for 48h in 1ml serum free medium, which was processed for TGFA or CCL18 ELISA using kits from RayBiotech (ELH-TGFα-1 and ELH-PARC-1) according to manufacturer’s instructions.
NGS library preparation and RNA sequencing analysis
RNA from differentiated and cytokine-treated macrophages from three different donors was extracted using Macherey-Nagel NucleoSpin RNA extraction kit (#740955.250), followed by quantification with Qubit HS RNA Assay Kit (#Q32852). 4µg of RNA was used for library preparation and mRNA was extracted using polyA pulldown and converted to cDNA using TruSeq Stranded mRNA LT – SetB library preparation kit (Illumina #RS-122–2102). cDNA library was quantified with Qubit dsDNA HS Assay Kit (#Q32854) and prepared for single paired sequencing on NextSeq 500/550 High Output Kit v2 (75 cycles, Illumina # FC-404–2005).
Summary statistics of the individual RNA sequence data sets were generated with FastQC61 analysis that showed a Quality score of > 93%. Quality trimming of the sequence reads was performed using the Trimmomatic module62 from Trinity63 with the following parameter settings: ILLUMINACLIP:/~ Trimmomatic-0.32/adapters/TruSeq3-SE.fa:2:30:10 LEADING:5 TRAILING:5 SLIDING WINDOW:4:15. Quality trimmed reads were mapped to the human genome hg19 with the STAR aligner64 using the following parameters: – outFilterMultimapNmax 1 – outSAMtype BAM SortedByCoordinate. More than 91>% of reads were uniquely mapped using hg19 as a reference genome. The mapping results were summarized with FeatureCounts,65 and Principal Component Analysis (PCA) of the feature counts was done with the prcomp module in R. Differential Gene Expression (DGE) analysis was performed in R using DESeq2 package.66 For downstream bioinformatics characterization, we selected differentially expressed genes with an │log2 fold change (log2FC) │ ≥ 1 and a p-value ≤ 0.05 for all four test conditions in Figure 1B and plotted the heatmap from log2-normalized read counts. Venn diagrams and heat maps were generated in R using the venn.plot and ggplot2 modules, respectively. For every stimulation condition (IL-4, IL-6 and Il-4/IL-6), we identified antagonistic and synergistic genes according to the procedure described in.36 Precisely, we identified a gene as antagonistic if the ratios of changes met the following conditions: (IL-4 or IL-6)/Ctr. > 2 and (IL4-/-6)/Ctr. < 1.5, where Ctr. denotes untreated control macrophages. Likewise, genes were identified as synergistic, if [(IL-4+ IL-6)/Ctr.]/[(IL-4/Ctr.)+(IL-6/Ctr.)] > 1.2. The individual cutoff values were modified from.36
To assess the impact of differential expression levels on treatment with cytokines, we calculated the fold changes between differentially expressed genes of two stated conditions in biological replicates (i.e. matched observations from each donor). Fold changes were either calculated in IL-4, IL-6 or IL-4/-6 versus the control (untreated) condition or between individual (IL-4/-6 versus IL-4) stimulations for each biological replicate (A, B, C). For instance, Gene X will have three changed expression values (CE) in sample A (X_CEIL-4A), sample B (X_CEIL-4B) and sample C (X_CEIL-4C) for IL-4 stimulation. Next, we calculated the standard deviation between the fold changes in X_CEIL-4A, X_CEIL-4B and X_CEIL-4C versus control (X_CEcontrolA, X_CEcontrolB, X_CEcontrolC) or between two stimulation conditions for all differentially expressed genes in these two conditions using SD function in R. A density plot of all standard deviation values was plotted using ggplot2 function in R.
Data analysis
Microarray data from Yan et.al 31 linear coefficient models for mouse BMDMs for synergized genes were compared to synergized genes in hMDMs (Suppl. Table S6). Data sets GSE14548,49GSE90505,50 GSE8359151 and GSE901452 were analysed using GEO2R web tool (NCBI) and GraphPad Prism v5.03.
Transfection
hMDMs were transfected for RNA silencing experiments using HiPerFect transfection reagent (Qiagen) and siGenome STAT3 or BATF siRNA pools (Dharmacon) for 72h (STAT3) or 24h (BATF) before stimulation with indicated cytokines for further 24h.
For CRISPRi, hMDMs were transfected using Viromer Red transfection reagent (Lipocalyx). HMDMs were incubated in serum-free medium overnight and transfected with sgRNAs targeting STAT3/STAT6 or BATF binding sites cloned into sgRNA-MS2 vector (Addgene #61424)42 and pHAGE EF1α dCas9-KRAB plasmid coding dead-Cas9 vector fused with KRAB suppressor domains (Addgene #50919)43 for 24h followed by stimulation with cytokines for further 24h.
Flow cytometry analysis
Cells were centrifuged for 5min at 500g at 4°C, and the supernatant was discarded. Cells were re-suspended in 80µl PBS/BSA (0.5%) with 2µl of Fc Block (BD Biosciences). Cells were incubated on ice for 15-20min with 1-2µl of antibodies. Cells were centrifuged and re-suspended in 300µl of FACS flow buffer before analysis on a LSRII/Fortessa flow cytometer (BD Biosciences). BV650 anti-human CD16 (#563692), PE anti-human-CD32 (#303205), BV605 anti-human CD64 (#305033), and APC anti-human PD-L1 (#329707) were purchased from BD Biosciences. For T cell FACS analysis after co-culture with polarized hMDMs BD Biosciences BV605-labelled mouse anti-human CD3 antibody (#563219), BV650-labelled mouse anti-human CD4 antibody (#563737), PerCP-Cy-5.5 labelled mouse anti-human CD127 (#560551), APC-H7-labelled mouse anti-human CD8 antibody (#641400), Biolegend’s Alexa Fluor® 700-labelled mouse anti-human CD44 (#103025), Brilliant Violet 421™ labelled mouse anti-human CD279 (PD-1, #329919), PE labelled mouse anti-human CD152 (CTLA-4, #369603), APC labelled mouse anti-human CD366 (Tim-3) (#345011), Alexa Fluor® 488 labelled mouse anti-human CD223 (LAG-3, #369325) and PE-Cy7 labelled mouse anti-human CD25 (BD Pharmigen, #557741) were used. Cytometric Bead Arrray (CBA) analysis was performed to measure IL-10 (#558274), IFNγ (#560379), IL-4 (#558272), IL-6 (#558276) and IL-13 (#558450, all BD Biosciences) levels in tumor cell supernatants or T cell supernatants after co-culture.
T cell activation assay
T cells from human buffy coats were isolated using Pan CD3-Tcell extraction kit (Miltenyi Biotec). CD3+ T cells were expanded using 5µl/106 T cells of ImmunoCult Human CD3/CD28/CD2 T cell activator (STEMCELL Technologies), 100ng/ml human IL-2 and 50µM β-mercaptoethanol, and cultured in RPMI with 5% heat inactivated FCS, 500mM sodium pyruvate, and 500mM non-essential amino acids (T cell media). HMDMs from identical buffy coats were differentiated with human plasma for 7d in a 24-well plate. On day 7, hMDMs were stimulated for 48h with IL-4 or/and IL-6. On day 8 T cells were reactivated as described earlier. On day 9 hMDMs were washed and T cells were cocultured (1:5) for the next 3d in T cell media. On day 12, T cells were extracted and centrifuged for FACS analysis. The supernatants were used to analyze cytokine secretion for IL-10 and IFN-γ using CBA and T cells were stained for different surface markers as described above.
Tumor cell supernatant from breast cancer cell lines
Viable conditioned media was generated from 106 SKBR3, MCF-7 or MDA-MB 231 cells after seeding in T-175 flasks overnight. The media was changed to 20ml serum free media followed by culture for next 24h. 25µl of media was used to quantify IL-4, IL-6, IL-10 and IL-13 by CBA. 1ml of media was incubated with hMDMs for 24h followed by mRNA analysis.
3D chemotaxis assay
We collected serum-free conditioned media from hMDMs 48h post-treatment with different cytokines. 20000 MCF-7 or MDA-MB 231 cells were seeded onto collagen-coated µ-slide chemotaxis slides (ibidi, #80326). The cells were then incubated and tracked via Cell Observer (Zeiss) at 37°C with 5% CO2 for 16h with images taken every 10min. A total of 90 cells were tracked per condition (30 cells, n = 3) and quantified via manual tracking protocol in Image J.
Primers and sgrnas
A complete list of primers and sgRNA sequence is summarized in Suppl. Table S7.
Statistical analysis
Statistical analysis was performed using GraphPad Prism v5.03. One-way ANOVA analysis with Bonferroni post hoc test were applied for multiple group comparisons with significance levels indicated in figure graphs (*, p < 0.05, **, p < 0.01, ***, p < 0.005). Results are presented as means± SD for at least three independent biological replicates.
Funding Statement
This work was supported by the Deutsche Forschungsgemeinschaft (DFG) [NA 429/2-2];
Acknowledgments
This study was supported by grants from Deutsche Forschungsgemeinschaft [NA429/2-2].
Disclosure statement
The authors report no conflict of interest.
Author Contributions
Sahil Gupta performed all experiments and wrote the paper under the supervision of Dmitry Namgaladze who conceived and designed the experiments and edited the manuscript. Arpit Jain performed all the bioinformatic analyses under the supervision of Ingo Ebersberger. Bernhard Brüne, Shahzad Nawaz Syed and Ryan G. Snodgrass guided experimental designs. Andreas Weigert provided expertise in flow cytometric and T cell activation assays. Matthias S. Leisegang and Ralf P. Brandes provided the CRISPRi plasmids and sgRNA designs while Beatrice Pflüger- Müller assisted in ChIP assays. All authors read the manuscript and agreed with its manuscript publication.
References
- 1.Elpek KG, Cremasco V, Shen H, Harvey CJ, Wucherpfennig KW, Goldstein DR, Monach PA, Turley SJ The tumor microenvironment shapes lineage, transcriptional, and functional diversity of infiltrating myeloid cells. Cancer Immunology Research. 2014; 2: 655–667. doi: 10.1158/2326-6066.CIR-13-0209. [DOI] [PMC free article] [PubMed] [Google Scholar]
- 2.Qian B, Pollard JW.. Macrophage Diversity Enhances Tumor Progression and Metastasis. Cell. 2010; 141: 39–51. doi: 10.1016/j.cell.2010.03.014. [DOI] [PMC free article] [PubMed] [Google Scholar]
- 3.Kitamura T, Qian B-Z, Pollard JW. Immune cell promotion of metastasis. Nature Reviews Immunology. 2015; 15: 73–86. doi: 10.1038/nri3789. [DOI] [PMC free article] [PubMed] [Google Scholar]
- 4.Ugel S, De Sanctis F, Mandruzzato S, Bronte V. Tumor-induced myeloid deviation: when myeloid-derived suppressor cells meet tumor-associated macrophages. The Journal of Clinical Investigation. 2015; 125: 3365–3376. doi: 10.1172/JCI80006. [DOI] [PMC free article] [PubMed] [Google Scholar]
- 5.Condamine T, Ramachandran I, Youn J-I, Gabrilovich DI. Regulation of Tumor Metastasis by Myeloid-Derived Suppressor Cells. Annual Review of Medicine. 2015; 66: 97–110. doi: 10.1146/annurev-med-051013-052304. [DOI] [PMC free article] [PubMed] [Google Scholar]
- 6.Marvel D, Gabrilovich DI. Myeloid-derived suppressor cells in the tumor microenvironment: expect the unexpected. The Journal of Clinical Investigation. 2015; 125: 3356–3364. doi: 10.1172/JCI80005. [DOI] [PMC free article] [PubMed] [Google Scholar]
- 7.Garcia-Diaz A, Shin DS, Moreno BH, Saco J, Escuin-Ordinas H, Rodriguez GA, Zaretsky JM, Sun L, Hugo W, Wang X, et al. Interferon Receptor Signaling Pathways Regulating PD-L1 and PD-L2 Expression. Cell Reports. 2017; 19: 1189–1201. doi: 10.1016/j.celrep.2017.04.031. [DOI] [PMC free article] [PubMed] [Google Scholar]
- 8.Abiko K, Matsumura N, Hamanishi J, Horikawa N, Murakami R, Yamaguchi K, Yoshioka Y, Baba T, Konishi I, Mandai M IFN-γ from lymphocytes induces PD-L1 expression and promotes progression of ovarian cancer. British Journal Of Cancer. 2015; 112: 1501–1509. doi: 10.1038/bjc.2015.101. [DOI] [PMC free article] [PubMed] [Google Scholar]
- 9.Mandai M, Hamanishi J, Abiko K, Matsumura N, Baba T, Konishi I. Dual Faces of IFNγ in Cancer Progression: A Role of PD-L1 Induction in the Determination of Pro- and Antitumor Immunity. Clinical Cancer Research. 2016; 22: 2329–2334. doi: 10.1158/1078-0432.CCR-16-0224. [DOI] [PubMed] [Google Scholar]
- 10.Caldwell C, Johnson CE, Balaji VN, Balaji GA, Hammer RD, Kannan R. Identification and Validation of a PD-L1 Binding Peptide for Determination of PDL1 Expression in Tumors. Scientific Reports. 2017; 7: 13682. doi: 10.1038/s41598-017-10946-2. [DOI] [PMC free article] [PubMed] [Google Scholar]
- 11.Elsegood CL, Jee T-P, Olynyk JK, Yeoh GCT. Immune checkpoint inhibition: prospects for prevention and therapy of hepatocellular carcinoma. Clin Trans Immunol. 2017; 6: e161. doi: 10.1038/cti.2017.47. [DOI] [PMC free article] [PubMed] [Google Scholar]
- 12.Saha D, Martuza RL, Rabkin SD. Macrophage Polarization Contributes to Glioblastoma Eradication by Combination Immunovirotherapy and Immune Checkpoint Blockade. Cancer Cell. 2017; 32: 253–267. e5 doi: 10.1016/j.ccell.2017.07.006. [DOI] [PMC free article] [PubMed] [Google Scholar]
- 13.Zhu H, Bengsch F, Svoronos N, Rutkowski MR, Bitler BG, Allegrezza MJ, Yokoyama Y, Kossenkov AV, Bradner JE, Conejo-Garcia JR, et al. BET Bromodomain Inhibition Promotes Anti-tumor Immunity by Suppressing PD-L1 Expression. Cell Reports. 2016; 16: 2829–2837. doi: 10.1016/j.celrep.2016.08.032. [DOI] [PMC free article] [PubMed] [Google Scholar]
- 14.Petricevic B, Laengle J, Singer J, Sachet M, Fazekas J, Steger G, Bartsch R, Jensen-Jarolim E, Bergmann M Trastuzumab mediates antibody-dependent cell-mediated cytotoxicity and phagocytosis to the same extent in both adjuvant and metastatic HER2/neu breast cancer patients. Journal of Translational Medicine. 2013; 11: 307. doi: 10.1186/1479-5876-11-307. [DOI] [PMC free article] [PubMed] [Google Scholar]
- 15.Chen J, Yao Y, Gong C, Yu F, Su S, Chen J, Liu B, Deng H, Wang F, Lin L, et al. CCL18 from tumor-associated macrophages promotes breast cancer metastasis via PITPNM3. Cancer Cell. 2011; 19: 541–555. doi: 10.1016/j.ccr.2011.02.006. [DOI] [PMC free article] [PubMed] [Google Scholar]
- 16.Nagarsheth N, Wicha MS, Zou W. Chemokines in the cancer microenvironment and their relevance in cancer immunotherapy. Nature Reviews Immunology. 2017; 17: 559–572. doi: 10.1038/nri.2017.49. [DOI] [PMC free article] [PubMed] [Google Scholar]
- 17.Su S, Liu Q, Chen J, Chen J, Chen F, He C, Huang D, Wu W, Lin L, Huang W, et al. A positive feedback loop between mesenchymal-like cancer cells and macrophages is essential to breast cancer metastasis. Cancer Cell. 2014; 25: 605–620. doi: 10.1016/j.ccr.2014.03.021. [DOI] [PubMed] [Google Scholar]
- 18.Mauer J, Denson JL, Brüning JC. Versatile functions for IL-6 in metabolism and cancer. Trends in Immunology. 2015; 36: 92–101. doi: 10.1016/j.it.2014.12.008. [DOI] [PubMed] [Google Scholar]
- 19.Matthes T, Manfroi B, Zeller A, Dunand-Sauthier I, Bogen B, Huard B. Autocrine amplification of immature myeloid cells by IL-6 in multiple myeloma-infiltrated bone marrow. Leukemia. 2015; 29: 1882–1890. doi: 10.1038/leu.2015.145. [DOI] [PubMed] [Google Scholar]
- 20.Rosean TR, Tompkins VS, Olivier AK, Sompallae R, Norian LA, Morse HC 3rd, Waldschmidt TJ, Janz S The tumor microenvironment is the main source of IL-6 for plasma cell tumor development in mice. Leukemia. 2015; 29: 233–237. doi: 10.1038/leu.2014.260. [DOI] [PMC free article] [PubMed] [Google Scholar]
- 21.Rattigan YI, Patel BB, Ackerstaff E, Sukenick G, Koutcher JA, Glod JW, Banerjee D Lactate is a mediator of metabolic cooperation between stromal carcinoma associated fibroblasts and glycolytic tumor cells in the tumor microenvironment. Experimental Cell Research. 2012; 318: 326–335. doi: 10.1016/j.yexcr.2011.11.014. [DOI] [PMC free article] [PubMed] [Google Scholar]
- 22.Li J, Lan T, Zhang C, Zeng C, Hou J, Yang Z, Zhang M, Liu J, Liu B Reciprocal activation between IL-6/STAT3 and NOX4/Akt signalings promotes proliferation and survival of non-small cell lung cancer cells. Oncotarget. 2015; 6: 1031–1048. doi: 10.18632/oncotarget.2671. [DOI] [PMC free article] [PubMed] [Google Scholar]
- 23.Mauer J, Chaurasia B, Goldau J, Vogt MC, Ruud J, Nguyen KD, Theurich S, Hausen AC, Schmitz J, Brönneke HS, et al. Signaling by IL-6 promotes alternative activation of macrophages to limit endotoxemia and obesity-associated resistance to insulin. Nature Immunology. 2014; 15: 423–430. doi: 10.1038/ni.2865. [DOI] [PMC free article] [PubMed] [Google Scholar]
- 24.Yu H, Pardoll D, Jove R. STATs in cancer inflammation and immunity: a leading role for STAT3. Nature Reviews Cancer. 2009; 9: 798–809. doi: 10.1038/nrc2734. [DOI] [PMC free article] [PubMed] [Google Scholar]
- 25.Gaggianesi M, Turdo A, Chinnici A, Lipari E, Apuzzo T, Benfante A, Sperduti I, Di Franco S, Meraviglia S, Lo Presti E, et al. IL4 Primes the Dynamics of Breast Cancer Progression via DUSP4 Inhibition. Cancer Research. 2017; 77: 3268–3279. doi: 10.1158/0008-5472.CAN-16-3126. [DOI] [PubMed] [Google Scholar]
- 26.Hu J, Jo M, Eastman BM, Gilder AS, Bui JD, Gonias SL. uPAR Induces Expression of Transforming Growth Factor β and Interleukin-4 in Cancer Cells to Promote Tumor-Permissive Conditioning of Macrophages. The American Journal of Pathology. 2014; 184: 3384–3393. doi: 10.1016/j.ajpath.2014.08.003. [DOI] [PMC free article] [PubMed] [Google Scholar]
- 27.De Palma M. Partners in crime: VEGF and IL-4 conscript tumour-promoting macrophages. The Journal of Pathology. 2012; 227: 4–7. doi: 10.1002/path.4008. [DOI] [PubMed] [Google Scholar]
- 28.Chen J, Yao Y, Gong C, Yu F, Su S, Chen J, Liu B, Deng H, Wang F, Lin L, et al. CCL18 from Tumor-Associated Macrophages Promotes Breast Cancer Metastasis via PITPNM3. Cancer Cell. 2011; 19: 541–555. doi: 10.1016/j.ccr.2011.02.006. [DOI] [PMC free article] [PubMed] [Google Scholar]
- 29.Gocheva V, Wang HW, Gadea BB, Shree T, Hunter KE, Garfall AL, Berman T, Joyce JA IL-4 induces cathepsin protease activity in tumor-associated macrophages to promote cancer growth and invasion. Genes & Development. 2010; 24: 241–255. [DOI] [PMC free article] [PubMed] [Google Scholar]
- 30.De Palma M, Lewis CE. Macrophage Regulation of Tumor Responses to Anticancer Therapies. Cancer Cell. 2013; 23: 277–286. doi: 10.1016/j.ccr.2013.02.013. [DOI] [PubMed] [Google Scholar]
- 31.Yan D, Wang HW, Bowman RL, Joyce JA. STAT3 and STAT6 Signaling Pathways Synergize to Promote Cathepsin Secretion from Macrophages via IRE1alpha Activation. Cell Reports. 2016; 16: 2914–2927. doi: 10.1016/j.celrep.2016.08.035. [DOI] [PMC free article] [PubMed] [Google Scholar]
- 32.Piccolo V, Curina A, Genua M, Ghisletti S, Simonatto M, Sabò A, Amati B, Ostuni R, Natoli G Opposing macrophage polarization programs show extensive epigenomic and transcriptional cross-talk. Nature Immunology. 2017; 18: 530–540. doi: 10.1038/ni.3710. [DOI] [PMC free article] [PubMed] [Google Scholar]
- 33.Jura J, Wegrzyn P, Korostyński M, Guzik K, Oczko-Wojciechowska M, Jarzab M, Kowalska M, Piechota M, Przewłocki R, Koj A Identification of interleukin-1 and interleukin-6-responsive genes in human monocyte-derived macrophages using microarrays. Biochimica Et Biophysica Acta (BBA) - Gene Regulatory Mechanisms. 2008; 1779: 383–389. doi: 10.1016/j.bbagrm.2008.04.006. [DOI] [PubMed] [Google Scholar]
- 34.Mi H, Dong Q, Muruganujan A, Gaudet P, Lewis S, Thomas PD. PANTHER version 7: improved phylogenetic trees, orthologs and collaboration with the Gene Ontology Consortium. Nucleic Acids Research. 2010; 38: D204–D10. doi: 10.1093/nar/gkp1019. [DOI] [PMC free article] [PubMed] [Google Scholar]
- 35.Thomas PD, Campbell MJ, Kejariwal A, Mi H, Karlak B, Daverman R, Diemer K, Muruganujan A, Narechania A PANTHER: A Library of Protein Families and Subfamilies Indexed by Function. Genome Research. 2003; 13: 2129–2141. doi: 10.1101/gr.772403. [DOI] [PMC free article] [PubMed] [Google Scholar]
- 36.Goldstein I, Paakinaho V, Baek S, Sung MH, Hager GL. Synergistic gene expression during the acute phase response is characterized by transcription factor assisted loading. Nature Communications. 2017; 8: 1849. doi: 10.1038/s41467-017-02055-5. [DOI] [PMC free article] [PubMed] [Google Scholar]
- 37.Mathelier A, Zhao X, Zhang AW, Parcy F, Worsley-Hunt R, Arenillas DJ, Buchman S, Chen CY, Chou A, Ienasescu H, et al. JASPAR 2014: an extensively expanded and updated open-access database of transcription factor binding profiles. Nucleic Acids Research. 2014; 42: D142–7. doi: 10.1093/nar/gkt997. [DOI] [PMC free article] [PubMed] [Google Scholar]
- 38.Tripathi SK, Chen Z, Larjo A, Kanduri K, Nousiainen K, Aijo T, et al. Genome-wide Analysis of STAT3-Mediated Transcription during Early Human Th17 Cell Differentiation. Cell Reports. 2017; 19: 1888–1901. doi: 10.1016/j.celrep.2017.05.013. [DOI] [PubMed] [Google Scholar]
- 39.Czimmerer Z, Nagy ZS, Nagy G, Horvath A, Silye-Cseh T, Kriston A, Jonas D, Sauer S, Steiner L, Daniel B, et al. Extensive and functional overlap of the STAT6 and RXR cistromes in the active enhancer repertoire of human CD14+ monocyte derived differentiating macrophages. Molecular and Cellular Endocrinology. 2017; pii: S0303–7207. 30414-8 [DOI] [PubMed] [Google Scholar]
- 40.Fleming JD, Giresi PG, Lindahl-Allen M, Krall EB, Lieb JD, Struhl K. STAT3 acts through pre-existing nucleosome-depleted regions bound by FOS during an epigenetic switch linking inflammation to cancer. Epigenetics & Chromatin. 2015; 8: 7. doi: 10.1186/1756-8935-8-7. [DOI] [PMC free article] [PubMed] [Google Scholar]
- 41.Hutchins AP, Diez D, Takahashi Y, Ahmad S, Jauch R, Tremblay ML, Miranda-Saavedra D Distinct transcriptional regulatory modules underlie STAT3’s cell type-independent and cell type-specific functions. Nucleic Acids Res. 2013; 41: 2155–2170. doi: 10.1093/nar/gks1300. [DOI] [PMC free article] [PubMed] [Google Scholar]
- 42.Saeed S, Quintin J, Kerstens HH, Rao NA, Aghajanirefah A, Matarese F, Cheng SC, Ratter J, Berentsen K, van der Ent MA, et al. Epigenetic programming during monocyte to macrophage differentiation and trained innate immunity. Science (New York, NY). 2014; 345: 1251086. doi: 10.1126/science.1251086. [DOI] [PMC free article] [PubMed] [Google Scholar]
- 43.Kearns NA, Genga RMJ, Enuameh MS, Garber M, Wolfe SA, Cas9 MR. effector-mediated regulation of transcription and differentiation in human pluripotent stem cells. Development (Cambridge, England). 2014; 141: 219–223. doi: 10.1242/dev.103341. [DOI] [PMC free article] [PubMed] [Google Scholar]
- 44.Konermann S, Brigham MD, Trevino AE, Joung J, Abudayyeh OO, Barcena C, Hsu PD, Habib N, Gootenberg JS, et al. Genome-scale transcriptional activation by an engineered CRISPR-Cas9 complex. Nature. 2015; 517: 583–588. doi: 10.1038/nature14136. [DOI] [PMC free article] [PubMed] [Google Scholar]
- 45.Care MA, Cocco M, Laye JP, Barnes N, Huang Y, Wang M, Barrans S, Du M, Jack A, Westhead DR, et al. SPIB and BATF provide alternate determinants of IRF4 occupancy in diffuse large B-cell lymphoma linked to disease heterogeneity. Nucleic Acids Research. 2014; 42: 7591–7610. doi: 10.1093/nar/gku451. [DOI] [PMC free article] [PubMed] [Google Scholar]
- 46.Gertz J, Savic D, Varley KE, Partridge EC, Safi A, Jain P, Cooper GM, Reddy TE, Crawford GE, Myers RM Distinct properties of cell-type-specific and shared transcription factor binding sites. Molecular Cell. 2013; 52: 25–36. doi: 10.1016/j.molcel.2013.08.037. [DOI] [PMC free article] [PubMed] [Google Scholar]
- 47.Wu F, Zhang W, Shao H, Bo H, Shen H, Li J, Liu Y, Wang T, Ma W, Huang S Human effector T cells derived from central memory cells rather than CD8+T cells modified by tumor-specific TCR gene transfer possess superior traits for adoptive immunotherapy. Cancer Letters. 2013; 339: 195–207. doi: 10.1016/j.canlet.2013.06.009. [DOI] [PubMed] [Google Scholar]
- 48.Weichand B, Popp R, Dziumbla S, Mora J, Strack E, Elwakeel E, et al. Frank AC, Scholich K, Pierre S, Syed SN, et al. S1PR1 on tumor-associated macrophages promotes Q40 lymphangiogenesis and metastasis via NLRP3/IL-1beta. Journal of Experimental Medicine. 2017; 214: 2695–2713. doi: 10.1084/jem.20160392. [DOI] [PMC free article] [PubMed] [Google Scholar]
- 49.Ma X-J, Dahiya S, Richardson E, Erlander M, Sgroi DC. Gene expression profiling of the tumor microenvironment during breast cancer progression. Breast Cancer Research: BCR. 2009; 11: R7–R. doi: 10.1186/bcr2222. [DOI] [PMC free article] [PubMed] [Google Scholar]
- 50.Saleh SMI, Bertos N, Gruosso T, Gigoux M, Souleimanova M, Zhao H, Omeroglu A, Hallett MT, Park M Identification of Interacting Stromal Axes in Triple-Negative Breast Cancer. Cancer Research. 2017; 77: 4673–4683. doi: 10.1158/0008-5472.CAN-16-3427. [DOI] [PubMed] [Google Scholar]
- 51.Liu H, Dowdle JA, Khurshid S, Sullivan NJ, Bertos N, Rambani K, et al. Discovery of Stromal Regulatory Networks that Suppress Ras-Sensitized Epithelial Cell Proliferation. Developmental Cell. 2017; 41(392–407.e6): doi: 10.1016/j.devcel.2017.04.024. [DOI] [PMC free article] [PubMed] [Google Scholar]
- 52.Finak G, Bertos N, Pepin F, Sadekova S, Souleimanova M, Zhao H, Chen H, Omeroglu G, Meterissian S, Omeroglu A Stromal gene expression predicts clinical outcome in breast cancer. Nature Medicine. 2008; 14: 518–527. doi: 10.1038/nm1764. [DOI] [PubMed] [Google Scholar]
- 53.Martinez FO, Helming L, Milde R, Varin A, Melgert BN, Draijer C, Thomas B, Fabbri M, Crawshaw A, Ho LP, et al. Genetic programs expressed in resting and IL-4 alternatively activated mouse and human macrophages: similarities and differences. Blood. 2013; 121: e57. doi: 10.1182/blood-2012-06-436212. [DOI] [PubMed] [Google Scholar]
- 54.Spiller KL, Wrona EA, Romero-Torres S, Pallotta I, Graney PL, Witherel CE, Panicker LM, Feldman RA, Urbanska AM, Santambrogio L, et al. Differential gene expression in human, murine, and cell line-derived macrophages upon polarization. Experimental Cell Research. 2016; 347: 1–13. doi: 10.1016/j.yexcr.2015.10.017. [DOI] [PubMed] [Google Scholar]
- 55.Nagy Z, Tora L. Distinct GCN5/PCAF-containing complexes function as co-activators and are involved in transcription factor and global histone acetylation. Oncogene. 2007; 26: 5341–5357. doi: 10.1038/sj.onc.1210604. [DOI] [PubMed] [Google Scholar]
- 56.Ramsey SA, Knijnenburg TA, Kennedy KA, Zak DE, Gilchrist M, Gold ES, Johnson CD, Lampano AE, Litvak V, Navarro G, et al. Genome-wide histone acetylation data improve prediction of mammalian transcription factor binding sites. Bioinformatics. 2010; 26: 2071–2075. doi: 10.1093/bioinformatics/btq405. [DOI] [PMC free article] [PubMed] [Google Scholar]
- 57.Sahoo A, Alekseev A, Tanaka K, Obertas L, Lerman B, Haymaker C, Clise-Dwyer K, McMurray JS, Nurieva R Batf is important for IL-4 expression in T follicular helper cells. Nature Communications. 2015; 6: 7997. [DOI] [PMC free article] [PubMed] [Google Scholar]
- 58.Kurachi M, Barnitz RA, Yosef N, Odorizzi PM, DiIorio MA, Lemieux ME, et al. The transcription factor BATF operates as an essential differentiation checkpoint in early effector CD8+ T cells. Nature Immunology. 2014; 15: 373–383. doi: 10.1038/ni.2834. [DOI] [PMC free article] [PubMed] [Google Scholar]
- 59.Kurachi M, Barnitz RA, Yosef N, Odorizzi PM, DiIorio MA, Lemieux ME, Yates K, Godec J, Klatt MG, Regev A, et al. Batf-dependent Th17 cells critically regulate IL-23 driven colitis-associated colon cancer. Gut. 2016; 65: 1139–1150. doi: 10.1136/gutjnl-2014-308227. [DOI] [PubMed] [Google Scholar]
- 60.Martinez FO, Gordon S, Locati M, Mantovani A. Transcriptional Profiling of the Human Monocyte-to-Macrophage Differentiation and Polarization: new Molecules and Patterns of Gene Expression. The Journal of Immunology. 2006; 177: 7303. doi: 10.4049/jimmunol.177.10.7303. [DOI] [PubMed] [Google Scholar]
- 61.S. A. FastQC : a quality control tool for high throughput sequence data. Available online 2010; http://www.bioinformatics.babraham.ac.uk/projects/fastqc.
- 62.Bolger AM, Lohse M, Usadel B. Trimmomatic: a flexible trimmer for Illumina sequence data. Bioinformatics. 2014; 30: 2114–2120. doi: 10.1093/bioinformatics/btu170. [DOI] [PMC free article] [PubMed] [Google Scholar]
- 63.Grabherr MG, Haas BJ, Yassour M, Levin JZ, Thompson DA, Amit I, Adiconis X, Fan L, Raychowdhury R, Zeng Q, et al. Trinity: reconstructing a full-length transcriptome without a genome from RNA-Seq data. Nature Biotechnology. 2011; 29: 644–652. doi: 10.1038/nbt.1883. [DOI] [PMC free article] [PubMed] [Google Scholar]
- 64.Dobin A, Davis CA, Schlesinger F, Drenkow J, Zaleski C, Jha S, Batut P, Chaisson M, Gingeras TR STAR: ultrafast universal RNA-seq aligner. Bioinformatics. 2013; 29: 15–21. doi: 10.1093/bioinformatics/bts635. [DOI] [PMC free article] [PubMed] [Google Scholar]
- 65.Liao Y, Smyth GK, Shi W. featureCounts: an efficient general purpose program for assigning sequence reads to genomic features. Bioinformatics. 2014; 30: 923–930. doi: 10.1093/bioinformatics/btt656. [DOI] [PubMed] [Google Scholar]
- 66.Love MI, Huber W, Anders S. Moderated estimation of fold change and dispersion for RNA-seq data with DESeq2. Genome Biology. 2014; 15: 550. doi: 10.1186/s13059-014-0550-8. [DOI] [PMC free article] [PubMed] [Google Scholar]