Abstract
Somatic cells acquire mutations throughout the course of an individual’s life. Mutations occurring early in embryogenesis will often be present in a substantial proportion of, but not all, cells in the post-natal human and thus have particular characteristics and impact1. Depending upon their location in the genome and the proportion of cells they are present in, these mosaic mutations can cause a wide range of genetic disease syndromes2 and predispose to cancer3,4. They have a high chance of being transmitted to offspring as de novo germline mutations and, in principle, can provide insights into early human embryonic cell lineages and their contributions to adult tissues5. Although it is known that gross chromosomal abnormalities are remarkably common in early human embryos6 our understanding of early embryonic somatic mutations is very limited. Here, we use whole genome sequences of adult normal blood from 241 individuals to identify 163 early embryonic mutations. We estimate that approximately three base substitution mutations occur per cell per cell-doubling in early human embryogenesis and these are mainly attributable to two known mutational signatures7. We used the mutations to reconstruct developmental lineages of adult cells and demonstrate that the two daughter cells of many early embryonic cell doublings contribute asymmetrically to adult blood at an approximately 2:1 ratio. This study therefore provides insights into the mutation rates, the mutational processes and the developmental outcomes of cell dynamics operative during early human embryogenesis.
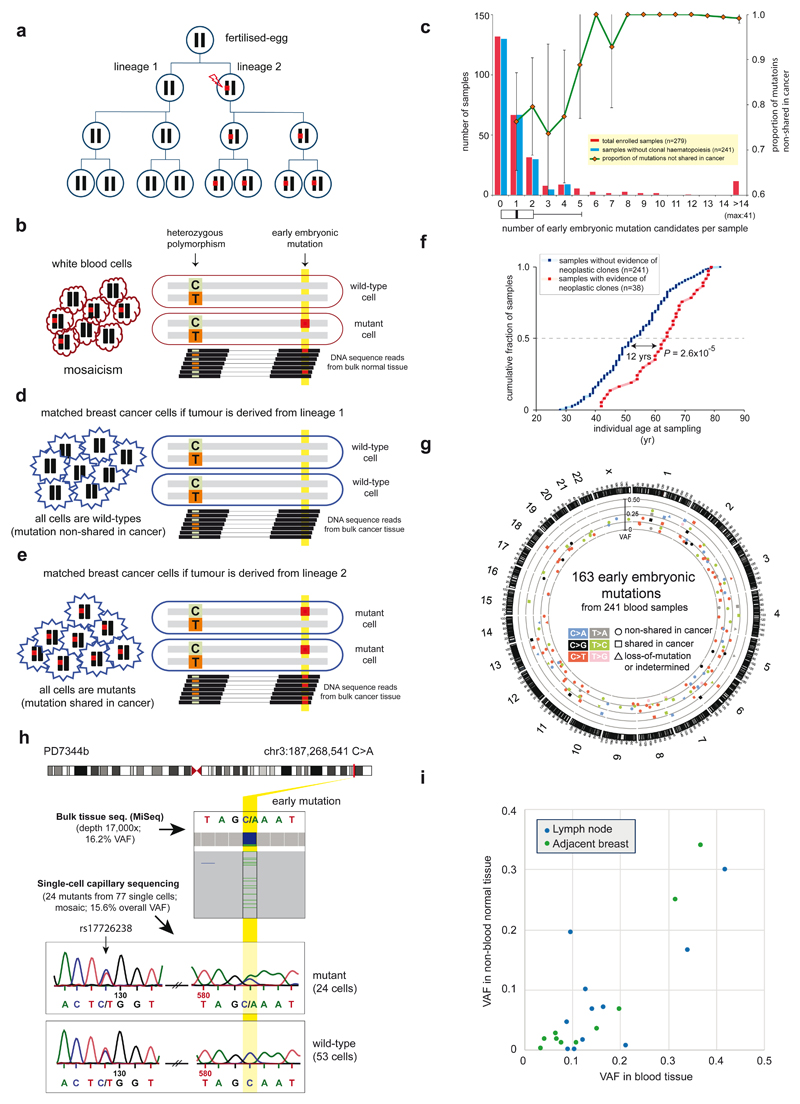
In adult tissues, somatic mutations of early embryonic derivation can be distinguished from inherited polymorphisms as they will generally show lower variant allele fractions (VAFs). For example, somatic mutations arising in one of the two daughter cells of the fertilized egg will show VAFs of ~25% (Fig. 1a), compared to ~50% for inherited heterozygous polymorphisms, if the two cells have contributed equally to the adult tissue analysed8. To identify early embryonic base substitutions, we analysed whole-genome sequences of blood samples from 279 individuals with breast cancer (mean sequencing coverage 32-fold; Supplementary Table 1) seeking mutations with VAFs ranging from 10% to 35%. To remove inherited heterozygous polymorphisms which by chance fell within this range, we phased candidate low VAF mutations to nearby germline heterozygous polymorphisms (Fig. 1b; Supplementary Discussion 1). Substitutions present in regions with copy number variation were also excluded (Extended Data Fig. 1). After experimental validation by ultrahigh-depth targeted sequencing (median read-depth=22,000; Supplementary Table 2), we identified 605 somatic base substitutions with accurate VAF estimates (Extended Data Fig. 2) that appeared to be present in only a proportion of adult blood cells.
Figure 1. Detection of somatic mutations acquired in early human embryogenesis.
(a) Transmission of an early embryonic mutation. Embryonic cells (circles), their diploid genomes (black bars), and an early mutation (red-square) are represented.
(b) Early embryonic mutations appear as somatic mosaicism in normal polyclonal tissue (for example, blood).
(c) Distribution of the numbers of early embryonic mutations per individual genome. The proportion of mutations non-shared with cancer is shown (green-line). Error bars denote 95% confidence intervals (binomial test).
(d-e) Early embryonic mutations can appear as either absent (‘non-shared’; d) or fully clonally present (‘shared’; e) in cancer cells depending on the embryonic cell lineage from which the cancer is derived.
(f) The median age of individuals with evidence of neoplastic expansion in blood is 12 years higher than individuals without it. P value from t-test.
(g) A circos plot showing 163 early embryonic mutations identified from 241 individuals.
(h) A mosaic mutation validated by single-cell sequencing.
(i) Embryonic mutations (n=21) confirmed in non-blood normal tissues (breast or lymph node; n=13).
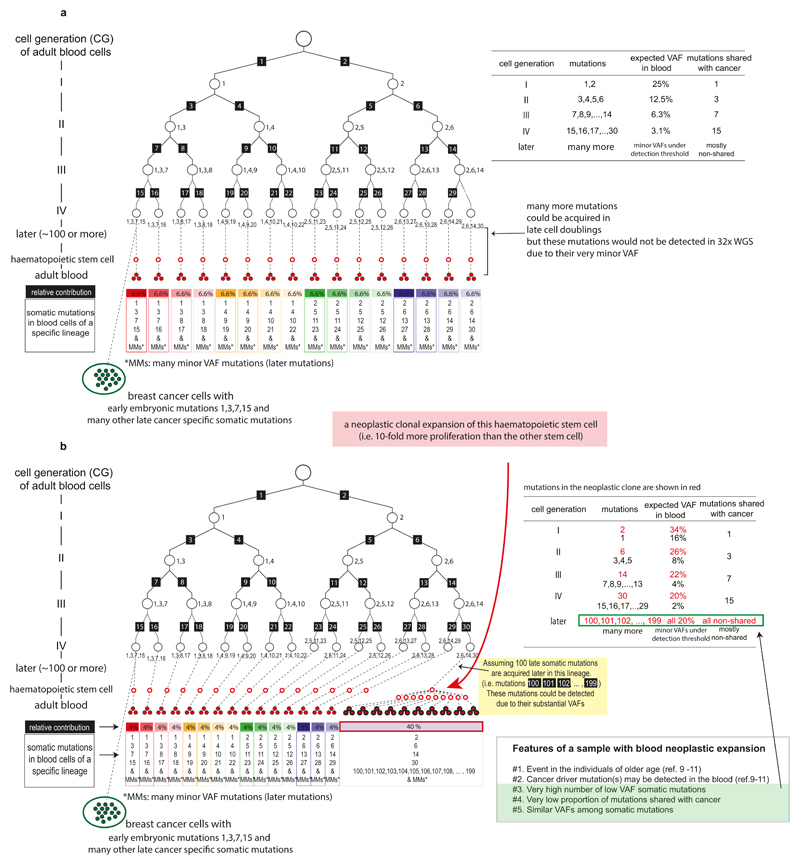
Mutations present in a subset of white blood cells can also reflect the presence of neoplastic clonal expansions arising from adult haematopoietic stem cells9–11. We excluded samples showing evidence of neoplastic clones on the basis of the following features (Fig. 1c-1e; Extended Data Fig. 3; Supplementary Discussion 2): many (n>4) low VAF mutations; absence of the mutations in breast cancers from the same individuals; presence of known driver mutations for haematological neoplasms (Supplementary Table 1); multiple mutations showing similar VAFs (Extended Data Fig. 4). The median age of the 38 individuals carrying these cryptic neoplasms was 12 years higher than the other cases (64 vs. 52 years, respectively; P=0.00003; Fig. 1f), consistent with previous reports9–11. We thus obtained 163 mosaic mutations from 241 individuals, the large majority of which are likely to have arisen during early human embryogenesis (Fig. 1g; Supplementary Table 3; Extended Data Fig. 5). From one individual, multiple single leukocytes were sequenced to confirm that the mutation was only present in a subset (Fig. 1h).
Most mutations of early embryonic origin would be expected to be present in all normal tissues and not just in white blood cells. From 13 individuals with putative early embryonic mutations (n = 21) in blood, we sequenced normal breast (composed of cells of ectodermal and mesodermal origins) and lymph nodes (composed of cells of mesodermal origin). Consistent with their proposed embryonic origin, most mutations were found in the additional normal tissues, with VAFs indicative of being mosaic and correlating with those in blood (Fig. 1i). The VAFs were generally lower in normal breast and lymph node than in blood, suggesting that different tissues may develop from slightly different subpopulations of early embryonic cells and/or that unequal lineage expansions occur later in development (Supplementary Discussion 3).
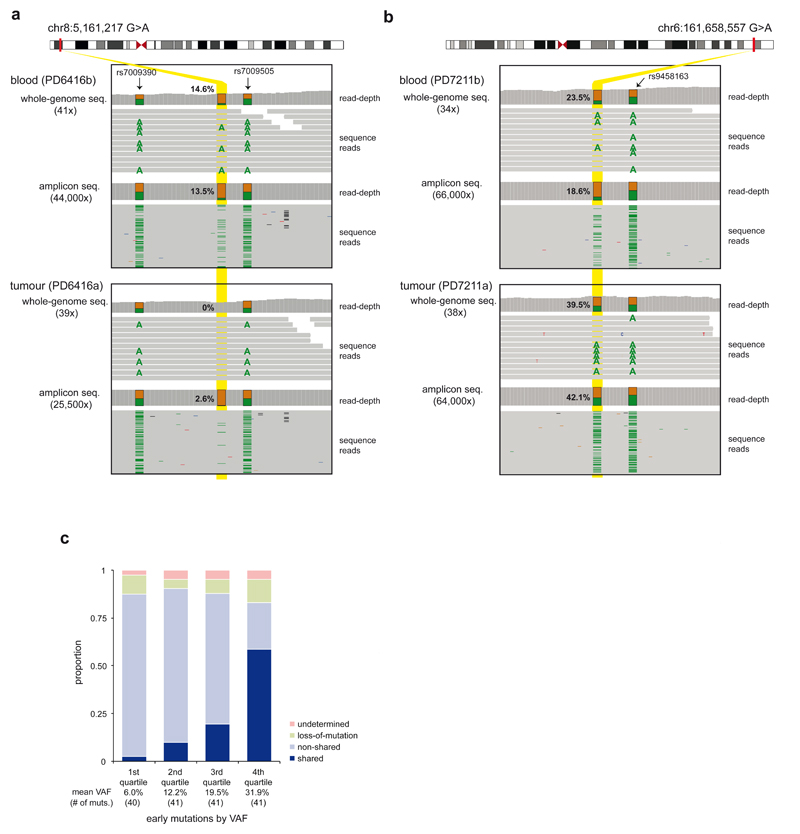
In contrast to normal tissues, which are composed of multiple somatic cell clones, a breast cancer derives from a single somatic cell. Thus an early embryonic mutation would be expected either to be present in all cells of a breast cancer or in none (Figs. 1a, 1d-e) (although in practice the presence of contaminating non-cancer cells in the cancer sample has to be corrected for; Methods). This was the pattern observed, with 37 mosaic mutations shared between the blood and the breast cancer from the same individuals, 105 non-shared and 21 uncertain, either due to a large deletion in the relevant region of the cancer genome (n=14) or statistical ambiguity (n=7) (Figs. 2a, 2b). The proportion of early embryonic mutations shared between the blood and the cancer is predicted to change according to the stage of early embryonic development at which the mutation occurred, with mutations acquired later (and thus with lower VAF) shared less often (Extended Data Fig. 3a). Consistent with this expectation, embryonic mutations with lower VAFs in blood were shared less frequently with breast cancers (Fig. 2c).
Figure 2. Features of early embryonic mutations.
(a) An example of an embryonic mutation non-shared with cancer. The minimal low VAF (2.6%) observed in the tumor ultrahigh-depth amplicon sequencing is consistent with a contaminating population of mutant non-neoplastic cells.
(b) An example of an embryonic mutation shared with cancer. The high VAF (42.1%) in the tumour ultrahigh-depth amplicon sequencing is consistent with a clonal mutation in cancer cells and a contaminating population of wild-type non-neoplastic cells.
(c) The proportion of shared mutations correlates with the VAF of mutations in blood.
These patterns of sharing of low VAF mutations in blood (which is of mesodermal origin) with normal and neoplastic breast tissue (which is of ectodermal origin) supports a model in which the most recent common ancestor (MRCA) cell of adult blood cells is the fertilized egg (Extended Data Figs. 6, 7; Supplementary Discussion 4), or is the MRCA cell of all/most somatic cells, rather than an alternative model of a single MRCA of the blood occurring at a later stage of embryogenesis with very restricted subsequent fate.
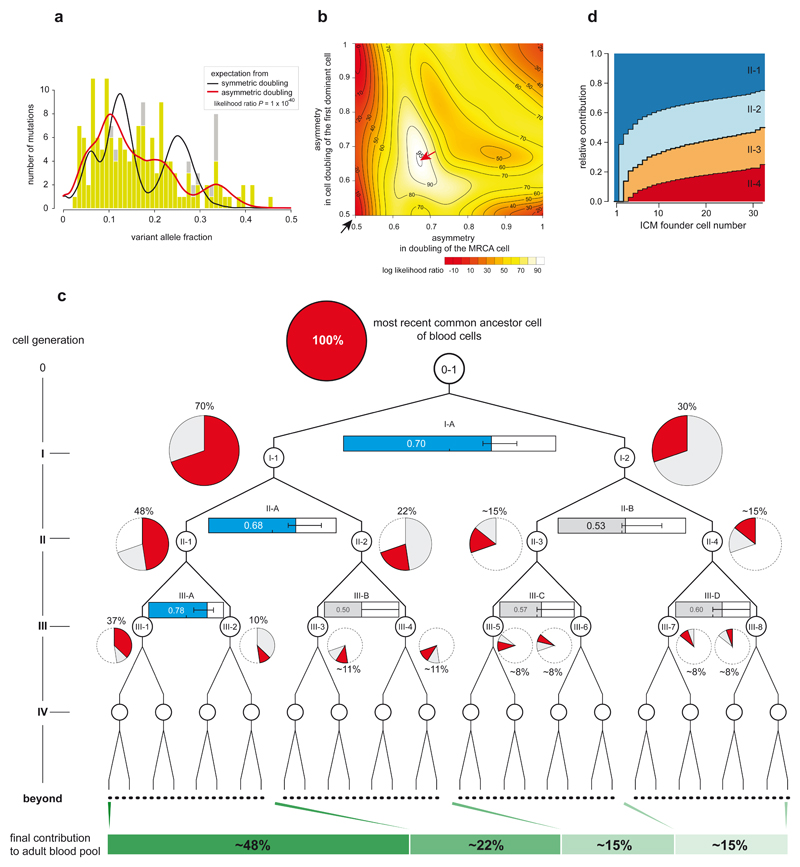
The VAFs of the 163 validated early embryonic mutations in blood, which ranged from 45% to 1% provided insights into the early cellular dynamics of embryogenesis (Fig. 3a). If, in the large majority of embryos, the first two daughter cells of the MRCA cell of blood contributed equally to adult blood cells (symmetric cell doubling), a narrow 25% VAF peak would be expected for mutations acquired at this stage. However, this peak was not observed indicating that asymmetric contributions are common. To explore the basis of this asymmetrical contribution systematically, we generated a series of models of cell genealogies in which different branches contributed unequally to adult blood (Methods). The asymmetry that best fitted the observed VAF distribution is an average, across embryos, ~2:1 contribution of the first two daughter cells (cells I-1 and I-2; Figs. 3b, 3c). Moreover, this ~2:1 asymmetric cell contribution appears to extend to some cells of the second cell generation (cells II-1 and II-2; Figs. 3b, 3c) and possibly of the third cell generation. The model with unequal contributions was clearly superior to a null model of strictly symmetric cell doublings (P=1x10-40, likelihood ratio test, Figs. 3a, 3b). This frequent unequal contribution of the earliest human embryonic cells to adult somatic tissues is consistent with previous indications from studies of mouse development5,12–15.
Figure 3. Unequal contributions of early embryonic cells to adult somatic tissues.
(a) The VAF distribution of 163 early embryonic mutations in blood. Light green bars, VAFs from ultrahigh-depth amplicon sequencing; gray bars, VAFs from whole-genome sequencing (when ultrahigh-depth amplicon sequencing is not available). The expected distributions of VAFs (with adjustment for sensitivity of mutation detection) from symmetric (black-line) and best-fitting asymmetric cell doubling models (red-line).
(b) A contour plot showing the optimization of asymmetries in cell doublings. The horizontal axis and vertical axis present the asymmetry levels for the first and the second dominant cell doublings (cell doubling of MRCA and I-1 cells (see Fig 3c), respectively). Compared to the symmetric model (black arrow), the maximum likelihood asymmetric model (red arrow) provides a much better fit to the data (P=1x10-40, Likelihood Ratio Test).
(c) Maximum likelihood relative contributions of early cells to the adult blood cell pool (pie chart). The asymmetries of each cell doubling are shown using horizontal bar graphs (blue bar, significant asymmetry; grey bar, nonsignificant asymmetry). Error bars denote 95% confidence intervals from non-parametric bootstrapping.
(d) Simulation study under a stochastic bottleneck model according to the number of ICM founder cells. The relative contributions of the first four cells are shown (Methods).
Two classes of biological mechanism may underlie these asymmetrical contributions. One daughter cell and its progeny may contribute more because they intrinsically have a lower death rate, a higher proliferation rate and/or a preference for contributing to embryonic compared to extra-embryonic tissues14–16. Indeed, studies in mice have shown that cells separated from 2-cell embryos have different intrinsic developmental potentials16,17. Alternatively, the stochastic consequences of a bottleneck in early embryo development could be the source of the asymmetry. In the early blastocyst stage human embryo, composed of 50-100 cells (blastomeres), only the minority of cells (<20) present in the inner cell mass (ICM) eventually contribute to adult somatic tissues18. Under a model in which a small number (<20) of ICM founder cells are selected at random from a blastocyst composed of many (>50) blastomeres and most founder cells contribute to adult cell populations, it is likely that the progeny of the first two embryonic cells will, in many embryos, be selected in unequal proportions, as recently observed in mouse19. Simulations indicate that stochastic allocation of early human embryonic cells into the ICM results in levels of asymmetric contribution similar to those observed (Fig. 3d; Extended Data Fig. 8; Methods). Assuming the stochastic hypothesis is correct, we estimate that ~10 ICM founder cells give rise to blood (Fig. 3d).
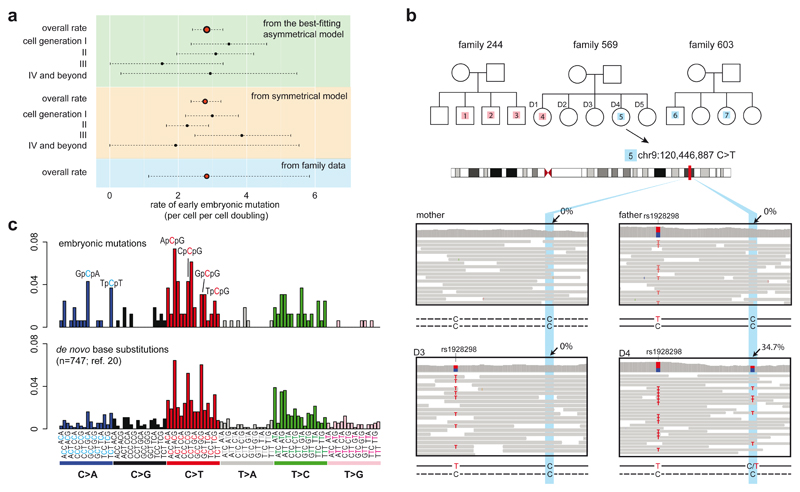
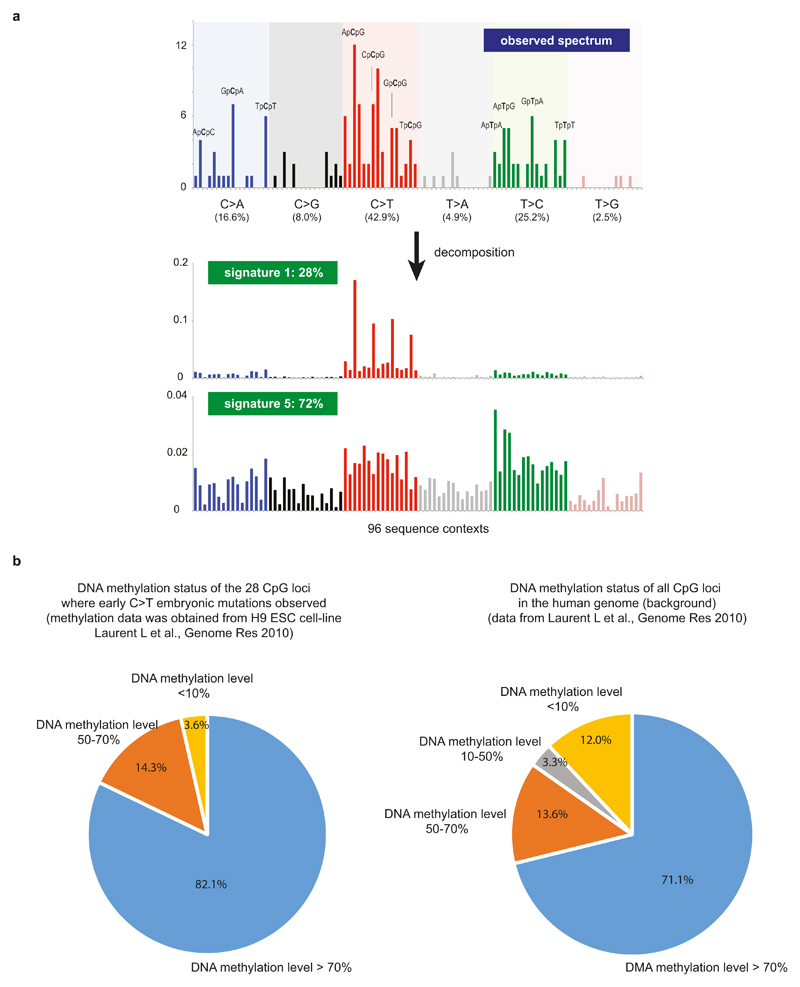
Using the asymmetric cell-doubling model, we estimated a rate of 2.8 substitution mutations per early embryonic cell per cell-doubling (Fig. 4a; 95% confidence interval 2.4-3.3; Supplementary Discussion 5). A similar rate was obtained under a simple model without asymmetric contributions (Fig. 4a). This early embryonic mutation rate is comparable to, but may be slightly higher than, the germline mutation rate (~0.2-1.4 mutations per diploid-genome per cell division)20. However, our mutation rate per cell-doubling may not equate to the rate per cell division because early embryonic development may involve cell loss, perhaps due to fatal chromosomal aberrations6, and thus each cell-doubling may entail more than a single cell division. If so, the mutation rate per cell per cell division will be lower than the estimated rate per cell per cell-doubling. We validated the early embryonic mutation rate using whole-genome sequences of bloods from three large families20 (Fig. 4b). We found seven substitution mutations in children that were not present in their parents that had features described above of early embryonic mutations (Extended Data Fig. 9) and obtained a similar early embryonic mutation rate of 2.8 per cell per cell doubling (95% Poisson confidence interval 1.1-5.8; Fig. 4a). The mutational spectrum of early embryonic mutations was predominantly C:G>T:A (42.9%), T:A>C:G (25.1%) and C:G>A:T substitutions (16.6%), similar to that of de novo germline mutations20 (Figure 4c) and is likely caused by multiple endogenous mutagenic processes (Extended Data Fig. 10; Supplementary Discussion 6).
Figure 4. Rates and mutational spectra of early embryonic mutations.
(a) Estimates of early embryonic mutation rates. Best-fitting asymmetric model (top), symmetric model (middle) and family study (bottom) provide similar rate. Broken lines represent 95% confidence intervals from bootstrapping (Methods).
(b) Early embryonic mutations obtained from 3 large families. Each mutation is shown with a number (index) inside the white rectangles or circles in the pedigrees. Sequencing reads are shown for one of the mutations (#5) in family 569.
(c) Similar mutational spectra (ref. 7) obtained from 163 early embryonic mutations and from 747 de novo mutations reported previously (ref. 20).
Very few early post-zygotic mutations have been reported21–23. We identified 163 mosaic mutations from 241 individuals which exhibit the characteristics of early embryonic origin (although we cannot exclude a small residual set of other types of mutations). With the accurate VAF information and the proportion of mutations shared with cancer, we explored developmental processes. An average ~2:1 asymmetry of early human embryonic cells in their contributions to adult tissues (at least to blood) was revealed, providing insight into the fates of cells at early developmental stages. However, our conclusion is based upon statistical reconstructions and requires corroboration through larger studies particularly involving multiple tissues. The results also allowed estimation of the mutation rate and characterization of the mutational processes underlying base substitutions in the early human embryo, which appear comparable to those in mouse embryogenesis5 and human adult somatic tissues18,24–25. The early human embryonic mutation rate estimated here indicates that, using similar methods to those introduced in mice5, reconstruction of cell lineage trees using somatic mutations should be possible in humans.
Methods
Samples and sequencing data
For initial discovery of early embryonic mutations, we analyzed whole-genome sequencing data from 304 blood samples of breast cancer patients which were sequenced as normal controls for the ICGC (International Cancer Genome Consortium) breast cancer study26. Genomic DNA was extracted from bulk white-blood cells collected from fresh peripheral bloods. Matched breast cancer samples for all the individuals were also analysed in parallel. Of these, 25 samples with putative DNA contamination were removed (see below for more details), and 279 samples were used for the detection of early embryonic mutations (the sample information is available in Supplementary Table 1). For validating the early embryonic mutation rates, we also used whole-genome sequencing data from 19 blood samples from 3 families20. For confirmation of early embryonic mutations in non-blood normal tissues, we extracted genomic DNA from FFPE (formalin-fixed and paraffin embedded) lymph nodes and normal breast tissue surgically resected during mastectomy procedures (sample history is available in Supplementary Table 1). The whole-genome sequencing data analysed in this study were generated using Illumina platforms (either Genome Analyzer or HiSeq 2000). Sequencing reads were aligned to human reference genome build 37 (GRCh37) using the BWA alignment tool27. All PCR duplicate reads were removed.
DNA contamination control
We thoroughly checked for possible sources of DNA contamination: tumour-normal swap; matched tumour DNA contamination in blood; and cross-contamination with DNA from other individuals. Cases of tumour-normal sample swap were identified by examining the presence of genome-wide copy number variations in the putative normal samples. Cases of matched tumour DNA contamination were identified by examining the VAFs in the blood sequencing data for the somatic substitution variants identified in the matched cancer using CaVEMan software28 (available at https://github.com/cancerit/CaVEMan/). When the average VAF of cancer specific substitutions was more than 1% in a blood sample, we regarded the blood sample to be contaminated by a matched tumour DNA sample. Finally, for each sample, the level of DNA cross-contamination with tissue from other individuals was estimated as described previously29.
Variant calling
VarScan2 software30 was used for initial early embryonic variant calling. Input vcf files were generated from whole-genome sequencing bam files using samtools31 mpileup with three options -q 20, -Q 20 and -B. Then VarScan2 somatic was applied to blood samples with matched tumour samples as reference. Three options were applied for the VarScan2 running, --min-reads2 4, --min-ave-qual 20, and --strand-filter. We selected substitution variants with VAFs ranging from 0.1 to 0.35 as putative early embryonic mutations. We removed putative mutations near germline indels (within 5bp), because these are mostly false positives due to mismapping. Putative mutations likely to be sequencing artifacts and/or germline polymorphisms were removed if the variants were also present in the unmatched blood samples analysed in this study, or were known germline polymorphisms with at least 1% population allele frequency identified from the 1000 Genomes Project (Nov.2013), or deposited in dbSNP (v138). We removed putative variants in segmental duplications, simple repeats, repetitive sequences (RepeatMasker) and homopolymer sequences in the human reference genome (downloaded from UCSC genome browser, http://genome.ucsc.edu/).
Substitution phasing
We phased the putative embryonic variants to heterozygous germline substitutions using sequences from whole-genome sequencing as described previously29,32. For more conservative phasing, we did not use sequences at the 4bp extremes of each read, where substitutions and indels are not well called. From blood whole-genome sequencing data, we classified the putative variants into 4 groups, ‘phasing not available’, ‘mixed pattern’, ‘no evidence of subclonality’ and ‘subclonal’ using criteria as follows:
-
(1)
Phasing not available: no available read covering both the mutation and the heterozygous SNP in the vicinity
-
(2)
Mixed pattern: the putative variant is present in both the bi-allelic haplotypes of heterozygote SNPs
-
(3)
No evidence of subclonality: the putative variant is completely and exclusively present on one of the two haplotypes of heterozygote SNPs
-
(4)
Subclonal: the putative variant is present in a fraction of one of the two haplotypes of heterozygote SNPs. The variant is not present on the other haplotype.
Putative mutations categorized other than subclonal were removed. For the subclonal mutations, we estimated the probability of false subclonality due to sequencing errors. For this calculation, we counted only informative reads, which were participating in the phasing: reads covering the putative mutation locus and one of the alleles of the inherited heterozygous SNP in which the early mutation is linked.
Q1 and Q2 are sequencing error rates of the bases at the putative mutation and the heterozygote SNP loci, respectively; i represents each of the informative reads harboring the mutant base at the early embryonic mutation site; V is the total number of informative reads with the mutant base; likewise, j represents each of the informative reads harboring a wild-type base at the early embryonic mutation site and W is the total number of such reads. When there was more than one heterozygous SNP site that was used for phasing, we calculated a string of phasing error rates (Perror) from every SNP site and multiplied them to obtain an overall phasing error rate.
Substitutions at regions of copy number variation
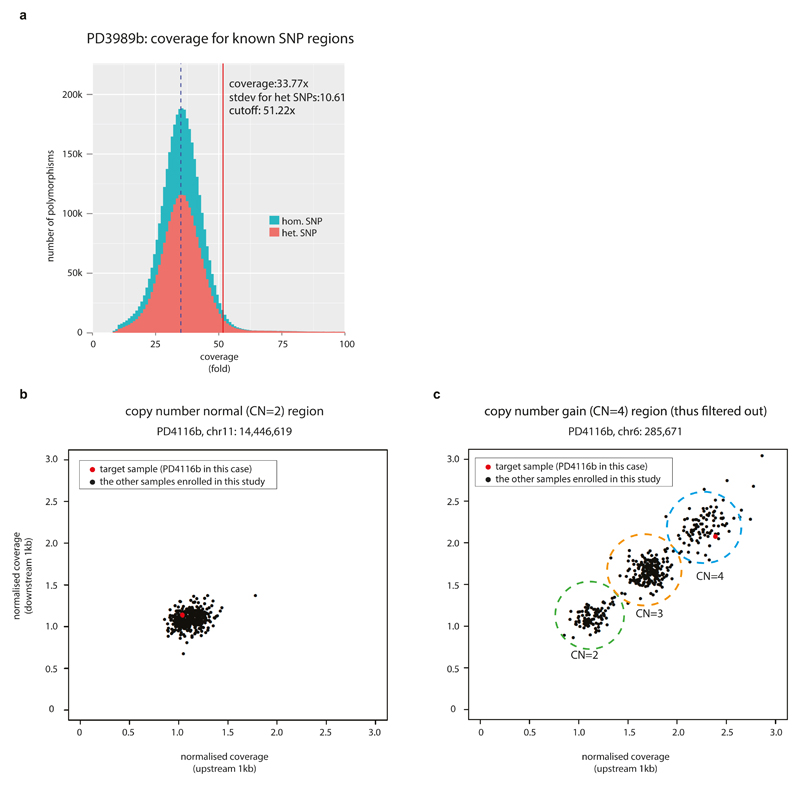
We removed any putative mutation if it was located in a region with copy number higher than two. We isolated potential copy number variation of each genome using both intra-sample and inter-sample methods. For the intra-sample method, we calculated the standard deviation of read-depth from all (~2 million) germline heterozygous SNP sites from every normal whole-genome sequencing dataset. When the local coverage of an early embryonic mutation candidate was higher than the 95% percentile (i.e. local depth is greater than genome-wide mean WGS coverage + 1.645 x stdev; for example, the cutoff is approximately 46x in typical 30x coverage sequencing) of the sample, we considered the site was possibly duplicated thus removed from our further analyses (Extended Data Fig. 1a). For the inter-sample method, we clustered the normalized normal WGS read counts of a candidate region (from 1kb upstream of the mutation site to 1kb downstream) from all the samples included in this study. If the normalized copy number of the target sample was either an outlier in the clustering or was two times higher than expected from genome-wide average, the mutation candidate was considered to locate in a germline copy number variant region and thus filtered out (Extended Data Figs. 1b, 1c).
Mutations shared by the paired tumour tissue
Then we investigated whether the early embryonic mutation candidates were also present in cells of the breast cancer from the same individual. This is not always straightforward because (1) whole-genome sequencing of cancer tissue generates a mixture of sequences from cancer and contaminating normal cells and (2) copy number changes are quite frequent in the cancer genome. Using the ASCAT algorithm33, based on analysis of the variant allele fraction for heterozygous germline SNPs for regions departing from diploidy in the tumour genome, we estimated the tumour cell fraction (‘f’ in the formula below), ploidy of cancer genome (‘p’) and local A (major) and B (minor) allele copy numbers (‘a’ and ‘b’, respectively). Each mutant allele was previously phased to either A or B allele nearby. Using these estimates, we built a model for the expected number of reads (N) supporting the mutant allele in paired-cancer genome sequencing in three different scenarios:
-
I)The mutant allele is not shared (and approximate 95% binomial confidence interval),
, D is the read-depth of the mutant site in matched cancer WGS sequencing and
, ρ is the expected VAF of the mutant allele. -
II)The mutant allele is phased to B allele (with 95% confidence interval),
If nB = 0 we cannot differentiate scenario I and II (loss-of-mutant allele). -
III)The mutant allele is phased to A allele (with 95% confidence interval),
According to these models, we assigned our mutation to four groups: ‘non-shared’ (model I), ‘shared’ (model II or III), ‘loss-of-mutant allele’ (when the mutant allele is phased to B allele and b is 0) and ‘uncertain’ (when more than 1 model could explain or no convincing ASCAT result is available for the sample).
Visual inspection
We visually inspected all the candidate embryonic mutations using the Integrative Genomic Viewer34 and JBrowse35. We confirmed that genomic regions with putative embryonic mutations were not in sequences with evidence of artifacts and thus that any putative mutation was supported by high quality sequencing reads. Two examples of early embryonic mutations are shown in Figs. 2a and 2b.
Validation by MiSeq amplicon sequencing
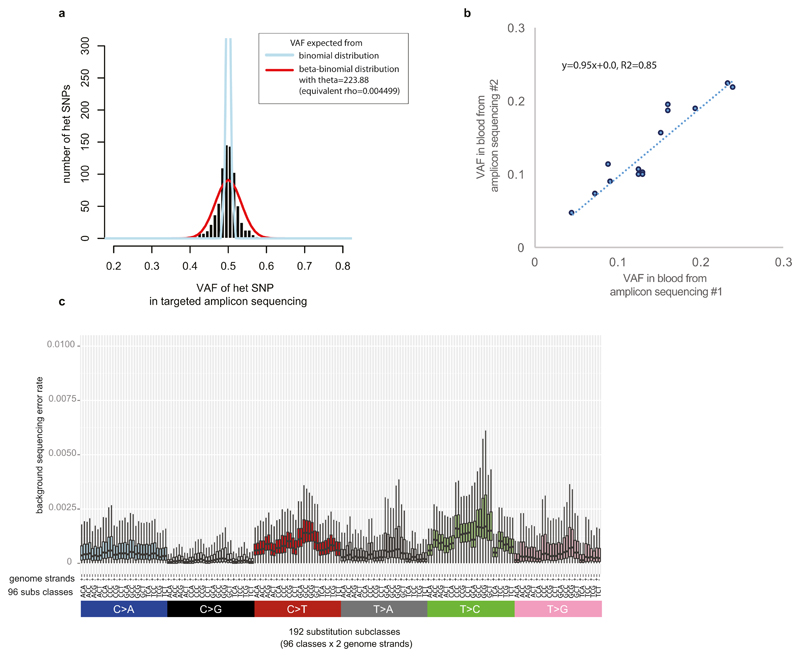
We tried to validate all the putative early embryonic mutation sites. We designed 959 pairs of PCR primers (Supplementary Table 2) for 863 candidate early mutations to make amplicons for the putative mutation sites along with the nearby heterozygote SNPs used for phasing from the blood and paired-cancer DNA samples of the individual harboring the putative mutation. After clean-up using ExoSAP-IT (Affymetrix Inc., Santa Clara, CA, USA), all amplicons from blood and matched cancer tissues were separately pooled and sequenced by 2 x 250bp MiSeq sequencing (Illumina Inc., San Diego, CA, USA) 2 runs per pool, expecting > 1000x coverage per amplicon (median read-depth=22,000x). Because the read-depth is very high in amplicon sequencing, we could obtain a much more precise variant allele fraction of the putative embryonic mutation along with accurate phasing to the germline heterozygote substitution. The VAFs for germline heterozygote substitutions in non-repetitive genome regions showed a clear peak at 0.5 (Extended Data Fig. 2a). To estimate the extent to which the amplification process biased the VAFs, we fitted a beta-binomial distribution with mean 0.5 and dispersion to the numbers of reads supporting both alleles in heterozygous SNPs (which have an expected VAF=0.5). This confirmed that the additional uncertainty introduced by amplifications was very small (θ = 223.88, overdispersion ρ = 1/(1+ θ) = 0.004). This estimate of the overdispersion was used in the maximum likelihood asymmetric models. The targeted amplicon sequencing showed high precision in the assessment of the VAF of a mutation (Extended Data Fig. 2b). The MiSeq validation experiment confirmed that the candidate mutations were not sequencing artifacts nor inherited mutations both from the resulting VAFs (ranged from 0.01 to < 0.5, mostly < 0.35) and from phasing to the local heterozygous SNP. From this validation study, we found that there is a clear linear relationship between phasing error rates (as calculated above) and validation success rate (data not shown). We could not create amplicons from some mutation candidates due to lack of DNA samples or unsuccessful PCR reactions. Of these, we rescued 14 early embryonic mutations because they are likely to be true on the basis of phasing error probability in whole-genome sequencing (Supplementary Table 3).
Validation using single cells
From the blood of one individual (PD7344) we sorted 144 granulocytes. Genomic DNA of each single cell was extracted and whole-genome amplified (WGA) using the REPLI-g Single Cell Kit (Qiagen Inc.) using the manufacturer’s protocol. Of the 144 single cells, 131 provided substantial amounts of WGA DNA. PCR amplicons were produced targeting the early embryonic substitutions in the sample (chr3:187268541 C>A). PCR reactions were successful from 118 WGA DNAs. After clean-up of the 118 PCR products, capillary sequencing was performed. Of these, 41 showed allelic dropout of the DNA haplotype on which the embryonic mutation was present (i.e. absence of the T allele of rs17726238) and thus were not further considered. Among the 77 informative amplicon sequencing results, 24 showed clear evidence of the embryonic substitutions as shown Fig. 1h.
Late somatic mutations due to clonal haematopoiesis
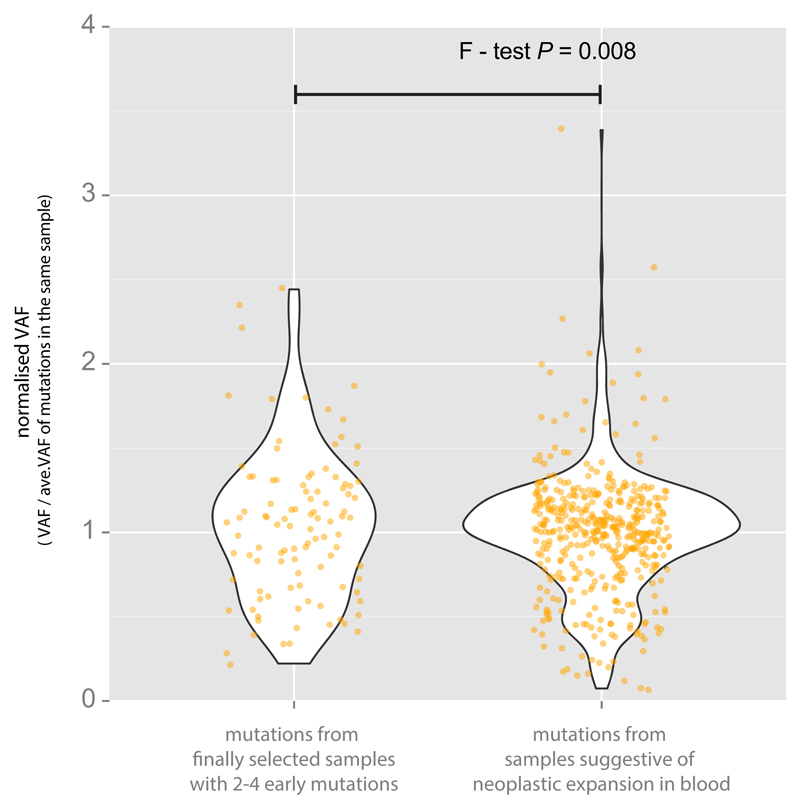
Age-related clonal haematopoiesis is quite common, and observed in more than 10% of persons older than 65 years old9–11. Like mutations that have occurred in the very early embryo, these late mutations appear to be subclonal (mosaic) in adult blood. However, such late mutations are rarely shared with the breast cancer sample from the same individual because the vast majority of them occurred after formation of the three germ layers, specifically in the mesodermal lineage. In addition, late clonal expansions in the blood invariably carry a large number of co-clonal mutations accumulated throughout life36, and so many subclonal mutations with similar VAFs are detected together in the blood sample. In this study, we found that each blood sample harbors a median of 1 validated phased subclonal mutation. According to their distribution (Fig. 1c), we regarded 31 samples with at least 5 validated subclonal mutations as outlier samples, defined as deviating from the median value by more than twice the interquartile range. Consistent with the hypothetical presence of late clonal expansions in these outlier samples, the proportion of non-shared mutations abruptly increases from this point (Fig. 1c). Furthermore, we searched 72 cancer genes (gene list is available in Supplementary Table 1) which have been reported to drive clonal haematopoiesis9–11 for low VAF somatic mutations (supported by at least 3 mismatches) and identified eight samples with mutations in DNMT3A, ASXL1, JAK2, PTPN11 and CBL genes. Of these, four samples were found among the 31 outlier samples. Conservatively, the remaining four samples were also classified as containing clonal haematopoiesis despite the small number of mutations found in them, and therefore removed from downstream analyses. Finally, we assessed whether mutation candidates obtained from each sample showed significantly similar VAFs to each other compared to the other samples, indicating that those mutations may be present in same blood clone, and thus filtered out three additional samples. Indeed, from the 38 filtered samples, we observe that mutations have more similar VAF to the other mutations in the same sample (calculated by where I represents each mutation in the sample) compared to the mutations in samples with 2-4 mutations (Extended Data Fig. 4). As a result, out of the total 279 samples, we classify 241 samples as having no evidence of clonal haematopoiesis, and therefore informative for detecting embryonic mutations (Extended Data Fig. 5).
Finally, we assessed whether matched tumour sequences showed evidence of the mutant allele with significantly higher VAFs than background sequencing error rate levels (Extended Data Fig. 2c). This would be expected, because normal cells are always present in cancer samples and a fraction of the normal cells would carry the mutant allele if a mutation is truly embryonic origin. Fifteen candidate mutations, from which the VAFs in the matched cancer are not higher than background, were removed through this step. After application of all filters, we identified 163 likely early embryonic mutations from 241 samples.
Asymmetry in early cell doublings
In order to fit different lineage models to the VAF of embryonic mutations, we used a likelihood approach. If read counts were fully independent, allelic counts from each mutation could be modelled as being binomially distributed. However, to account for the overdispersion caused by the amplification process prior to library preparation, we assume allelic counts to be beta-binomially distributed. As shown above, we estimated the overdispersion parameter θ=223.9 (CI95%: 201-248). Over 98.7% of heterozygous SNPs had a VAF in the range [0.4,0.6] in the re-sequencing dataset (Extended Data Fig. 2a)
If the first cell doubling gives rise to two daughter cells that contribute equal numbers of cells to the adult (or the adult blood population), the doubling is considered symmetrical. Otherwise, the doubling is considered asymmetrical, with one cell contributing a fraction α1 of the cells in the adult and the other cell 1-α1. Assuming that embryonic mutations are heterozygous, the expected VAF of a mutation occurring in branch 1 of the lineage is 0.5*α1 and in branch 2 is 0.5*(1-α1). The same applies to any doubling in the lineage, with the two daughter cells contributing αn and 1-αn, relative to the contribution of the mother cell (n). This allows calculating the expected VAFs in the adult cell population for mutations occurring at each branch of the model lineage tree (vb).
For each embryonic mutation, j, we observe the number of mutant reads (mj) and the total coverage at the site (cj). The likelihood of observing a given mutation under a particular lineage model requires integrating the likelihood of observing the mutation under each branch of the lineage, considering also the mutation rate at each branch and the sensitivity to mutations from each branch. In other words, the VAFs are fitted to a mixture model as mutations could have occurred at any branch in the tree. The total log-likelihood of the model is the sum of the log-likelihoods from all mutations.
Where N is the total number of mutations in the dataset (N=163), B is the total number of branches in the model and rb is the (relative) mutation rate of the branch. sb is the (relative) sensitivity to mutations from the branch, which is a function of the expected VAF of mutations from the branch (vb). Sensitivity as a function of VAF is calculated as described in the section below.
Statistical comparison of models of increasing complexity
In order to evaluate whether a lineage with one asymmetric doubling fits the data significantly better than a symmetric model, we obtained the maximum likelihood estimate for αn from each of the 15 doublings from the first 4 cell-generations while keeping all other doublings symmetrical. The best 1-asymmetric-rate model is tested against the symmetric model with a likelihood ratio test with 1 degree of freedom, and the p-value is subjected to Bonferroni multiple testing correction to account for the 15 models evaluated. This revealed that a lineage where the first doubling is asymmetric with α1≈0.61 fits the data much better than a symmetric model (LL0=-1444.4, LL1=-1366.3, P <10-16).
In order to test models with additional asymmetric rates we used a heuristic approach. Instead of testing all possible combinations of asymmetric rates, we tested the impact of adding an extra asymmetric rate to the previous model (14 alternative models). The best model included asymmetry in the cell doubling of the dominant daughter cell in the first cell doubling (LL1=-1366.3, LL2=-1349.102, Bonferroni-corrected P=3.1e-08). The same approach was used to find a better model with three and four asymmetric doublings. The best model with three asymmetric doublings is only marginally better than the best model with two asymmetric doublings (LL3=-1344.784, Bonferroni-corrected P=0.021). More complex models provided no significantly improved fits to the data.
In order to evaluate whether other asymmetric lineages with two or three asymmetric rates could provide better fits, we exhaustively calculated the maximum-likelihood values of all possible lineages with two or three asymmetric doublings in the first four cell-generations. No model provided a better fit to the ones found by the heuristic approach. This analysis strongly supports a lineage with at least two asymmetric rates (first and second branches).
The confidence intervals shown in Fig. 3c were calculated by non-parametric bootstrapping (i.e. resampling the original data with replacement) followed by numerical search of the maximum likelihood values of the top seven rates in the lineage.
Estimating the average mutation rate from asymmetric lineage models
Assuming a given lineage model, a global estimate for the average mutation rate per genome per doubling in the early embryo can be obtained with the following equation:
N is the total number of embryonic mutations detected (N=163), S is the number of samples studied (S=241) and sb is the sensitivity to detect a mutation from a particular branch of the lineage tree. Further, an approximate estimate of the average mutation rate at different cell generations could be obtained using an Expectation-Maximisation (EM) algorithm. These estimates may be more robust against possible contamination from neoplastic expansions at very low VAFs than the global estimate above.
Assuming a particular lineage, the relative probability (expectation step) of a mutation (j) coming from one particular branch (b) is given by:
In the first iteration of the EM algorithm, the mutation rate (rj) of all branches is considered identical. The number of mutations estimated to come from each branch is then calculated as the sum of these probabilities across all mutations:
Nb is then used to update the mutation rate per branch (maximisation step). And these two steps are iterated until convergence, obtaining an improved fit to the data and estimates of the mutation rates per branch. To constrain the parameters of the model, the rates of all branches from the same cell-generation are maintained identical during the EM algorithm. Confidence intervals were obtained by bootstrapping (400 replicates). Importantly, allowing the mutation rates of the first three cell-generations to vary freely with respect to the rest of the lineage (values shown in main text, Fig. 4a), does not significantly improve the fit of the model (LL=-1347.0 as opposed to LL2, p-val=0.24, 3 degrees of freedom).
Simulation of sensitivity
We estimated the sensitivity for early embryonic mutations from simulation studies. The sensitivity will be dependent on the target VAF (ρ) of early mutations. First, we randomly generated 1,000 in-silico embryonic mutations genome-wide. In-silico mutations within known gaps of the human reference genome were removed and replaced by newly generated mutations. Note that this means that sensitivity and so the mutation rates estimated in our study exclude mutations present in gaps, which approximately correspond to ten percent of the human genome. Next, under 21 different theoretical VAF (ρ; 0.016, 0.028, 0.031, 0.056, 0.063, 0.083, 0.111, 0.125, 0.139, 0.167, 0.194, 0.222, 0.250, 0.278, 0.306, 0.333, 0.361, 0.389, 0.417, 0.444, 0.472) we queried how many of them could be detected on average from the whole-genome sequences of 241 samples. The same filtration steps for real mutation candidates were applied for the in-silico mutations: if mutations are found in 1000 Genomes Project dataset, dbSNP variation, segmental duplications, simple repeats, repetitive sequences by RepeatMasker, homopolymers, and potential copy number gain regions, we regarded these mutations as undetectable. Then, for each potentially detectable in-silico mutation, and under several given ρ, we calculated the fraction of mutations that could be successfully detected and successfully phased to at least one heterozygous SNP nearby in each individual WGS.
where P(detection|ρ) is the probability of a mutation having a sufficient number of reads supporting the mutant allele (at least 4, or the cutoff value in this study) and a VAF within the range considered in the discovery phase of this study (from 10% to 35%). Likewise, P(phasing|ρ) represents the probability of successful phasing a mutation to the heterozygous SNP nearby. We calculated P(detection|ρ) and P(phasing|ρ) as below:
where roundup () and roundoff() functions round to the higher or the closest integer number, respectively. D is the read-depth of each detectable in-silico mutation site, N represents the total number of heterozygous SNPs which are available for phasing, i is each of the heterozygote SNPs and Si is number of reads spanning both a mutation locus and the heterozygous SNP. For simplicity of simulation, we assumed all the bases have a good base quality (i.e. phred score >20). Finally, we added all probabilities, P(observed|ρ), obtained from an individual given ρ. When ρ is fixed, P(observed|ρ) correlates with read-depth of blood whole-genome sequencing, and the regression line was obtained using loess regression. We obtained our sensitivity estimates for the 21 different ρ values using this approach and a simulated coverage of 32-fold coverage (median coverage for 241 blood samples). For example, 4.41% of the 1000 in-silico mutations with ρ=0.25 were detectable when whole-genome sequencing coverage was 32x (Extended Data Fig. 5e).
A stochastic model of embryoblast formation
In the maximum likelihood fitting of lineage models described above, a single lineage tree was fitted to the data from multiple different individuals. The resulting lineage intends to be a merely descriptive representation of the average contribution of different cells across embryos. The model implicitly assumes that the same asymmetric lineage describes all patients and that the first divisions of the embryo follow a largely constant pattern across individuals. It remains unclear whether early embryonic development in viable embryos under physiological conditions follows a strict plan in humans or whether there is extensive variation between individuals, as observed in mouse19. In the presence of extensive variation in the early lineage across embryos, the asymmetry rates estimated using a constant lineage should be interpreted with caution.
Interestingly, extensive asymmetry in the contribution of the first cells of the embryo to the adult cell pool can also emerge under more stochastic models of embryo development. As a proof-of-principle, here we show how a bottleneck in the pre-implantation embryo, in which only a randomly selected subset of cells contributes to the final somatic tissues, can give rise to extensive asymmetry in the contribution of the first few cells of the embryo to the adult cell pool, not dissimilar to the general patterns observed in this study.
All final embryonic tissues are thought to derive from a fraction of cells in the blastocyst termed the inner cell mass (ICM), while the rest of the blastocyst (the trophoblast) will form the placenta and other extra-embryonic supporting tissues, and will not contribute to the adult cell pool. In mice this separation is thought to involve about 12 ICM cells gravitating at the center of the blastocyst at the 32-cell stage37. This imposes a significant bottleneck to the contribution of the first few cells in the embryo to the adult cell pool. Let us consider a simple bottleneck model where a completely random subset of l cells from the n-cell stage embryo are selected to form the adult cell pool. If there were m cells carrying an early somatic mutation out of a total of n, the probability to subselecting k in a draw of l cells is given by the hypergeometric distribution. This is to be multiplied by the probability that m cells are mutated due to early germline mutations. Without a bottleneck, variant alleles would only be expected at powers of ½, with intensities following an 1/f power law due to the increase in the number of cells with every cell doubling. Hence the probability of selecting k mutated cells out of a total n cells is given by:
| (1) |
where const is a normalisation constant. Note that this distribution has support on VAF k/l, rather than 1/2i. The latter is approached in the limit that l = n, that is that all cells would propagate to the final somatic tissue (Extended Data Fig. 8a). The overall probability of observing mutations at a given VAF v is then to be multiplied by the sensitivity S(v) to detect mutation a given frequency, and the additional dispersion arising from detecting mutations on a finite number of x sequencing reads at a given coverage c, modeled by a beta-binomial sampling model, as described in the deterministic modeling used in the previous sections.
| (2) |
, the dispersion ρ is inferred from heterozygous SNPs and taken to be θ=223.9, ρ = 1/(1+ θ).
We may hence fit the likelihood (2) to the observed data, knowing the number of mutated reads x and coverage c for each patient, given the number of ICM cells l and cells n. The maximum likelihood is obtained for l=11 ICM cells separating after 6 generations, or n=64 cells (Extended Data Fig. 8b), although there are many solutions with similar likelihood.
From Eq. (2), an estimate of the overall histogram p(v) can be computed as the average over all data points p(v; l, n) = Σi p(xi = vci; l, n, ci) / N, where N = 163 is the number of observations. Using a Bayesian approach, assuming a uniform prior on the number of cell generations at which ICM commitment occurs ranging from 3 to 8, and similarly a uniform prior on the number of ICM cells ranging from 5:32, allows for computing the posterior probability of the observed data as:
| (3) |
The result is shown in Extended Data Fig. 8c.
This model shows how a simple random selection of a subset of the cells in the early embryo can lead to substantial asymmetries in the contribution of the first few cells in the embryo to the final adult cell pool. We note that this represents one extreme of possible combined deterministic and stochastic scenarios. It remains unclear to what extent viable embryos under physiological conditions follow a tightly predetermined developmental plan or whether largely stochastic processes dominate before the formation of the first structures in the blastocyst. The available data cannot distinguish between these models, but we anticipate that more detailed analyses of early embryonic somatic mutations could shed some light on this question. In particular, deterministic models predict that all individuals will share a very similar lineage pattern while stochastic models predict largely different early lineages among individuals.
Family analyses
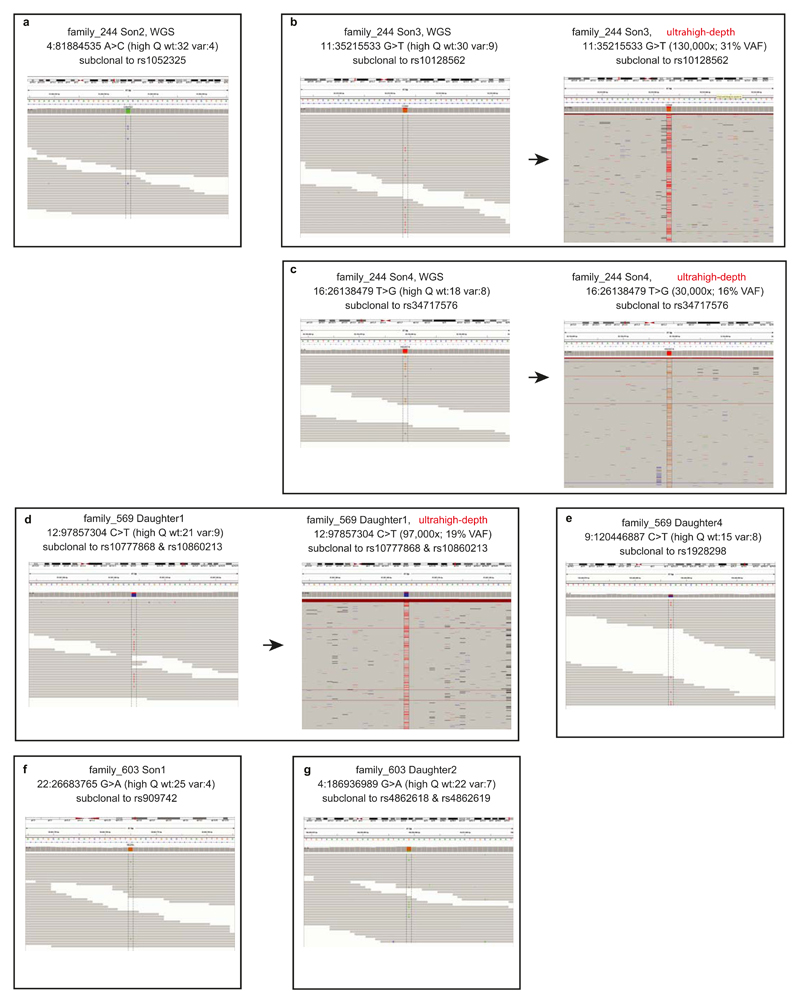
Genomic DNA was extracted from peripheral blood of 19 individuals from three large families. From the whole-genome sequences (median read-depth=25x), we detected subclonal substitutions in 13 children using identical methods for the blood tissues of 241 breast cancer patients, i.e. DNA contamination control, variant calling, phasing to nearby heterozygous SNP, assessment of copy number of the mutation loci, and visual inspection as described above. We detected 7 early embryonic mutations (Extended Data Fig. 9), which were subclonal and not shared by the parents or any siblings, therefore these are highly likely to be post-zygotic mutations which occurred at the early embryonic stages of a specific child.
We calculated the rate of early mutations from families (Rfamily) as below:
Where R is the overall average early mutation rate (2.8 mutations per cell per cell generation), N is the number of mutations (n=163) and S is the total sample size (n=241). Likewise, Nfamily is the number of mutations (n=7) identified from family data and Sfamily is the total number of children analysed (n=13). α is relative sensitivity of early mutations in family data, which must be less than 1 because sequencing coverage is ~7x coverage lower in families (25x) than the unrelated 241 blood samples (32x). The simulation of sensitivity (shown above) suggests that α is 0.796. A Poisson Exant test was used to calculate the 95% confidence interval of Rfamily.
Detecting contributions of mutational signatures
Mutational signatures were detected by refitting of previously identified and validated consensus signatures of mutational processes (http://cancer.sanger.ac.uk/cosmic/signatures). All possible combinations of at least seven mutational signatures were evaluated by minimizing the constrained linear function:
Here, and represent vectors with 96 components corresponding to the six types of single nucleotide variants and their immediate sequencing context and Exposurei is a nonnegative scalar reflecting the number of mutations contributed by this signature. N reflects the number of signatures being re-fitted and all possible combinations of consensus mutational signatures for N between 1 and 7 were examined, resulting in 2,804,011 solutions. Model selection framework based on Akaike information criterion was applied to these solutions to select the optimal decomposition of mutational signatures. The analysis revealed that signature 1 and signature 5 best describe the set of embryonic mutations (Extended Data Fig. 10a). Including any other mutational signature did not improve the explanation of the set of embryonic mutations.
Extended Data
Extended Data Figure 1.
Filters to exclude mutation candidates in regions with copy number variation.
a, For every blood sample, we assessed the distribution of coverage of ~3M inherited SNP loci. Using this distribution, we determined a cutoff value that is used for inter-sample CNV filtering (see Methods). In the case of PD3989b shown in the figure, candidate mutation loci with >51x coverage were considered to be located on copy number gain thus removed.
b, An example of inter-sample CNV filtering (see Methods). Normalized coverage for chr11:14,446,619 region of PD4116b is located in the normal copy number (CN=2) cluster.
c, Copy number gain was identified in a candidate mutation locus (chr6:285,671) from PD4116b by the inter-sample CNV filtering method. Therefore, this mutation candidate was removed from further downstream analyses.
Extended Data Figure 2.
Features of ultrahigh-depth targeted amplicon sequencing used for validation.
a, Estimation of the impact of potential PCR allelic bias from targeted amplicon sequencing. Using inherited heterozygous SNP sites which were PCR amplified and ultra-deep sequenced, we assessed potential PCR bias (i.e. preferential amplification of one allele compared to the other): the distribution of VAFs was broader than expected from a binomial distribution (theoretical maximum), but the PCR bias was not substantial as a clear peak at VAF=0.5 was present. The estimated overdispersion level (theta value in beta-binomial distribution) was 223.88. The estimate was used in the simulation studies for assessment of cell doubling asymmetry in early embryogenesis (see Methods for more details).
b, High precision of ultrahigh-depth amplicon sequencing in assessment of VAF of a mutation. For the 14 early embryonic mutations, we quantified their VAFs from the second blood samples using the same strategy (i.e. PCR amplification and deep sequencing). The VAF estimates from the first and the second sequencings were highly correlated.
c, Background error rate of targeted amplicon sequencing (see Methods). The background mutation rate showed sequence context dependency. Error bars denote 2 * interquartile range. We used these background mutation rates in a filtering step.
Extended Data Figure 3.
Features of a blood sample with a neoplastic clonal expansion in the blood.
a, This hypothetical scenario illustrates the expectation in a normal blood sample when there is no obvious neoplastic clonal expansion. Each white-filled black circle represents an embryonic cell. White-filled red and red-filled circles are adult haematopoietic stem cells and adult blood cells, respectively. Here, for simplicity, we assumed a uniform mutation rate of 1 substitution per cell per cell doubling. Each mutation during cell doubling is represented by a number in a black-filled rectangle. Mutations accumulated in a specific early cell are shown with numbers next to the cell. The final mutations acquired at an early cell of cell generation IV (16-cell stage) and their expected relative contribution to adult blood tissues (1/16 or 6.6%) is summarized in the box below the cellular phylogenetic tree. We assumed that breast cancer (green-filled circles) cells are descendant of the embryonic cell of the leftmost lineage (which harbors mutations #1, #3, #7 and #15). In the circumstances, the expected features of early embryonic mutations (VAFs, chance to be shared with breast cancer) are summarized in the right table.
b, An alternative scenario with a neoplastic clonal expansion in the blood (here we assumed a haematopoietic stem cell contributes 40% of all blood cells). We assumed that additional 100 somatic mutations were further acquired during late cell doublings. The expected features are summarized in the right table.
Extended Data Figure 4.
Features of mutations in blood samples with neoplastic clonal expansions.
Mutations from samples with evidence of neoplastic clonal expansions display more similar VAFs to (the right violin plot) each other compared to mutations from samples without neoplastic clonal expansions (the left violin plot).
Extended Data Figure 5.
Features of the early embryonic mutations identified in this study.
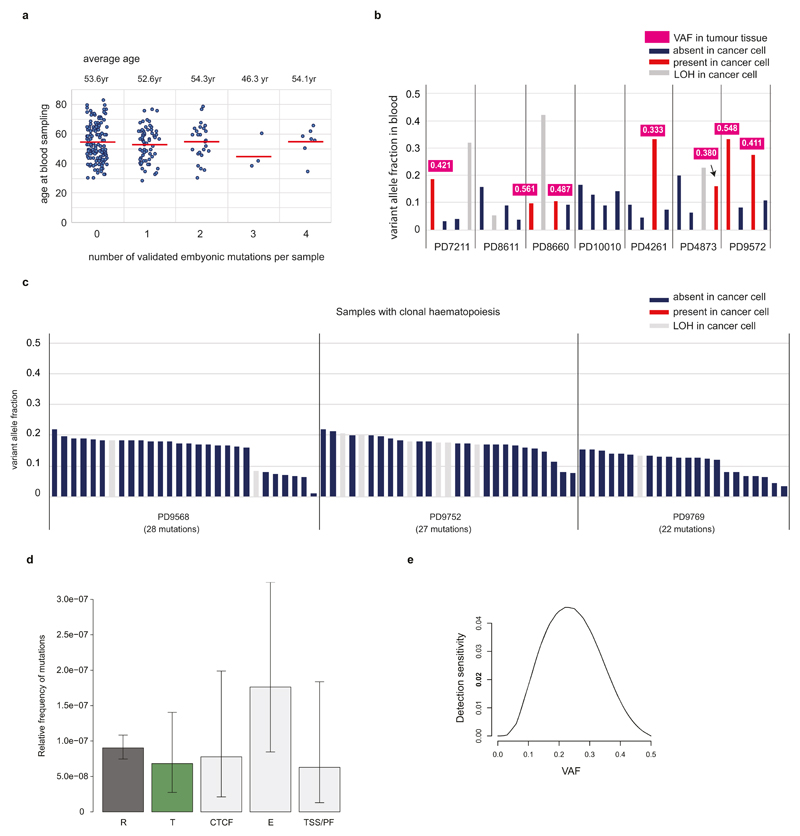
a, As expected for early embryonic mutations, we observe no relationship between the age of individuals and the number of mutations found in an individual. In case of late mutations, we find more mutations in the aged individuals (Fig. 1f).
b, Features of mutations in the samples (n=7) with four early embryonic mutations suggest that these mutations are not likely to be related with a neoplastic clonal expansion: VAFs of mutations are diverse and a fraction of these mutations are shared with the matched cancer. The corresponding VAFs in the matched tumour tissues are shown in numbers above the bars.
c, Samples with neoplastic clonal expansions (i.e. PD9568b, PD9752b and PD9569b) show different features: mutations show similar VAFs each other and are not shared by cancer cells.
d, Enrichment of early mutations according to ENCODE dataset. We find higher mutation frequency in transcriptionally repressed (R) than active (T) regions, but the difference is nonsignificant in our study (chi-square test, df=1, P value = 0.4696), presumably due to the insufficient number of early embryonic mutations (n=163). R, repressed chromatin; T, transcribed chromatin; CTCF, CTCF-bound regions; E, enhancer related; TSS/PF, promoter related.
e, From a simulation study using 1,000 in-silico embryonic mutations, we assessed the detection sensitivity of early embryonic mutations from 32x whole-genome sequencing (see Methods). This sensitivity was used in downstream analyses (for example, likelihood tests for understanding the asymmetry of cell doublings and tests for the calculation of the early embryonic mutation rates.
Extended Data Figure 6.
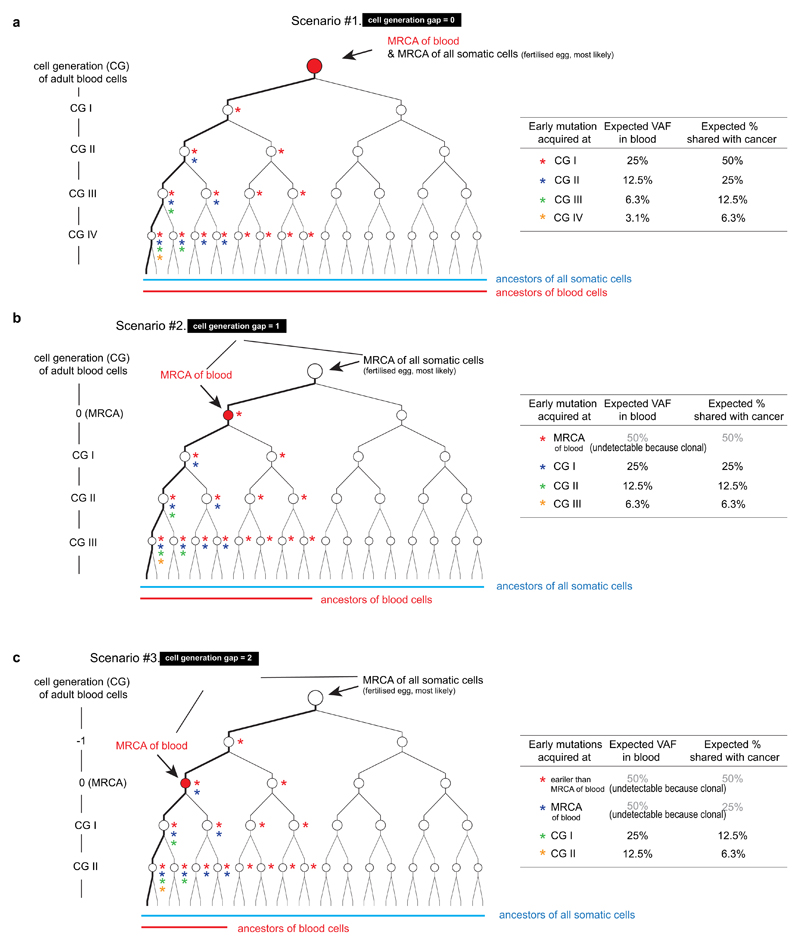
Expected proportion of early embryonic mutations shared by cancer according to the cell generation gap between the MRCA cell of adult blood cells and the MRCA cell of all somatic cells.
a, (see Supplementary Discussion 4) A scenario when there is no cell generation gap. Early mutations are represented by asterisks in colors. A summary of the expected proportion of mutations shared with cancer cells is shown in the table: the chance is twice the VAF of each early embryonic mutation.
b, A scenario when the MRCA cell of adult blood cells is formed one cell generation later than the MRCA cell of all somatic cells. The chance is identical to the VAF of each early embryonic mutation.
c, A scenario when the MRCA cell of adult blood cells is formed two cell generations later than the MRCA cell of all somatic cells. The chance is half the VAF of each early embryonic mutation.
Extended Data Figure 7.
The MRCA cell of adult blood cells is the MRCA cell of all somatic cells (or the fertilized egg)
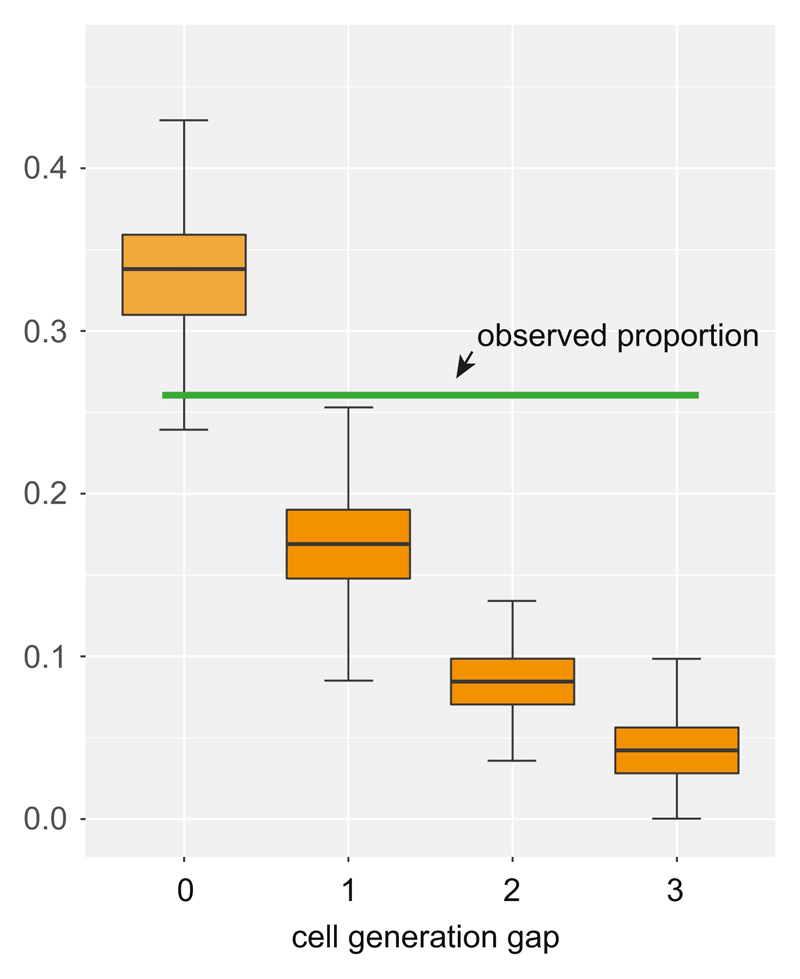
(see Supplementary Discussion 4) Using the expected proportion of mutations shared with cancer (Extended Data Fig. 6), we estimated the timing when the MRCA cell of adult blood cells is formed. Thr four orange boxes show the expected proportions from four scenarios, when there are 0, 1, 2, and 3 cell generation gaps between the MRCA cells. The observed proportion (26%; green horizontal line) in this study is closest to the expectation from the model of 0 cell generation gap. Error bars by interquartile range x 2 (from the simulation study).
Extended Data Figure 8.
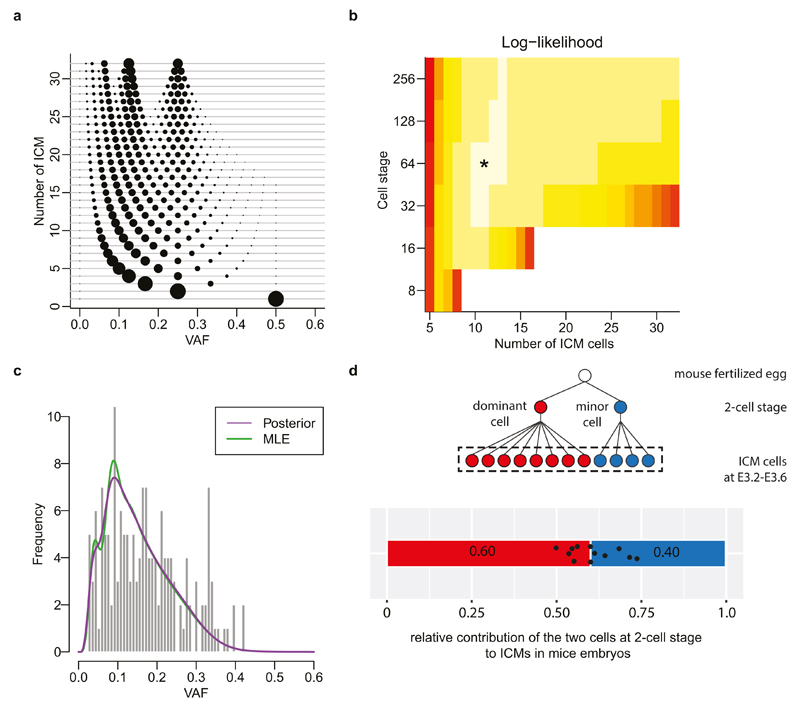
The simulation study to understand potential stochasticity in the embryoblast formation. (see Methods, ‘A stochastic model of embryoblast formation’ for more details)
a, The expected distribution of VAF of early embryonic mutations in a stochastic model in which n cells (y-axis) are randomly selected as epiblasts from the 32-cell stage embryo. The size of circle is proportional to the relative frequency of mutations at each VAF.
b, The stochastic model estimates the number of founder epiblast cells and the timing (cell stage) of their commitment. The maximum likelihood is selection of 11 cells in 64-cell stage.
c, The VAF distribution of early embryonic mutations expected from the maximum likelihood stochastic model. The maximum likelihood estimation (MLE) and the posterior probability by a Bayesian approach are shown by green and purple curves, respectively. Our observation of the 163 early embryonic mutations is represented by the histogram.
d, Unequal contribution of the first two cells to ICM cells by direct observation of 12 mouse-embryos using inverted light-sheet microscope by Strnad et al., Nature Methods (2016) (ref. 19). Schematic diagram (cell phylogeny) is shown above the bar graph. We re-analysed their observation, counting the relative contribution to ICM (black dots indicate the observed asymmetry in each embryo). These unequal contribution levels ranged from 0.5:0.5 to 0.74:0.26 and the average was 0.6:0.4.
Extended Data Figure 9.
Early embryonic mutations (n=7) identified from 3 large families.
a-g, Sequencing reads (using IGV images) for the seven mutation loci are shown. All mutations are subclonal to a specific allele of a heterozygous SNP in the vicinity. As expected to early embryonic mutations, the VAFs of mutatnt alleles are lower than 0.5 and the mutant alleles are not found in the genomes of all the parents and the siblings. Three mutations (panels b, c and d) were possible to perform ultrahigh-depth targeted amplicon sequencing (by MiSeq), and all were successfully validated.
Extended Data Figure 10.
Signatures of early embryonic mutations.
a, The mutational spectrum for 163 early embryonic mutations is displayed according to the 96 substitution classes (defined by 6 substitution classes (C>A, C>G, C>T, T>A, T>C, T>G) and 16 sequence contexts (immediate 5` and 3` bases to the mutated pyrimidine bases; see Alexandrov et al., Nature (2013) for more details; ref. 7). The observed spectrum can be decomposed into two known mutational signatures (signatures #5 and #1), suggesting endogenous mutational processes are dominantly operative in early human embryogenesis (see Supplementary Discussion 6 for more details).
b, The methylation status of 28 C>T early embryonic mutations occurred at NpCpG sequence contexts. Methylation levels were obtained from Laurent et al., Genome Research (2010). The vast majority of the 28 loci were methylated, which is higher than background (right).
Supplementary Material
Acknowledgements
We thank Magdalena Zernicka-Goetz at Gurdon Institute, Kevin J. Dawson at Wellcome Trust Sanger Institute and Thomas Bleazard at University of Manchester for discussion and assistance with manuscript preparation. This work was supported by the Wellcome Trust (grant reference 077012/Z/05/Z). Y.S.J is supported by EMBO long-term fellowship (LTF 1203_2012), by KAIST (G04150052), and by a grant of the Korea Health Technology R&D project through the Korea Health Industry Development Institute (KHIDI) funded by the Ministry of Health & Welfare, Republic of Korea (HI16C2387). P.J.C. is a Wellcome Trust Senior Clinical Fellow. The ICGC Breast Cancer Consortium was supported by a grant from the European Union (BASIS) and the Wellcome Trust. For the family study, Generation Scotland received core support from the Chief Scientist Office of the Scottish Government Health Directorates (CZD/16/6) and the Scottish Funding Council (HR03006).
Footnotes
Author Contributions
M.R.S. designed and directed the project. Y.S.J. performed overall study with bioinformatics analyses for detection of early embryonic mutations. I.M. and M.G. performed statistical testing to confirm unequal contributions of early cells and early mutation rates. L.B.A. carried out mutational signature analyses. R.R. and M.E.H. designed and directed family studies. D.C.W., H.R.D., M.R., S.N.-Z. performed cancer genome analyses and provided conceptual advice. M.P., A.F., C.A., N.P., S.G., and S.O.’M carried out laboratory analyses. S.M. supported clinical data analysis and curation. D.D.G., T.S., S.E.P. performed pathology review for breast cancer tissues. C.A.P., A.B., H.S., M.v.d.V., B.K.T.T., C.C., A.T., N.T.U., L.J.v.V., J.W.M.M., C.S., S.K., P.N.S., S.R.L., J.E.E., A-L.B-D., A.R., A.M.T., A.V. provided clinical samples and commented on the manuscript. P.J.C. supervised overall analyses. Y.S.J., I.M., M.G., L.B.A. and M.R.S. wrote the paper.
Author Information
Whole-genome sequence data have been deposited in the European Genome-Phenome Archive (EGA; https://www.ebi.ac.uk/ega/home) under overarching accession number EGAS00001001178. Reprints and permissions information is available at www.nature.com/reprints.
The authors declare no competing financial interests.
Data availability
Whole-genome sequence data have been deposited in the European Genome-Phenome Archive (EGA; https://www.ebi.ac.uk/ega/home) under overarching accession number EGAS00001001178. The data that support the findings of this study are available on request from the corresponding author M.R.S. (mrs@sanger.ac.uk).
References
- 1.Samuels ME, Friedman JM. Genetic mosaics and the germ line lineage. Genes. 2015;6:216–237. doi: 10.3390/genes6020216. [DOI] [PMC free article] [PubMed] [Google Scholar]
- 2.Erickson RP. Recent advances in the study of somatic mosaicism and diseases other than cancer. Current opinion in genetics & development. 2014;26:73–78. doi: 10.1016/j.gde.2014.06.001. [DOI] [PubMed] [Google Scholar]
- 3.Laurie CC, et al. Detectable clonal mosaicism from birth to old age and its relationship to cancer. Nature genetics. 2012;44:642–650. doi: 10.1038/ng.2271. [DOI] [PMC free article] [PubMed] [Google Scholar]
- 4.Ruark E, et al. Mosaic PPM1D mutations are associated with predisposition to breast and ovarian cancer. Nature. 2013;493:406–410. doi: 10.1038/nature11725. [DOI] [PMC free article] [PubMed] [Google Scholar]
- 5.Behjati S, et al. Genome sequencing of normal cells reveals developmental lineages and mutational processes. Nature. 2014;513:422–425. doi: 10.1038/nature13448. [DOI] [PMC free article] [PubMed] [Google Scholar]
- 6.Vanneste E, et al. Chromosome instability is common in human cleavage-stage embryos. Nature medicine. 2009;15:577–583. doi: 10.1038/nm.1924. [DOI] [PubMed] [Google Scholar]
- 7.Alexandrov LB, et al. Signatures of mutational processes in human cancer. Nature. 2013;500:415–421. doi: 10.1038/nature12477. [DOI] [PMC free article] [PubMed] [Google Scholar]
- 8.Oron E, Ivanova N. Cell fate regulation in early mammalian development. Physical biology. 2012;9 doi: 10.1088/1478-3975/9/4/045002. 045002. [DOI] [PubMed] [Google Scholar]
- 9.Genovese G, et al. Clonal hematopoiesis and blood-cancer risk inferred from blood DNA sequence. The New England journal of medicine. 2014;371:2477–2487. doi: 10.1056/NEJMoa1409405. [DOI] [PMC free article] [PubMed] [Google Scholar]
- 10.Jaiswal S, et al. Age-related clonal hematopoiesis associated with adverse outcomes. The New England journal of medicine. 2014;371:2488–2498. doi: 10.1056/NEJMoa1408617. [DOI] [PMC free article] [PubMed] [Google Scholar]
- 11.Xie M, et al. Age-related mutations associated with clonal hematopoietic expansion and malignancies. Nature medicine. 2014;20:1472–1478. doi: 10.1038/nm.3733. [DOI] [PMC free article] [PubMed] [Google Scholar]
- 12.Bruce AW, Zernicka-Goetz M. Developmental control of the early mammalian embryo: competition among heterogeneous cells that biases cell fate. Current opinion in genetics & development. 2010;20:485–491. doi: 10.1016/j.gde.2010.05.006. [DOI] [PubMed] [Google Scholar]
- 13.Plusa B, et al. The first cleavage of the mouse zygote predicts the blastocyst axis. Nature. 2005;434:391–395. doi: 10.1038/nature03388. [DOI] [PubMed] [Google Scholar]
- 14.Zernicka-Goetz M, Morris SA, Bruce AW. Making a firm decision: multifaceted regulation of cell fate in the early mouse embryo. Nature reviews Genetics. 2009;10:467–477. doi: 10.1038/nrg2564. [DOI] [PubMed] [Google Scholar]
- 15.Plachta N, Bollenbach T, Pease S, Fraser SE, Pantazis P. Oct4 kinetics predict cell lineage patterning in the early mammalian embryo. Nature cell biology. 2011;13:117–123. doi: 10.1038/ncb2154. [DOI] [PubMed] [Google Scholar]
- 16.Bedzhov I, Graham SJ, Leung CY, Zernicka-Goetz M. Developmental plasticity, cell fate specification and morphogenesis in the early mouse embryo. Philosophical transactions of the Royal Society of London. Series B, Biological sciences. 2014;369 doi: 10.1098/rstb.2013.0538. [DOI] [PMC free article] [PubMed] [Google Scholar]
- 17.Morris SA, Guo Y, Zernicka-Goetz M. Developmental plasticity is bound by pluripotency and the Fgf and Wnt signaling pathways. Cell reports. 2012;2:756–765. doi: 10.1016/j.celrep.2012.08.029. [DOI] [PMC free article] [PubMed] [Google Scholar]
- 18.Hardy K, Handyside AH, Winston RM. The human blastocyst: cell number, death and allocation during late preimplantation development in vitro. Development. 1989;107:597–604. doi: 10.1242/dev.107.3.597. [DOI] [PubMed] [Google Scholar]
- 19.Strnad P, et al. Inverted light-sheet microscope for imaging mouse pre-implantation development. Nature methods. 2016;13:139–142. doi: 10.1038/nmeth.3690. [DOI] [PubMed] [Google Scholar]
- 20.Rahbari R, et al. Timing, rates and spectra of human germline mutation. Nature genetics. 2016;48:126–133. doi: 10.1038/ng.3469. [DOI] [PMC free article] [PubMed] [Google Scholar]
- 21.Acuna-Hidalgo R, et al. Post-zygotic Point Mutations Are an Underrecognized Source of De Novo Genomic Variation. American journal of human genetics. 2015 doi: 10.1016/j.ajhg.2015.05.008. [DOI] [PMC free article] [PubMed] [Google Scholar]
- 22.Huang AY, et al. Postzygotic single-nucleotide mosaicisms in whole-genome sequences of clinically unremarkable individuals. Cell research. 2014;24:1311–1327. doi: 10.1038/cr.2014.131. [DOI] [PMC free article] [PubMed] [Google Scholar]
- 23.Dal GM, et al. Early postzygotic mutations contribute to de novo variation in a healthy monozygotic twin pair. Journal of medical genetics. 2014;51:455–459. doi: 10.1136/jmedgenet-2013-102197. [DOI] [PubMed] [Google Scholar]
- 24.Lynch M. Rate, molecular spectrum, and consequences of human mutation. Proceedings of the National Academy of Sciences of the United States of America. 2010;107:961–968. doi: 10.1073/pnas.0912629107. [DOI] [PMC free article] [PubMed] [Google Scholar]
- 25.Martincorena I, Campbell PJ. Somatic mutation in cancer and normal cells. Science. 2015;349:1483–1489. doi: 10.1126/science.aab4082. [DOI] [PubMed] [Google Scholar]
- 26.Nik-Zainal S, et al. Landscape of somatic mutations in 560 breast cancer whole-genome sequences. Nature. 2016;534:47–54. doi: 10.1038/nature17676. [DOI] [PMC free article] [PubMed] [Google Scholar]
- 27.Li H, Durbin R. Fast and accurate long-read alignment with Burrows-Wheeler transform. Bioinformatics. 2010;26:589–595. doi: 10.1093/bioinformatics/btp698. [DOI] [PMC free article] [PubMed] [Google Scholar]
- 28.Stephens PJ, et al. The landscape of cancer genes and mutational processes in breast cancer. Nature. 2012;486:400–404. doi: 10.1038/nature11017. [DOI] [PMC free article] [PubMed] [Google Scholar]
- 29.Ju YS, et al. Origins and functional consequences of somatic mitochondrial DNA mutations in human cancer. eLife. 2014;3 doi: 10.7554/eLife.02935. [DOI] [PMC free article] [PubMed] [Google Scholar]
- 30.Koboldt DC, et al. VarScan 2: somatic mutation and copy number alteration discovery in cancer by exome sequencing. Genome research. 2012;22:568–576. doi: 10.1101/gr.129684.111. [DOI] [PMC free article] [PubMed] [Google Scholar]
- 31.Li H, et al. The Sequence Alignment/Map format and SAMtools. Bioinformatics. 2009;25:2078–2079. doi: 10.1093/bioinformatics/btp352. [DOI] [PMC free article] [PubMed] [Google Scholar]
- 32.Nik-Zainal S, et al. The life history of 21 breast cancers. Cell. 2012;149:994–1007. doi: 10.1016/j.cell.2012.04.023. [DOI] [PMC free article] [PubMed] [Google Scholar]
- 33.Van Loo P, et al. Allele-specific copy number analysis of tumors. Proceedings of the National Academy of Sciences of the United States of America. 2010;107:16910–16915. doi: 10.1073/pnas.1009843107. [DOI] [PMC free article] [PubMed] [Google Scholar]
- 34.Robinson JT, et al. Integrative genomics viewer. Nature biotechnology. 2011;29:24–26. doi: 10.1038/nbt.1754. [DOI] [PMC free article] [PubMed] [Google Scholar]
- 35.Skinner ME, Uzilov AV, Stein LD, Mungall CJ, Holmes IH. JBrowse: a next-generation genome browser. Genome research. 2009;19:1630–1638. doi: 10.1101/gr.094607.109. [DOI] [PMC free article] [PubMed] [Google Scholar]
- 36.Holstege H, et al. Somatic mutations found in the healthy blood compartment of a 115-yr-old woman demonstrate oligoclonal hematopoiesis. Genome research. 2014;24:733–742. doi: 10.1101/gr.162131.113. [DOI] [PMC free article] [PubMed] [Google Scholar]
- 37.Marikawa Y, Alarcon VB. Establishment of trophectoderm and inner cell mass lineages in the mouse embryo. Molecular reproduction and development. 2009;76:1019–1032. doi: 10.1002/mrd.21057. [DOI] [PMC free article] [PubMed] [Google Scholar]
Associated Data
This section collects any data citations, data availability statements, or supplementary materials included in this article.


