

Abstract
Despite the importance of duplicate genes for evolutionary adaptation, accurate gene annotation is often incomplete, incorrect, or lacking in regions of segmental duplication. We developed an approach combining long-read sequencing and hybridization capture to yield full-length transcript information and confidently distinguish between nearly identical genes/paralogs. We used biotinylated probes to enrich for full-length cDNA from duplicated regions, which were then amplified, size-fractionated, and sequenced using single-molecule, long-read sequencing technology, permitting us to distinguish between highly identical genes by virtue of multiple paralogous sequence variants. We examined 19 gene families as expressed in developing and adult human brain, selected for their high sequence identity (average >99%) and overlap with human-specific segmental duplications (SDs). We characterized the transcriptional differences between related paralogs to better understand the birth–death process of duplicate genes and particularly how the process leads to gene innovation. In 48% of the cases, we find that the expressed duplicates have changed substantially from their ancestral models due to novel sites of transcription initiation, splicing, and polyadenylation, as well as fusion transcripts that connect duplication-derived exons with neighboring genes. We detect unannotated open reading frames in genes currently annotated as pseudogenes, while relegating other duplicates to nonfunctional status. Our method significantly improves gene annotation, specifically defining full-length transcripts, isoforms, and open reading frames for new genes in highly identical SDs. The approach will be more broadly applicable to genes in structurally complex regions of other genomes where the duplication process creates novel genes important for adaptive traits.
Gene duplication is one of the primary forces by which novel genes evolve within species (Ohno 1970). Numerous studies have shown that recently duplicated sequences often provide the substrates for positive selection and the emergence of gene innovations important for species adaptation (Duda and Palumbi 1999; Chen et al. 2008; Charrier et al. 2012; Dennis et al. 2012; Yim et al. 2014; Florio et al. 2015; Ju et al. 2016). Among apes, for example, novel human-specific genes (e.g., SRGAP2C, ARHGAP11B, TBC1D3, and BOLA2B) have recently been identified and implicated in promoting progenitor cell proliferation, altering neuronal spine density, increasing excitatory/inhibitory synaptic density, and affecting iron homeostasis early in development (Dennis et al. 2012; Florio et al. 2015, 2016; Ju et al. 2016; Nuttle et al. 2016). Notably, the extent of the duplication with respect to the ancestral transcriptional unit appears to play an important role in determining the potential outcomes for duplicate genes (Fig. 1).
Figure 1.
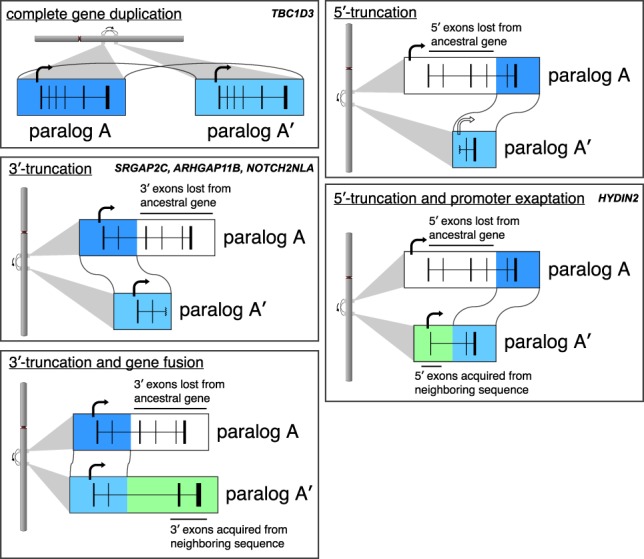
Possible transcriptional fates. For a complete gene duplication, a new copy is created that is most likely to maintain the isoform structure of the ancestor. Incomplete duplications result in only a portion of the ancestral gene being duplicated. This can lead to a truncated duplicate gene or a fusion transcript, where additional exons are acquired from flanking sequence. For 3′ truncations, transcription may persist until a polyadenylation signal or a new exon is encountered. For 5′ truncations, a promoter unlike that of the ancestral gene must be used if such duplicates are to be transcribed. Specific examples of known human-specific genes by type are indicated.
Duplicated genomic segments of high sequence identity (>90%; also known as segmental duplications [SDs]) pose particular challenges for gene annotation because (1) they are enriched in assembly gaps (Alkan et al. 2011), (2) they are more prone to copy number polymorphism among individuals of the same species (Sudmant et al. 2015), and (3) different paralogs are difficult to distinguish because of their high sequence identity. Standard short-read RNA-sequencing (RNA-seq) data are generally insufficient for characterizing high-identity duplicate genes, and as a result, these regions are typically excluded from large-scale RNA-seq expression analyses or disease association studies. For example, in a recent analysis by Lan and Pritchard (2016), ∼50% of all recent duplicate genes (ds < 0.1) were either filtered or deemed unassayable using short-read sequence data. Similarly, studies that attempt to identify recurrent de novo mutations associated with disease typically exclude such gene models as targets (Iossifov et al. 2014). This already difficult problem is made even harder in vertebrates, which display complex patterns of transcription initiation, alternative splicing, intron retention, and polyadenylation (Nilsen and Graveley 2010; Barbosa-Morais et al. 2012; Steijger et al. 2013).
Recent advances in long-read RNA-seq provide the possibility for full-length transcript sequencing obviating the need for transcript assembly. Even among the most recently duplicated regions, long reads would contain a sufficient number of paralogous sequence variants (PSVs) to be assigned to their respective paralogs with confidence. Long-read transcriptomics, thus, presents a simple solution, although low levels of expression may lead to some duplicate genes being missed by whole-transcriptome RNA-seq. To overcome these limitations, we develop a method that combines advances in long-read, full-length cDNA sequencing with target enrichment to study the transcription of highly identical duplicate genes. A similar approach was recently used to aid in the annotation of long noncoding RNAs (Lagarde et al. 2017). We target gene families that have expanded in the human genome following the evolutionary divergence from chimpanzee (∼6–7 Myr ago), since we hypothesize that their degree of sequence identity (>98.4%) would make them most susceptible to incomplete or incorrect annotation (Dennis et al. 2017). We use full-length reads from Pacific Biosciences (PacBio) long-read sequencing technology to generate ab initio transcript and gene annotations and then compare these models to current annotation standards (RefSeq [O'Leary et al. 2016] and GENCODE [Harrow et al. 2012]) to demonstrate improved annotation.
Results
Targeted capture and sequencing of duplicate gene transcripts
In order to study the transcription of recently duplicated genes, we sought an approach that met the following criteria: (1) Sequence reads would be sufficiently long to carry at least one distinguishing PSV; (2) data would originate from full-length cDNA molecules, representing complete transcripts; and (3) sequence reads would be sufficiently abundant to capture the diversity of major isoforms for any given duplicated locus. The first goal is largely met by application of PacBio sequencing technology. For the second, we employed a widely used strategy based on reverse transcriptase (RT) template switching, which enriches for full-length cDNA molecules (Zhu et al. 2001). Finally, to focus on duplicate genes, we designed a complementary oligonucleotide capture panel to enrich for cDNA originating from paralogous loci (Fig. 2A).
Figure 2.

Transcript capture and long-read sequencing for resolution of nearly identical duplicate genes. (A) Poly(A)+ RNA is converted to first-strand cDNA by reverse transcriptase (RT) using a specialized oligo(dT) primer containing the 3′ barcode (BC) and an outer sequence tag for later amplification. Template-independent cDNA synthesis extends the 3′ end of the cDNA with oligo-dC. RT extends the cDNA by pairing to a template switch oligo (TSO; SP6 sequence) with 3′ rG bases. Second-strand synthesis is carried out with DNA polymerase and a primer directed toward the SP6 sequence, containing the 5′ barcode and the other outer tag. After ssDNA depletion, the recovered ds-cDNA founder molecules are amplified before biotinylated probes designed to genes of interest are used for hybridization capture. A final PCR step on the target-enriched cDNA generates double-stranded molecules for long-read sequencing. (B) As part of a modified Iso-Seq workflow, sequences are first error-corrected through circular consensus sequence (CCS) generation. Then for each read, the sequences flanking the transcripts are identified and trimmed. If such sequences are present on both ends, reads are designated as putative full-length (pFL). pFL reads are mapped to the human reference (GRCh38), where the presence of multiple PSVs along the long read promotes accurate mapping even in the presence of sequencing errors. To avoid confounding paralogs, confidently mapped reads (MAPQ > 40) are partitioned into genomic segments before the Iso-Seq cluster step is performed.
We selected gene families found within and near human-specific duplications (HSDs) (Dennis et al. 2017) as targets for probe design (Supplemental Table S1). We generated two panels of targeting probes: HSD1 (515 probes) (Supplemental Table S2A), representing duplicate loci where there was no evidence of gene disruption (Dennis et al. 2017), and HSD2 (271 probes) (Supplemental Table S2B), representing duplicate loci likely to be polymorphic and enriched for pseudogenes as well as eight single-copy loci to serve as controls. Probes were designed to exonic sequence within the duplicated portion of the ancestral gene. We used RNA derived from both developing and adult whole brain (pooled from multiple individuals) for cDNA synthesis because previously described HSDs are enriched for roles in the structure and function of the brain (Fortna et al. 2004; Sudmant et al. 2010). We monitored chimeric molecule formation during PCR by implementing a dual barcoding strategy (Fig. 2A) in which one of 96 barcodes is appended during first-strand cDNA synthesis to the 3′ end of the molecule, and same barcode is appended during second-strand synthesis to the 5′ end of the molecule (for sequence composition, see Supplemental Table S3). This “barcode concordant” mode allows us to detect chimeric molecules by the presence of discordant barcodes on the ends of a single cDNA read (Supplemental Fig. S1A), and we estimate the frequency of chimeric molecules identified by mismatched barcodes to be ∼1.2% (Supplemental Fig. S1C). We also tested a “barcode discordant” mode, where the relationship between the 5′ and 3′ barcode is random, in which the pairing of barcodes (96 × 96 arrangements) can be used as a pseudo-unique molecular identifier to monitor for PCR duplicates in low-complexity libraries (Supplemental Fig. S1B). Additionally, we performed post-capture size selection of libraries using electrophoresis-based fractionation (SageELF; see Methods) to enrich for larger cDNA.
By using our method, we sequenced 40 total SMRT cells, including unenriched whole-transcriptome controls (n = 4), HSD1-enriched cDNA (n = 30), and HSD2-enriched cDNA (n = 6) on the PacBio RS II sequencing platform (Supplemental Table S4). In circular consensus sequence (CCS) generation, multiple passes of the polymerase around a covalently closed sequencing molecule are used for consensus-based correction (Fig. 2B). In total, 1.4 million CCS reads were generated, divided between developing and adult brain cDNA sources (Supplemental Table S5). As expected, longer CCS reads show lower read accuracy due to fewer full passes of the sequencing polymerase (Supplemental Fig. S2). Because the primary error modality in PacBio sequencing involves indels, these errors are unlikely to be mistaken as PSVs and, as such, do not significantly interfere with paralog assignability. Of the CCS reads generated for our HSD1 panel, 82% (adult brain) and 77% (developing brain) were designated by the PacBio Iso-Seq analysis pipeline as full-length due to the presence of the expected barcode, primer sequence, and poly(A) tail. Since some of these do not represent truly full-length isoforms due to possible 5′ RNA degradation, we refer to them as putative full-length (pFL) reads. pFL reads mapped to the human reference genome (GRCh38) using GMAP (v 2015-07-23) (Wu and Watanabe 2005) were used for further analysis (Fig. 2B).
Mapping of these pFL reads revealed an on-target rate of 65% (adult brain) and 62% (developing brain) in HSD1-enriched cDNA with an estimated enrichment of more than 250-fold (Supplemental Table S5). Similar results were achieved for the second probe panel, HSD2. Out of the original set of 39 duplicate gene families screened, we focused on 19 for a more detailed analysis, including SRGAP2, NOTCH2, ARHGEF5, ARHGAP11A, PTPN20, FRMPD2, CHRNA7, GTF2I, GTF2IRD2, ROCK1, CORO1, HYDIN, FAM72A, SLX1A, GPR89A, FCGR1A, NFC1, CD8B, and BOLA2 (Supplemental Table S6).
Classification of duplication events
We initially classified each HSD as complete or incomplete depending on whether the SD event in the genome carries the entire transcriptional unit of the ancestral gene or a merely a truncated portion (Fig. 3A; see also Fig. 1). Of the 19 gene families (or 12 nonancestral paralogs), eight are “complete,” and these tend to be those with smaller ancestral genes. We further classify the incomplete HSD gene families (n = 12, 19 nonancestral paralogs) by what portion of the gene body is truncated relative to the ancestral gene. We categorize duplicates as 3′ truncations and 5′ truncations. 3′-Truncated paralogs retain ancestral transcription start site (TSS) but lack some downstream exons (e.g., SRGAP2C [Charrier et al. 2012; Dennis et al. 2012] and ARHGAP11B [Florio et al. 2015, 2016]), while 5′-truncated paralogs have lost upstream exons and their ancestral promoter (e.g., CHRFAM7A [Gault et al. 1998]).
Figure 3.

Transcriptional fates of human-specific duplicate genes and expression correlation between ancestral and duplicate gene copies. (A) We classify 19 gene families (31 duplicate paralogs in GRCh38) by the transcriptional characteristics of the duplicate genes. In eight of 19 gene families and 12 of 31 paralogs, the duplication includes the complete gene (with respect to the canonical isoform). More common are incomplete gene duplications, of which five of 12 gene families and 11 of 19 paralogs are 3′ truncated (whereby the ancestral promoter is maintained in the duplicate gene), while six of 12 gene families and seven of 19 paralogs are 5′ truncated (whereby the ancestral promoter is lost). The outcomes of such truncated duplications can be simply shortened versions of the ancestral gene (“truncation”) or transcript fusion with adjacent sequence (“fusion”), and often both are observed. For 5′ truncations, we also observe the phenomenon of exaptation of upstream exons and regulatory elements, which provide a new promoter for what would presumably be otherwise transcriptionally silent genes (two of 19 gene families). Note that duplicates of GTF2IRD2 are classified as both complete and incomplete. (B) We estimated expression similarity between ancestral and duplicate copies by calculating the pairwise correlation of the median expression levels across GTEx tissues. Duplicate genes whose promoters were included in the human-specific SD show expression patterns that are more similar to their ancestors than those that acquire it from new sequence.
We took advantage of the full-length cDNA sequences to classify the consequences of the SD with respect to transcript or isoform structure of the duplicate genes. Truncated transcripts are simply shortened versions of the ancestral transcript, while fusion transcripts are linked to upstream or downstream sequence through splicing to a gene segment homologous to another annotated gene. By this metric, recently duplicated genes show a range of transcript models. Based on counts of pFL reads, we classified truncated genes as predominantly truncated (<20% pFL reads belonging to this gene demonstrate bridging transcription), predominantly fusion (>80% pFL reads demonstrate bridging transcription), or both (Fig. 3A; see also Supplemental Table S7). We distinguished exaptation events (inclusion of a novel exon or promoter) from gene fusions when bridging exons are themselves not known homologs to any other gene. In this study, promoter exaptation rescues the transcriptional activity of two 5′-truncated genes, ROCK1P1 and HYDIN2, the latter confirming earlier observations (Dougherty et al. 2017). Only two of the 5′-truncated gene duplications examined (GTF2IRD2P1 and CORO1AP) have lost expression in brain as a consequence of promoter loss; thus, of the 31 duplicate paralogs analyzed, 29 retain expression.
Excluding minor (<2% of isoforms) products for each duplicate gene, we finally characterized the protein-coding potential of sequenced duplicate gene isoforms. Overall, among the 29 expressed duplicate paralogs, the integrity of the duplicated portion of the open reading frame (ORF) has been compromised in 17 (59%), by either acquired frameshift mutations, changes in splicing, or multiple events. The 12 duplicate genes with “intact” ORFs include SRGAP2C, NOTCH2NLD, ARHGEF35, FRMPD2B, FAM72B, FAM72C, FAM72D, SLX1B, GTF2IRD2B, GPR89B, CD8BP, and BOLA2B. The relationship between ORF length, integrity, and gene function is a complex one as ORF-disrupting mutations may in some cases confer critical functional activity (Florio et al. 2016).
Frequent transcript fusions observed in 3′-truncated HSD genes
Approximately, one-third of the duplicate paralogs are 3′ truncations of the ancestral gene, and all show evidence of transcription (Fig. 3A). Included in this set are gene innovations (e.g., SRGAP2C, ARHGAP11B) recently implicated in cortical expansion and increased dendrite density of the human brain (Charrier et al. 2012; Dennis et al. 2012; Florio et al. 2015, 2016). Since such duplicates retain the 5′-proximal regulatory sequence of the ancestral locus, the pattern of expression, as expected, is highly correlated with that of the ancestral gene (Fig. 3B). We find that “fusion” transcripts are common, linking the duplicate gene segment with exons from downstream sequence, though they rarely alter the ORF. In some cases, these fusion transcripts represent major isoforms. The relative abundance varies by gene family and paralog (Supplemental Table S7). For example, SRGAP2C transcripts are predominantly truncations (5% fusion), while for SRGAP2B the proportion of fusions increases (14%). Among NOTCH2NL paralogs, the proportion of fusion transcripts ranges widely from 16% to 49%, exclusively with adjacent members of the NBPF gene family, in which copy number variation has been associated with cranial size (Dumas et al. 2012). Only a small fraction (<2%) of such NBPF fusions, however, maintain an ORF.
ARHGAP11B has been implicated in basal progenitor amplification and neocortical expansion (Florio et al. 2015, 2016). The key isoform studied by Florio et al. (2015, 2016) is a truncated form of the ancestral locus, ARHGAP11A, with a short, modified C terminus due to an acquired splice-site mutation (Fig. 4A). While we observe this specific ARHGAP11B isoform (“ARHGAP11_6”), we also observe prominent longer isoforms that initiate at the same shared ancestral promoter but differ dramatically in their downstream exons (Fig. 4B). Continuing beyond the annotated polyadenylation site, these longer isoforms extend downstream into other SDs, including duplications of ULK4 (isoform “ARHGAP11B_5”) and OTUD7A (isoform “ARHGAP11B_3”). Expression estimates that include these new isoforms of ARHGAP11B suggest greater abundance in adult brain tissues (Fig. 4C). We designed probes that would detect expression in aggregate (AB), of ARHGAP11A specifically (A), and of the newly discovered longest isoform of ARHGAP11B (B) and performed in situ hybridization on developing human brain (Fig. 4D). We find that the longer isoform is expressed specifically along the ventricle where radial glia undergo mitosis. The staining is not as strong with probe B as with probe AB, indicating that this isoform is not exclusively responsible for ARHGAP11B expression in these cells. However, it can be said that with current annotations alone, the picture of ARHGAP11B activity in these key neural progenitor cells is incomplete.
Figure 4.

Identification of a longer fusion isoform of ARHGAP11B expressed in dividing radial glia. (A) Partial duplication (duplicated sequence represented by blue shading) of ARHGAP11A resulted in ARHGAP11B. (B) We identified three isoforms of ARHGAP11B based on full-length transcript sequencing, and these are shown in the context of SDs. The “long” isoform (ARHGAP11B_3) extends deeply into adjacent duplications; a “medium” isoform (ARHGAP11B_5) has four additional exons beyond the duplication shared with ARHGAP11A; and a “short” isoform (AHRGAP11B_6) consists entirely of sequence shared with ARHGAP11A. Note that all three isoforms share the same ORF, and fused exons are predicted to be noncoding. (C) Expression estimates based on short-read RNA-seq data for the three isoforms in select tissues support the prominence of the long isoform but limited evidence for expression of the short isoform. (D) In situ hybridization performed on sections of developing cortical brain (gestational week 18) indicates expression in cells along the ventricle of the ventricular zone (VZ; arrowheads, magnified inset), where radial glia undergo mitosis, consistent with long form of ARHGAP11B expressed specific to dividing ventricular radial glia but missing from outer radial glia. Probe targets are shown in panel A. Probe B is not predicted to hybridize to the ancestral OTUD7A gene (Methods).
Promoter loss and retention contribute to duplicate gene expression patterns
We also find evidence of transcription for the majority (five of seven paralogs) of HSDs associated with 5′ truncations (Fig. 3A). Since the TSS was lost during the duplication, transcription necessitates the acquisition of a novel TSS. Similar to the 3′-truncated HSDs, some duplicates encode primarily truncated transcripts, their TSS derived from an internal promoter (e.g., FRMPD2) while others represent fusion events, deriving their TSS from new upstream sequence. The latter is the case for the partial duplicates of GTF2I (GTF2IP1 and GTF2IP4) whose promoter and first exon originate from a duplication of the adjacent GATSL2.
ROCK1P1 is derived from the four terminal exons and a portion of the fifth exon of the 33-exon serine/threonine kinase, ROCK1, which duplicated to the telomeric end of Chromosome 18, adjacent to a 5-kbp satellite repeat from which the TSS was acquired (Supplemental Fig. S3). Our capture-based sequencing approach identifies two predominant TSSs (TSS 1 and TSS 2) from the adjacent upstream sequence, which we refer to as the “promoter block” (Supplemental Fig. S3). This promoter block is primarily composed of beta and LSAU satellite repeat sequence; TSS 1 maps within a beta satellite repeat ∼900 bp upstream of the ROCK1 duplication break point, and TSS 2, which contains the microRNA MIR8078, is found ∼200 bp upstream of the LSAU3 breakpoint. TSS 2, however, provides an alternate first exon, with a novel translation initiation codon and a potential short ORF of 216 amino acids (158 shared with ROCK1). Based on Genotype-Tissue Expression (GTEx) data, we estimate that highest expression of ROCK1P1 is in the testis, consistent with the tissue expression of MIR8078 (NR_107045.1, miRBase (Kozomara and Griffiths-Jones 2011; Meunier et al. 2013).
We hypothesized that this may indicate a general trend, that when a new promoter is acquired by a 5′-truncated duplication, it would direct the expression of the new gene fusion, as was observed in HYDIN2 (Dougherty et al. 2017). We divided the duplicate genes into three categories based on the nature of the duplication: truncated with a different promoter (i.e., loss of ancestral TSS), truncated with the same promoter (usually loss of the ancestral polyadenylation site), and whole-gene duplication. We then measured the median expression level of the duplicate gene and ancestral gene in available tissues from GTEx and measured the correlation as a proxy for preservation of expression pattern (Fig. 3B). We find that when the duplicate gene maintains the same promoter, the expression correlation coefficient is almost always quite high, while when a new promoter is acquired, expression correlation is variable.
A notable exception to this rule is the case of CD8B and its human-specific duplicate CD8B2, which includes the ancestral promoter but has a markedly different derived expression (Fig. 3B). Together with CD8A, CD8B forms a heterodimer that serves as a coreceptor for the T-cell receptor and is the defining marker of CD8+ T cells, which respond to intracellular antigens such as those found in virally infected or cancerous cells. CD8B2 is the consequence of a whole-gene duplication (with respect to the major isoform) across the centromere of Chromosome 2 (Fig. 5A). Despite its pseudogene annotation, we find that the 210 amino acid ORF of CD8B is maintained in CD8B2 with four substitutions (Fig. 5B). However, similarity in expression between the paralogs is among the lowest in the pairwise comparisons we measured (P = 0.10 for correlation across tissues). The most dramatic tissue-specific changes include a near total loss of expressed CD8B2 in whole blood and a substantial gain in brain tissues, including the cortex (Fig. 5C). We confirmed that this loss of expression can be attributed specifically to T cells by examining single-cell RNA-seq from 4538 T cells derived from a healthy donor generated using the 10x Genomics platform (data obtained from https://support.10xgenomics.com/single-cell/datasets/t_4k), which generates sequence reads from the 3′ end of the transcript (Fig. 5D). While most reads map equally to both paralogs, when strict mapping criteria (MAPQ > 40) are applied, 99.9% of reads map preferentially to the 3′ untranslated region (UTR) of CD8B, confirming that CD8BP is not expressed in circulating T cells. Therefore, it is unlikely that CD8B2 expression defines a subtype of T cells, but rather it is expressed in entirely different cell types.
Figure 5.

Tissue-specific loss and gain of expression in CD8B2 and maintenance of ancestral open-reading frame (ORF). (A) CD8B was duplicated in full (canonical isoform) from the p-arm to the q-arm of Chromosome 2, generating CD8B2. (B) We identify expressed transcripts from CD8BP that resemble those of CD8B and maintain the 210 aa ORF but with four amino acid replacements. (C) Tissue-specific expression estimates generated using Kallisto and GTEx RNA-seq data indicate that, relative to CD8B, CD8B2 has almost entirely lost expression in blood and gained expression in brain (cortex). Transcripts per million (tpm) plotted with log scale. (D) Single-cell RNA-seq data from T cells (10x Genomics) supports that CD8B2 expression has been lost specifically in T cells likely due to the duplication excluding a tissue-specific enhancer (see text). While multimap RNA-seq reads map to both paralogs because they lack singly unique nucleotides (SUNs) that distinguish the two, uniquely mapping reads from T cells map exclusively to ancestral CD8B.
We hypothesize that the loss of cis-regulatory elements at the ancestral locus may be partly responsible for the expression change. An array of enhancers has been defined in the ∼100-kbp region that includes CD8B and its partner CD8A (Kieffer et al. 1997, 2002), and a complex combinatorial relationship between these enhancers is thought to direct cell type and stage-appropriate expression (Kioussis and Ellmeier 2002). However, only two of the six enhancers are included in the extent of the duplication, and as such, the loss of the four defined enhancers as well as other elements may be responsible. This is also one of the least copy number variable duplicate sequences in the human population—a property that appears to associate with functional duplicate copies (Dennis et al. 2017).
Splicing as an indicator of selection acting on duplicate genes
Full-length isoform characterization accompanied by expression analysis facilitates identification of shifts in the predominant isoforms between duplicate paralogs. We observed major differences in splicing for three gene families: ARGHAP11A, SRGAP2, and FCGR1A. For example, in contrast to the highly uniform splicing of SRGAP2C, we identify two major isoforms of SRGAP2B. The more common isoform includes a 61-bp exon not observed among the other paralogs, leading to premature truncation of the otherwise highly homologous ORF (Fig. 6A). The splice donor of this exon, SRGAP2B, contains two distinguishing nucleotide variants, most importantly an A-to-G transition at the −1 position with respect to the 5′ splice site (Fig. 6B). These SRGAP2B mutations increase the strength of this cryptic splice donor (MaxENT score 0.24 SRGAP2C, 8.73 SRGAP2B) (Yeo and Burge 2004), making the ORF-truncating transcript the predominant form. Counts of intron-spanning reads from short-read RNA-seq data from the human brain (cortex, GTEx) (The GTEx Consortium 2013) corroborates that this frameshifting exon is a feature unique to SRGAP2B (Fig. 6C), and transcript-wide expression estimates concur (Fig. 6D). This difference helps explain why SRGAP2B is copy number polymorphic, why this particular paralog's transcript is subject to nonsense-mediated decay, and why SRGAP2C ultimately replaced the older duplicate SRGAP2B as the functional and fixed copy in the human species (Dennis et al. 2012).
Figure 6.

Inclusion of a 61-bp exon and premature stop codon in SRGAP2B. (A) SRGAP2B and SRGAP2C are duplicate copies of SRGAP2, created by an initial 3′-truncated duplication ∼3 Myr ago. From the long-read capture data, we identify a major isoform (here SRGAP2B_2) containing an additional 61-bp exon (arrow). (B) Alignment of the 61-bp exon (highlighted in light blue) and flanking sequence identifies a key nucleotide change in the −1 position of the splice donor (highlighted in red). This A-to-G transition is predicted to substantially increase the strength of the splice donor signal. (C) Intron-spanning reads from GTEx RNA-seq data from brain (cortex) were counted for each paralog if they were consistent with the canonical exon 2–3 junction (above), or consistent with the extra 61-bp exon (below), with counts for SRGAP2 (red), SRGAP2B (green), and SRGAP2C (blue) shown. Boldface denotes uniquely mapping reads. The additional exon is frequently included in SRGAP2B transcripts, while rarely included if at all in SRGAP2A and SRGAP2C. (D) Expression estimates for isoforms shown in A generated using Kallisto and GTEx RNA-seq data corroborate that the isoform of SRGAP2B that includes the 61-bp exon is the predominant one in neural tissues. These subsequent mutational changes likely nonfunctionalized SRGAP2B and are consistent with the fixation of the granddaughter duplicate SRGAP2C in the human population.
Similarly, splicing patterns differ between FCGR1A and FCGR1B, despite their shared 99.0% nucleotide identity at the genomic level (Supplemental Fig. S4A). Most of this difference involves the penultimate exon, which is constitutive in FCGR1A, but a cassette exon of varying length in FCGR1B, likely a result of a 4-bp deletion at the splice donor site. By using Shannon's entropy of normalized isoform abundance as a metric of increased isoform diversity (Ritchie et al. 2008), we find that entropy for FCGR1B (3.81 bits) is much higher than that of FCGR1A (1.92 bits; P = 1.3 × 10⁻⁷, Kolmogorov-Smirnov test). For example, ∼80% of sequence reads come from two major isoforms of FCRG1A, in contrast to FCRG1B, where 80% of sequence reads are distributed among 12 isoforms (Supplemental Fig. S4B). While in some cases (e.g., FCGR1B, SRGAP2B) disruptive splicing mutations appear to be associated with relaxed selection, in others such as ARHGAP11B, they are thought to be the key mutational event for neofunctionalization of the duplicate (Florio et al. 2016).
Exon exaptation and novel gene annotations
Our analysis of the GTF2IRD2 gene family, associated with Williams-Beuren syndrome (Fig. 7A), identifies two novel isoforms. The first is an out-of-frame fusion with STAG3L2, a high-copy pseudogene upstream of GTF2IRD2 that we estimate accounts for 33% of GTF2IRD2 transcripts in brain. The second novel isoform contains a distinct first exon that is derived from the DNA-binding domain of the Tigger7 DNA transposon and adds 162 N-terminal amino acids (Fig. 7B). Comparative sequence analysis shows that this novel N-terminus has been conserved throughout primate evolution and has been subjected to purifying selection (dN/dS = 0.019, P < 0.01) (Fig. 7C). A similar phenomenon can be observed in the ancestral GTF2I, although inclusion of the Tigger7 repeat is associated with a much less abundant isoform (Fig. 7D; Supplemental Table S8). Taken together, this analysis provides strong evidence that the human-specific gene GTF2IRD2 (as well as GTF2IRD2B and GTF2I) has a currently unannotated isoform that encodes a protein with a distinct N-terminal domain derived from Tigger7, of the TcMar-Tigger DNA transposon family of repeats, and that this protein-coding sequence is under significant purifying selection throughout the primate phylogeny.
Figure 7.

Discovery of novel N-terminal segment DNA-binding domains for GTF2IRD2 and GTF2I. (A) Two classes of novel isoforms were identified for the human-specific duplicate gene GTF2IRD2 (transcribed from right to left in this view), shown above the current NCBI gene annotations. The upper isoform consists of an out-of-frame gene fusion to upstream gene STAG3L2 while the lower isoform includes an alternative first exon, derived from a DNA transposon (TcMar-Tigger family), yielding a new N-terminal segment. (B) The proposed GTF2IRD2 isoform contains two additional N-terminal DNA-binding domains (helix-turn-helix domain and a Tc5 transposase DNA-binding domain) derived from the DNA transposon Tigger7. (C) A multiple sequence alignment of the newly identified N-terminus predicted protein sequences shows conservation among primates. (D) A heatmap of expression levels estimated using Kallisto across tissues (GTEx) shows that the canonical form is more broadly expressed than the transposon-containing isoform with the exception of the testis.
CHRFAM7A is a human-specific fusion gene that has been associated with neuropsychiatric disease (Flomen et al. 2006; Casey et al. 2012; Rozycka et al. 2013) and is thought to interact in a dominant-negative fashion with the normally homopentameric CHRNA7 to decrease its efficiency as an ion channel (Araud et al. 2011). Current annotations have the longest ORF spanning the boundary between CHRNA7 and FAM7A duplications; however, this is disrupted by a 2-bp polymorphism common in European populations (Supplemental Fig. S5). All current models of CHRFAM7A have a shortened ORF that initiates at this exon but also contain multiple upstream exons, which results in either a multiexon 5′ UTR or a complicated annotation with shorter upstream ORFs. We identify a new isoform of CHRFAM7A where transcription is initiated at this exon and, as a result, would place the 2-bp deletion polymorphism within a short 5′ UTR. This isoform appears more likely to result in a translated product capable of interacting with the ancestral CHRNA7.
Discussion
We have developed a capture-based approach to target the duplicated regions of genomes and enrich for the recovery and sequencing of full-length transcripts for genes associated with the evolution of novel genes important for species adaptations (Yim et al. 2014; Sulak et al. 2016) but where gene annotation is frequently in error (Church et al. 2009; Sudmant et al. 2010; Dennis et al. 2012; Li et al. 2015). This approach confirmed previously identified isoforms of BOLA2 and HYDIN that were characterized by RT-PCR and RACE strategies. An important finding of our study of HSDs is that most of the duplicates are transcriptionally active despite the fact that only portions of the ancestral genes are duplicated. In our study, 94% (29/31) of HSD paralogs show evidence of transcription even though 30 of these genes are incomplete (Fig. 3) with respect to ancestral structure. This is especially surprising for 5′ truncations where the promoter has been lost as part of the duplication event. Of seven such events, five showed evidence of transcription, although these events were more likely to show differential expression patterns when compared with 3′ truncations, which showed similar spatial temporal expression patterns to the ancestral gene. Overall, 18% (3/17) of the HSD genes show diverged patterns of expression, and such rapid changes in expression patterns might be expected for SDs when compared to whole-genome duplication events. Studies of a recent whole-genome duplication in the common carp (Li et al. 2015), for example, indicate that 92.5% of the genes show some evidence of coexpression.
Expression dissociation between paralogs is sometimes taken as evidence of neofunctionalization or subfunctionalization (Lan and Pritchard 2016). Our data suggest, however, that expression dissociation can occur much more rapidly because of two SD properties: the first, that HSDs are most likely to be incomplete (i.e., truncated with respect to the ancestral gene model); second, such duplications are interspersed, preferentially duplicated to regions enriched for other incomplete duplications (Dennis et al. 2017). As a result, HSDs are likely to be juxtaposed beside other incomplete duplications providing the raw material for regulatory (e.g., CD8B2) and exonic exaptations that quickly alter the transcript model and the expression profile of the new duplicate without the need for purifying selection (Hahn 2009). In other cases, such as the GTF2IRD/GTF2I gene family, which has been associated with hypersociability in both humans and dogs (vonHoldt et al. 2017), we have identified entirely novel protein-encoding DNA-binding domains derived from an ancient DNA transposon.
In 48% (16/33) of HSD paralogs, the gene models have changed more substantially from the ancestral gene as a result of 5′ extensions, 3′ extensions, and transcript fusions (Supplemental Note). Among HSDs, partial gene duplication is the predominant mode, and there is evidence that such transcripts have the potential to encode truncated proteins that, lacking protein domains, function differently than their ancestor. This is the model for the human-specific duplicate genes CHRFAM7A (Araud et al. 2011), SRGAP2C (Charrier et al. 2012), and ARHGAP11B (Florio et al. 2016)—the latter two are fixed for copy number and associated within neuronal spine maturation and cortical neuron expansion, respectively. In the case of SRGAP2C and CHRFAM7A, the truncated duplicate acts antagonistically, inhibiting the function of the ancestral protein, and, thus, by definition may have been partially functional at birth acting in a dominant-negative manner. However, for both SRGAP2C and ARHGAP11B, additional mutations occurred subsequent to the duplication event—missense changes in the case of SRGAP2C (Sporny et al. 2017) and a splice-site mutation in ARHGAP11B (Florio et al. 2016)—that apparently refined (e.g., SRGAP2C) or even activated a new function (e.g., ARHGAP11B). These differences are confirmed in the full-length transcripts that were generated, although our analysis predicts additional novel isoforms whose functions have not yet been investigated.
A key difference from previous studies on gene duplications is our focus on the most recent events and therefore the most identical duplications. The majority of duplicate genes are thought to become nonfunctional, with an estimated half-life of 4 Myr (Lynch and Conery 2000, 2003), older than most HSDs (Dennis et al. 2017). Therefore, the duplication events that are the focus of this study include genes that are transient, neutral, or near-neutral sequence ultimately destined to be lost in the absence of selective pressure. Our results suggest that changes in the exon–intron structure are common and are among some the earliest events that occur during the birth–death process, likely orthogonal to the action of selection (Hahn 2009). Thus, transcriptional divergence from the ancestral gene appears to be the most common fate, and this occurs soon after or even at the time of the duplication event itself. We hypothesize such rapid changes in the gene structure and transcriptional landscape facilitate the emergence of new function. In the case of humans, a small number of these duplicates appear to be undergoing the first step of a multistage process where the duplicates subsequently fix in copy number (Dennis et al. 2017) and maintain an altered ORF, ultimately leading to neofunctionalization and subfunctionalization events. Among these, are novel genes thought to be important in neuroadaptive traits critical for the development of the human species (Charrier et al. 2012; Dennis et al. 2012; Florio et al. 2015, 2016).
Methods
Probe design
Biotinylated oligonucleotide probes (for sequence, see Supplemental Table S2) were designed preferentially to constitutive exons and coding sequence within the duplicated portion of ancestral genes as well as putative exons where annotation was absent or questionable. Repeat-masked sequence was avoided. Because of the high homology between paralogs, probes designed to exons of the ancestral gene were presumed to hybridize successfully to the duplicated gene as well. Probes were synthesized on the sense strand, resulting in 515 total probes for the HSD1 panel and 271 for the HSD2 panel.
cDNA synthesis, library preparation, enrichment, and sequencing
Double-stranded cDNA was synthesized by a modified version of the standard Iso-Seq template preparation protocol (https://www.pacb.com/wp-content/uploads/Procedure-Checklist-Isoform-Sequencing-Iso-Seq-Analysis-using-the-Clontech-SMARTer-PCR-cDNA-Synthesis-Kit-and-SageELF-Size-Selection-System.pdf) that incorporates a barcode/molecular identifier at the end of each strand to facilitate deconvolution of PCR duplicate sequences versus unique founder molecules (for details of cDNA synthesis oligonucleotides, see Supplemental Note). Poly(A) RNA (20 ng) from pooled human adult brain (Clontech catalog no. 636102) or developing brain (Clontech catalog no. 636106) was reverse-transcribed in a 10 µL reaction containing 50 mM Tris-HCl (pH 8.3 at 25°C), 75 mM KCl, 3 mM MgCl2, 10 mM DTT, 0.5 mM dNTPs, 100 U of Maxima RNase H− RT (Thermo Fisher Scientific), 5 µM SP6 template switch oligo, and 10 pmol barcoded oligo-dT primer. For experiments with concordant primers, a single barcoded primer was used for each of 96 parallel reactions. For experiments with discordant primers (a form of molecular indexing), an equimolar mix of all 96 barcodes was used. Reactions were incubated as follows: 1 h at 45°C , 30 min at 55°C, 30 min at 45°C, and 5 min at 85°C.
After the heat kill step, the first-strand cDNA was purified by precipitation on magnetic beads (1× AMPure PB; PacBio). The recovered material was subsequently carried into a 50 µL second-stranding reaction in 1× Takara LA Taq HS buffer (Clontech), 200 µM dNTPs, 2.5 U of Takara LA Taq HS (Clontech), and 0.5 µM of barcoded SP6 second-stranding oligo. This oligo binds at the 3′ ends of the first-strand cDNA at the SP6 sequence added from the template switch. For experiments with concordant primers, a single barcoded primer was used for each of 96 parallel reactions. For experiments with discordant primers (a form of molecular indexing), an equimolar mix of all 96 barcodes was used. The second-stranding reactions were incubated as follows: 1 min at 95°C, 10 min at 65°C.
The second-stranding reaction was immediately stopped by depletion of primers by Exonuclease I (NEB; 10U) and dNTPs by alkaline phosphatase (rSAP: NEB; 1U) for 20 min at 37°C. The double-stranded cDNA (“founder molecules”) were purified by precipitation on magnetic beads (0.5× AMPure PB; PacBio). Double-stranded cDNA (20% of founder molecule reaction) was amplified by a 100 µL PCR reaction in 1× Takara LA Taq HS buffer (Clontech), 250 µM dNTPs, 5 U of Takara LA Taq HS (Clontech), and 0.5 µM of the PCR primer. Reactions were incubated as follows: 1 min at 95°C, 30 sec at 95°C, 30 sec at 68°C for 30 sec, 10 min at 72°C, 10 min at 72°C for 10 min, with the underlined steps for 12 cycles.
Amplified double-stranded cDNA was purified by precipitation on magnetic beads (0.4–0.6× AMPure PB; PacBio). In some cases, the cDNA was size-fractionated by an automated gel electrophoresis and recovery instrument (SageELF, Sage Sciences). Size fractions were then assayed on a Bioanalyzer high sensitivity chip and amplified in batches (∼1–2, 2–3, 3–4, 4–6 kbp) with the same conditions as the prior PCR; 1- to 3-kbp fractions were run through five cycles, while larger fractions required eight to 10 cycles.
Custom blocker oligonucleotides were synthesized (xGen blockers; Integrated DNA Technologies [IDT]) to match the first- and second-strand oligonucleotides with 16 deoxyinosines in place of the barcodes. Enrichment was carried out on various size fractions (1 µg each) using the hybridization and wash reagents (xGen lockdown reagents; IDT) according to manufacturer instructions (https://www.pacb.com/wp-content/uploads/Unsupported-Protocol-Full-length-cDNA-Target-Sequence-Capture-Using-IDT-xGen-Lockdown-Probes.pdf). The final step involves resuspending the streptavidin beads holding the immobilized enriched sample in PCR conditions (same PCR primer as prior; Kapa HiFi Hot Start polymerase/buffer). PCR was carried out according to xGen Lockdown instructions but with longer extension time of 5 min. Amplification reactions were purified by precipitations on magnetic beads (0.5× AMPure PB, PacBio) and assayed both by fluorometer (Qubit, Thermo Fisher) for dsDNA concentration and Bioanalyzer (DNA12000 chip, Agilent) for size.
Final cDNA was purified by precipitation on magnetic beads (0.5× AMPure PB; PacBio), and single-molecule, real-time (SMRT) sequencing libraries were prepared according to manufacturer guidelines (SMRTbell template prep kit 1.0, PacBio). Final libraries were purified by two sequential precipitations on magnetic beads (2 × 0.5× AMPure PB, PacBio) and assayed both by fluorometer (Qubit, Thermo Fisher) for dsDNA concentration and Bioanalyzer (DNA 12000 chip, Agilent) for size. SMRT sequencing was performed using the P6-C4 chemistry on the PacBio RS II instrument with 6-h movies.
Gene model determination from long-read RNA-seq data
A modified version of the Iso-Seq bioinformatics incorporating ToFU (Transcript isOforms: Full-length and Unassembled; Gordon et al. 2015) was used for processing the long-read RNA-seq data (all of which is available at https://github.com/EichlerLab/isoseq_pipeline). For each sequencing molecule, an intra-molecular CCS read was generated using CCS2 (deviations from default parameters include “–minLength=100 –maxLength=10000 –minPasses=1”). The CCS reads were then classified as pFL if the expected terminal sequences and a poly(A) tract were observed. Reads were then mapped to the human reference genome (GRCh38) using GMAP (v 2015-07-23) (Wu and Watanabe 2005), and mapped pFL reads were used for further analysis (for details of mapping, see Supplemental Note). Finally, newly determined isoforms were assessed for support by other data sources, including 5′ CAGE (cap analysis of gene expression) and 3′ poly(A)-seq (Supplemental Note) (Lianoglou et al. 2013; Lizio et al. 2015). ANGEL (https://github.com/PacificBiosciences/ANGEL) was used to identify ORFs. Genomic adenine homopolymers that could lead to spurious oligo-dT priming were identified to avoid incorrect 3′ end annotation.
Illumina RNA-seq
About five nanograms of poly(A)+ RNA pooled adult human brain (Clontech catalog no. 636102) or developing brain (Clontech catalog no. 636106) was used as input for the TruSeq Stranded mRNA-seq kit (Illumina) with parameters set for ∼150-bp insert-size libraries. Final purified libraries were assayed both by fluorometer (Qubit, Thermo Fisher) for dsDNA concentration and Bioanalyzer (DNA12000 chip, Agilent) for size. Sequencing-by-synthesis was performed on a HiSeq 2500 with 2 × 125-bp reads. Reads were demultiplexed using deML (Renaud et al. 2015) yielding 61 M and 72 M reads for developing and adult brain, respectively, and trimmed of adapter and low-quality sequence using Trimmomatic (Bolger et al. 2014) following quality control (QC) by FastQC (http://www.bioinformatics.babraham.ac.uk/projects/fastqc/ accessed 12 July 2016). Reads were mapped to GRCh38 using STAR (Dobin et al. 2013), and further QC was performed using QoRTs (Hartley and Mullikin 2015). Counts of uniquely mapping and multimapping reads were taken from the output of STAR mapping (“SJ.out.tab” file).
Tissue-specific expression estimates
RNA-seq data from the GTEx project (dbGaP version phs000424.v3.p1) was used to generate tissue-specific expression estimates for gene models with Kallisto (version 0.42.4) (Bray et al. 2016). New gene models were added to a FASTA file of the reference transcriptome (GENCODE v25 “Transcript sequences” file ftp://ftp.sanger.ac.uk/pub/gencode/Gencode_human/release_25/gencode.v25.transcripts.fa.gz). Redundant reference transcriptome sequences were removed (e.g., current fragments of CD8BP were removed after our putatively corrected gene models were added). This custom transcriptome was indexed, and the Kallisto quantification algorithm was run using default parameters on each of the GTEx samples. We note that estimates of expression levels are based on nonstranded RNA-seq data and may be confounded by overlapping antisense transcription and other mapping artifacts. Results in the form of transcripts per million were analyzed in R (R Core Team 2016) with the aid of dplyr (https://github.com/tidyverse/dplyr) and plotted using ggplot2 (https://github.com/tidyverse/ggplot2) and the ComplexHeatmap package (Gu et al. 2016). Pearson correlation coefficients for duplicate-ancestral gene pairs were generated in R (R Core Team 2016) based on median expression levels in each tissue for tissues that had at least five samples.
Test for purifying selection
We tested the hypothesis that the Tigger7-derived coding sequence was under purifying selection (dN/dS < 1) using CODEML (Yang 2007) by comparing two evolutionary models, one in which dN/dS (omega) is fixed at one, and one in which it is a free parameter. We used a χ2 test (1 d.f.) with twice the difference in log-likelihood as the test statistic, with a significance threshold of P < 0.05, to test if the higher parameter model was a statistically significantly better fit.
Tissue samples and in situ hybridization
De-identified primary cortical tissue samples were collected with previous patient consent in strict observance of the legal and institutional ethical regulations approved by the Human Gamete, Embryo, and Stem Cell Research Committee (Institutional Review Board) at the University of California, San Francisco. Tissue specimens were fixed overnight in 4% paraformaldehyde, dehydrated in 30% (w/v) sucrose, and embedded optimal cutting temperature solution (Tissue-Tek). Frozen tissue blocks were sectioned at 20-µm thickness using a Leica freezing microtome. Digoxigenin-labeled RNA probes for in situ hybridization were generated by in vitro transcription using T7 RNA Polymerase (Roche) in the presence of DIG-RNA labeling mix (Roche) (for probe design, see Supplemental Methods). In situ hybridization was performed according to a previously described protocol and NBT/BCIP was used to develop alkaline phosphatase conjugated to the sheep antibody against DIG (Sigma catalog no. 11093274910) (Wallace and Raff 1999). Images were collected with a Leica DMI 4000B microscope using a Leica DFC295 camera and were uniformly adjusted for brightness and contrast for clarity.
Data access
The data generated in this study, including PacBio and Illumina RNA-seq data, have been submitted to the NCBI BioProject database (https://www.ncbi.nlm.nih.gov/bioproject) under accession number PRJNA475610. The custom Iso-Seq pipeline used is available on GitHub (https://github.com/EichlerLab/isoseq_pipeline) and our custom script for Iso-Seq data processing is available as Supplemental_File_S3.py.
Competing interest statement
E.T. and J.G.U. are employees of Pacific Biosciences. E.E.E. is on the scientific advisory board (SAB) of DNAnexus, Inc.
Supplementary Material
Acknowledgments
We thank Z. Kronenberg and S. Murali for computational support and T. Brown for assistance editing the manuscript. We thank M.Y. Dennis for helpful comments on the manuscript. This work was supported by a training award from the National Human Genome Research Institute (F30HG009478 to M.L.D.) and, in part, by US National Institutes of Health (NIH) grant R01HG002385 to E.E.E. E.E.E. is an investigator of the Howard Hughes Medical Institute.
Footnotes
[Supplemental material is available for this article.]
Article published online before print. Article, supplemental material, and publication date are at http://www.genome.org/cgi/doi/10.1101/gr.237610.118.
References
- Alkan C, Sajjadian S, Eichler EE. 2011. Limitations of next-generation genome sequence assembly. Nat Methods 8: 61–65. [DOI] [PMC free article] [PubMed] [Google Scholar]
- Araud T, Graw S, Berger R, Lee M, Neveu E, Bertrand D, Leonard S. 2011. The chimeric gene CHRFAM7A, a partial duplication of the CHRNA7 gene, is a dominant negative regulator of α7*nAChR function. Biochem Pharmacol 82: 904–914. [DOI] [PMC free article] [PubMed] [Google Scholar]
- Barbosa-Morais NL, Irimia M, Pan Q, Xiong HY, Gueroussov S, Lee LJ, Slobodeniuc V, Kutter C, Watt S, Colak R, et al. 2012. The evolutionary landscape of alternative splicing in vertebrate species. Science 338: 1587–1593. [DOI] [PubMed] [Google Scholar]
- Bolger AM, Lohse M, Usadel B. 2014. Trimmomatic: a flexible trimmer for Illumina sequence data. Bioinformatics 30: 2114–2120. [DOI] [PMC free article] [PubMed] [Google Scholar]
- Bray NL, Pimentel H, Melsted P, Pachter L. 2016. Near-optimal probabilistic RNA-seq quantification. Nat Biotechnol 34: 525–527. [DOI] [PubMed] [Google Scholar]
- Casey JP, Magalhaes T, Conroy JM, Regan R, Shah N, Anney R, Shields DC, Abrahams BS, Almeida J, Bacchelli E, et al. 2012. A novel approach of homozygous haplotype sharing identifies candidate genes in autism spectrum disorder. Hum Genet 131: 565–579. [DOI] [PMC free article] [PubMed] [Google Scholar]
- Charrier C, Joshi K, Coutinho-Budd J, Kim J-E, Lambert N, de Marchena J, Jin W-L, Vanderhaeghen P, Ghosh A, Sassa T, et al. 2012. Inhibition of SRGAP2 function by its human-specific paralogs induces neoteny during spine maturation. Cell 149: 923–935. [DOI] [PMC free article] [PubMed] [Google Scholar]
- Chen Z, Cheng C-HC, Zhang J, Cao L, Chen L, Zhou L, Jin Y, Ye H, Deng C, Dai Z, et al. 2008. Transcriptomic and genomic evolution under constant cold in Antarctic notothenioid fish. Proc Natl Acad Sci 105: 12944–12949. [DOI] [PMC free article] [PubMed] [Google Scholar]
- Church DM, Goodstadt L, Hillier LW, Zody MC, Goldstein S, She X, Bult CJ, Agarwala R, Cherry JL, DiCuccio M, et al. 2009. Lineage-specific biology revealed by a finished genome assembly of the mouse. PLoS Biol 7: e1000112. [DOI] [PMC free article] [PubMed] [Google Scholar]
- Dennis MY, Nuttle X, Sudmant PH, Antonacci F, Graves TA, Nefedov M, Rosenfeld JA, Sajjadian S, Malig M, Kotkiewicz H, et al. 2012. Evolution of human-specific neural SRGAP2 genes by incomplete segmental duplication. Cell 149: 912–922. [DOI] [PMC free article] [PubMed] [Google Scholar]
- Dennis MY, Harshman L, Nelson BJ, Penn O, Cantsilieris S, Huddleston J, Antonacci F, Penewit K, Denman L, Raja A, et al. 2017. The evolution and population diversity of human-specific segmental duplications. Nat Ecol Evol 1: 69. [DOI] [PMC free article] [PubMed] [Google Scholar]
- Dobin A, Davis CA, Schlesinger F, Drenkow J, Zaleski C, Jha S, Batut P, Chaisson M, Gingeras TR. 2013. STAR: ultrafast universal RNA-seq aligner. Bioinformatics 29: 15–21. [DOI] [PMC free article] [PubMed] [Google Scholar]
- Dougherty ML, Nuttle X, Penn O, Nelson BJ, Huddleston J, Baker C, Harshman L, Duyzend MH, Ventura M, Antonacci F, et al. 2017. The birth of a human-specific neural gene by incomplete duplication and gene fusion. Genome Biol 18: 49. [DOI] [PMC free article] [PubMed] [Google Scholar]
- Duda TF, Palumbi SR. 1999. Molecular genetics of ecological diversification: duplication and rapid evolution of toxin genes of the venomous gastropod Conus. Proc Natl Acad Sci 96: 6820–6823. [DOI] [PMC free article] [PubMed] [Google Scholar]
- Dumas LJ, O'Bleness MS, Davis JM, Dickens CM, Anderson N, Keeney JG, Jackson J, Sikela M, Raznahan A, Giedd J, et al. 2012. DUF1220-domain copy number implicated in human brain-size pathology and evolution. Am J Hum Genet 91: 444–454. [DOI] [PMC free article] [PubMed] [Google Scholar]
- Flomen RH, Collier DA, Osborne S, Munro J, Breen G, St Clair D, Makoff AJ. 2006. Association study of CHRFAM7A copy number and 2 bp deletion polymorphisms with schizophrenia and bipolar affective disorder. Am J Med Genet B Neuropsychiatr Genet 141B: 571–575. [DOI] [PubMed] [Google Scholar]
- Florio M, Albert M, Taverna E, Namba T, Brandl H, Lewitus E, Haffner C, Sykes A, Wong FK, Peters J, et al. 2015. Human-specific gene ARHGAP11B promotes basal progenitor amplification and neocortex expansion. Science 347: 1465–1470. [DOI] [PubMed] [Google Scholar]
- Florio M, Namba T, Pääbo S, Hiller M, Huttner WB. 2016. A single splice site mutation in human-specific ARHGAP11B causes basal progenitor amplification. Sci Adv 2: e1601941. [DOI] [PMC free article] [PubMed] [Google Scholar]
- Fortna A, Kim Y, MacLaren E, Marshall K, Hahn G, Meltesen L, Brenton M, Hink R, Burgers S, Hernandez-Boussard T, et al. 2004. Lineage-specific gene duplication and loss in human and great ape evolution. PLoS Biol 2: e207. [DOI] [PMC free article] [PubMed] [Google Scholar]
- Gault J, Robinson M, Berger R, Drebing C, Logel J, Hopkins J, Moore T, Jacobs S, Meriwether J, Choi MJ, et al. 1998. Genomic organization and partial duplication of the human α7 neuronal nicotinic acetylcholine receptor gene (CHRNA7). Genomics 52: 173–185. [DOI] [PubMed] [Google Scholar]
- Gordon SP, Tseng E, Salamov A, Zhang J, Meng X, Zhao Z, Kang D, Underwood J, Grigoriev IV, Figueroa M, et al. 2015. Widespread polycistronic transcripts in fungi revealed by single-molecule mRNA sequencing. PLoS One 10: e0132628. [DOI] [PMC free article] [PubMed] [Google Scholar]
- The GTEx Consortium. 2013. The Genotype-Tissue Expression (GTEx) project. Nat Genet 45: 580–585. [DOI] [PMC free article] [PubMed] [Google Scholar]
- Gu Z, Eils R, Schlesner M. 2016. Complex heatmaps reveal patterns and correlations in multidimensional genomic data. Bioinformatics 32: 2847–2849. [DOI] [PubMed] [Google Scholar]
- Hahn MW. 2009. Distinguishing among evolutionary models for the maintenance of gene duplicates. J Hered 100: 605–617. [DOI] [PubMed] [Google Scholar]
- Harrow J, Frankish A, Gonzalez JM, Tapanari E, Diekhans M, Kokocinski F, Aken BL, Barrell D, Zadissa A, Searle S, et al. 2012. GENCODE: the reference human genome annotation for The ENCODE Project. Genome Res 22: 1760–1774. [DOI] [PMC free article] [PubMed] [Google Scholar]
- Hartley SW, Mullikin JC. 2015. QoRTs: a comprehensive toolset for quality control and data processing of RNA-Seq experiments. BMC Bioinformatics 16: 224. [DOI] [PMC free article] [PubMed] [Google Scholar]
- Iossifov I, O'Roak BJ, Sanders SJ, Ronemus M, Krumm N, Levy D, Stessman HA, Witherspoon KT, Vives L, Patterson KE, et al. 2014. The contribution of de novo coding mutations to autism spectrum disorder. Nature 515: 216–221. [DOI] [PMC free article] [PubMed] [Google Scholar]
- Ju X-C, Hou Q-Q, Sheng A-L, Wu K-Y, Zhou Y, Jin Y, Wen T, Yang Z, Wang X, Luo Z-G. 2016. The hominoid-specific gene TBC1D3 promotes generation of basal neural progenitors and induces cortical folding in mice. eLife 5: e18197. [DOI] [PMC free article] [PubMed] [Google Scholar]
- Kieffer LJ, Yan L, Hanke JH, Kavathas PB. 1997. Appropriate developmental expression of human CD8 β in transgenic mice. J Immunol 159: 4907–4912. [PubMed] [Google Scholar]
- Kieffer LJ, Greally JM, Landres I, Nag S, Nakajima Y, Kohwi-Shigematsu T, Kavathas PB. 2002. Identification of a candidate regulatory region in the human CD8 gene complex by colocalization of DNase I hypersensitive sites and matrix attachment regions which bind SATB1 and GATA-3. J Immunol 168: 3915–3922. [DOI] [PubMed] [Google Scholar]
- Kioussis D, Ellmeier W. 2002. Decision making in the immune system: chromatin and CD4, CD8A and CD8B gene expression during thymic differentiation. Nat Rev Immunol 2: 909–919. [DOI] [PubMed] [Google Scholar]
- Kozomara A, Griffiths-Jones S. 2011. miRBase: integrating microRNA annotation and deep-sequencing data. Nucleic Acids Res 39: D152–D157. [DOI] [PMC free article] [PubMed] [Google Scholar]
- Lagarde J, Uszczynska-Ratajczak B, Carbonell S, Pérez-Lluch S, Abad A, Davis C, Gingeras TR, Frankish A, Harrow J, Guigo R, et al. 2017. High-throughput annotation of full-length long noncoding RNAs with capture long-read sequencing. Nat Genet 49: 1731–1740. [DOI] [PMC free article] [PubMed] [Google Scholar]
- Lan X, Pritchard JK. 2016. Coregulation of tandem duplicate genes slows evolution of subfunctionalization in mammals. Science 352: 1009–1013. [DOI] [PMC free article] [PubMed] [Google Scholar]
- Li J-T, Hou G-Y, Kong X-F, Li C-Y, Zeng J-M, Li H-D, Xiao G-B, Li X-M, Sun X-W. 2015. The fate of recent duplicated genes following a fourth-round whole genome duplication in a tetraploid fish, common carp (Cyprinus carpio). Sci Rep 5: 8199. [DOI] [PMC free article] [PubMed] [Google Scholar]
- Lianoglou S, Garg V, Yang JL, Leslie CS, Mayr C. 2013. Ubiquitously transcribed genes use alternative polyadenylation to achieve tissue-specific expression. Genes Dev 27: 2380–2396. [DOI] [PMC free article] [PubMed] [Google Scholar]
- Lizio M, Harshbarger J, Shimoji H, Severin J, Kasukawa T, Sahin S, Abugessaisa I, Fukuda S, Hori F, Ishikawa-Kato S, et al. 2015. Gateways to the FANTOM5 promoter level mammalian expression atlas. Genome Biol 16: 22. [DOI] [PMC free article] [PubMed] [Google Scholar]
- Lynch M, Conery JS. 2000. The evolutionary fate and consequences of duplicate genes. Science 290: 1151–1155. [DOI] [PubMed] [Google Scholar]
- Lynch M, Conery JS. 2003. The origins of genome complexity. Science 302: 1401–1404. [DOI] [PubMed] [Google Scholar]
- Meunier J, Lemoine F, Soumillon M, Liechti A, Weier M, Guschanski K, Hu H, Khaitovich P, Kaessmann H. 2013. Birth and expression evolution of mammalian microRNA genes. Genome Res 23: 34–45. [DOI] [PMC free article] [PubMed] [Google Scholar]
- Nilsen TW, Graveley BR. 2010. Expansion of the eukaryotic proteome by alternative splicing. Nature 463: 457–463. [DOI] [PMC free article] [PubMed] [Google Scholar]
- Nuttle X, Giannuzzi G, Duyzend MH, Schraiber JG, Narvaiza I, Sudmant PH, Penn O, Chiatante G, Malig M, Huddleston J, et al. 2016. Emergence of a Homo sapiens-specific gene family and chromosome 16p11.2 CNV susceptibility. Nature 536: 205–209. [DOI] [PMC free article] [PubMed] [Google Scholar]
- Ohno S. 1970. Evolution by gene duplication. Springer-Verlag, New York. [Google Scholar]
- O'Leary NA, Wright MW, Brister JR, Ciufo S, Haddad D, McVeigh R, Rajput B, Robbertse B, Smith-White B, Ako-Adjei D, et al. 2016. Reference sequence (RefSeq) database at NCBI: current status, taxonomic expansion, and functional annotation. Nucleic Acids Res 44: D733–D745. [DOI] [PMC free article] [PubMed] [Google Scholar]
- R Core Team. 2016. R: a language and environment for statistical computing. R Foundation for Statistical Computing, Vienna, Austria: https://www.R-project.org/. [Google Scholar]
- Renaud G, Stenzel U, Maricic T, Wiebe V, Kelso J. 2015. deML: robust demultiplexing of Illumina sequences using a likelihood-based approach. Bioinformatics 31: 770–772. [DOI] [PMC free article] [PubMed] [Google Scholar]
- Ritchie W, Granjeaud S, Puthier D, Gautheret D. 2008. Entropy measures quantify global splicing disorders in cancer. PLoS Comput Biol 4: e1000011. [DOI] [PMC free article] [PubMed] [Google Scholar]
- Rozycka A, Dorszewska J, Steinborn B, Lianeri M, Winczewska-Wiktor A, Sniezawska A, Wisniewska K, Jagodzinski PP. 2013. Association study of the 2-bp deletion polymorphism in exon 6 of the CHRFAM7A gene with idiopathic generalized epilepsy. DNA Cell Biol 32: 640–647. [DOI] [PMC free article] [PubMed] [Google Scholar]
- Sporny M, Guez-Haddad J, Kreusch A, Shakartzi S, Neznansky A, Cross A, Isupov MN, Qualmann B, Kessels MM, Opatowsky Y. 2017. Structural history of human SRGAP2 proteins. Mol Biol Evol 34: 1463–1478. [DOI] [PMC free article] [PubMed] [Google Scholar]
- Steijger T, Abril JF, Engström PG, Kokocinski F, RGASP Consortium, Hubbard TJ, Guigó R, Harrow J, Bertone P. 2013. Assessment of transcript reconstruction methods for RNA-seq. Nat Methods 10: 1177–1184. [DOI] [PMC free article] [PubMed] [Google Scholar]
- Sudmant PH, Kitzman JO, Antonacci F, Alkan C, Malig M, Tsalenko A, Sampas N, Bruhn L, Shendure J, 1000 Genomes Project, et al. 2010. Diversity of human copy number variation and multicopy genes. Science 330: 641–646. [DOI] [PMC free article] [PubMed] [Google Scholar]
- Sudmant PH, Mallick S, Nelson BJ, Hormozdiari F, Krumm N, Huddleston J, Coe BP, Baker C, Nordenfelt S, Bamshad M, et al. 2015. Global diversity, population stratification, and selection of human copy-number variation. Science 349: aab3761. [DOI] [PMC free article] [PubMed] [Google Scholar]
- Sulak M, Fong L, Mika K, Chigurupati S, Yon L, Mongan NP, Emes RD, Lynch VJ. 2016. TP53 copy number expansion is associated with the evolution of increased body size and an enhanced DNA damage response in elephants. eLife 5: e11994. [DOI] [PMC free article] [PubMed] [Google Scholar]
- vonHoldt BM, Shuldiner E, Koch IJ, Kartzinel RY, Hogan A, Brubaker L, Wanser S, Stahler D, Wynne CDL, Ostrander EA, et al. 2017. Structural variants in genes associated with human Williams-Beuren syndrome underlie stereotypical hypersociability in domestic dogs. Sci Adv 3: e1700398. [DOI] [PMC free article] [PubMed] [Google Scholar]
- Wallace VA, Raff MC. 1999. A role for Sonic hedgehog in axon-to-astrocyte signalling in the rodent optic nerve. Development 126: 2901–2909. [DOI] [PubMed] [Google Scholar]
- Wu TD, Watanabe CK. 2005. GMAP: a genomic mapping and alignment program for mRNA and EST sequences. Bioinformatics 21: 1859–1875. [DOI] [PubMed] [Google Scholar]
- Yang Z. 2007. PAML 4: phylogenetic analysis by maximum likelihood. Mol Biol Evol 24: 1586–1591. [DOI] [PubMed] [Google Scholar]
- Yeo G, Burge CB. 2004. Maximum entropy modeling of short sequence motifs with applications to RNA splicing signals. J Comput Biol 11: 377–394. [DOI] [PubMed] [Google Scholar]
- Yim H-S, Cho YS, Guang X, Kang SG, Jeong J-Y, Cha S-S, Oh H-M, Lee J-H, Yang EC, Kwon KK, et al. 2014. Minke whale genome and aquatic adaptation in cetaceans. Nat Genet 46: 88–92. [DOI] [PMC free article] [PubMed] [Google Scholar]
- Zhu YY, Machleder EM, Chenchik A, Li R, Siebert PD. 2001. Reverse transcriptase template switching: a SMART approach for full-length cDNA library construction. Biotechniques 30: 892–897. [DOI] [PubMed] [Google Scholar]
Associated Data
This section collects any data citations, data availability statements, or supplementary materials included in this article.