

Abstract
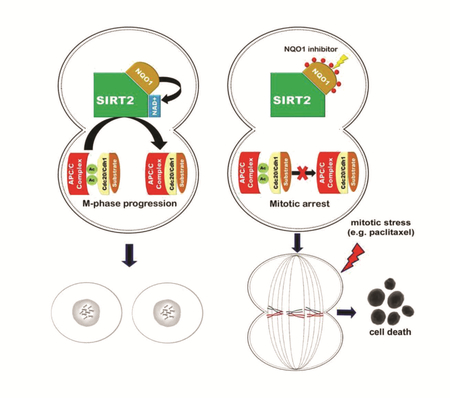
Previous studies have shown that SIRT2 plays a role in mitosis through deacetylating specific downstream targets. However, the upstream regulation of SIRT2 activity has been relatively unexplored. In this study, we provide evidence that NAD(P)H:quinone oxidoreductase 1 (NQO1) interacts with and activates SIRT2 in an NAD-dependent manner. Strong protein-protein interaction and co-localization of the two proteins during mitosis is required to maintain an active NQO1-SIRT2 axis which is critical for successful completion of mitosis. This is evident by the observed delay in mitotic exit in cells upon NQO1 inhibition. Mechanistically, this phenotype can be explained by the decrease in APC/C complex activity resulting from decreased SIRT2 deacetylation activity. Furthermore, we show that this newly established role of NQO1 has an impact on how cancer cells may respond to mitotic stress. In this regard, both pharmacologic and genetic NQO1 inhibition increases sensitivity to anti-mitotic drugs functioning as microtubule poisons by inducing mitotic arrest and allowing cells to accumulate cell death signals. Therefore, the significant prognostic value of NQO1 in predicting outcome of cancer patients might be explained in part due to the functional contribution of NQO1-SIRT2 axis to mitotic stress. Altogether, this novel mechanism of action further supports the pleiotropic biological effects exerted by NQO1 in addition to its antioxidant function and it might provide the basis for expanding the therapeutic potential of NQO1 inhibition towards increasing sensitivity to standard treatments.
Keywords: NQO1, SIRT2, cancer, APC/C complex, anti-mitotic drugs
Graphical abstract
INTRODUCTION
Sirtuin genes are the human and murine homologs of the S. cerevisiae silence information regulator 2 (Sir2) gene which was initially identified as a chromatin silencer [1] involved in lifespan extension [2]. In mammals, seven sirtuins (SIRT1–7) have been identified that share homology with Sir2 which are categorized as class III histone deacetylases present in nearly all subcellular compartments [3]. SIRT1, SIRT6 and SIRT7 are predominantly localized in the nucleus; SIRT3, SIRT4 and SIRT5 reside within the mitochondria; and SIRT2 is primarily found in the cytoplasm. The highly conserved structure of sirtuins, as well as their NAD+ dependence [4], has led to the suggestion that these enzymes are a family of nutrient-sensing regulators cooperating in semi-redundancy to direct cellular metabolism in response to altered nutrition or stress. In addition to their function as deacetylases, several lines of evidence support a role for sirtuins in regulating different types of acylations such as succinilation, malonylation and myristoylation [5]. Focusing on acetylation as a regulatory post-translational modification (PTM) involved in several cellular functions [6], it is well established that sirtuins through directing critical acetylome networks regulate a plethora of cellular functions including DNA repair, maintenance of genomic instability, apoptosis, response to stress and inflammation, control of energy efficiency, circadian clocks and metabolism, as well as contribute to the initiation and/or progression of age-related diseases such as cancer, neurodegeneration and type 2 diabetes [3, 7].
Despite the predominant cytoplamic localization of SIRT2 and its established deacetylation activity towards lysine-40 of alpha-tubulin [8], among the first functions attributed to this member of the sirtuin family was its role in regulating mitosis. During this phase of the cell cycle, SIRT2 has been shown to control chromatin condensation by deacetylating histone H4 lysine 16 (H4K16Ac) [9], as well as mitotic exit [10]. Furthermore, it has been found that SIRT2 is a mitotic checkpoint protein that blocks entry to chromosome condensation as well as regulates chronic mitotic arrest in response to mitotic stress [11, 12]. In accordance with the previously assigned functions, SIRT2 associates with several mitotic structures during the cell cycle including the centrosome, mitotic spindle, and midbody, presumably ensuring normal cell division [13]. Interestingly, both the tumor suppressor function in vivo and involvement in lifespan extension seem to be directly associated with its role in regulating known mitotic gatekeepers. Sirt2-/- mice develop spontaneous tumors due to the acetylation-dependent decreased activity of Anaphase-promoting complex (APC/C) resulting in mitotic defects and genomic instability [14]. Moreover, overexpression of Sirt2 in BubR1 hypomorphic mice increases median lifespan by inhibiting BubR1 ubiquitination through deacetylation of lysine 668 (K668) [15]. These studies provide valuable information focused on downstream pathways underlying the significant role of SIRT2 in mitosis, however much less is known about upstream pathways that may regulate its catalytic activity. With regards to this, SIRT2 can be phosphorylated by cyclin E–Cdk2 [16]. Cdks phosphorylate Ser-331 (or the comparable Ser- 368 in an alternatively spliced version of SIRT2 [17]) within a Cdk consensus sequence that is conserved in several sirtuin family members resulting in repressed SIRT2 enzymatic activity. Consistent with these previous studies, group IVA cytosolic phospholipase A2 was recently found to inhibit SIRT2 activity during the G2-to-M transition by promoting binding of SIRT2 to cyclin A-Cdk2 and Ser-331 phosphorylation further underlying Cdks as the only upstream regulators of SIRT2 activity[18].
NAD(P)H:quinone oxidoreductase 1 (NQO1) is an enzyme that protects cells from cytotoxic quinones and oxidative stress [19]. The two-electron reduction of quinones to hydroquinones by NQO1 using either NADH or NADPH is a detoxification reaction bypassing the formation of the highly reactive semiquinone [20], whereas NQO1 may reduce superoxide to hydrogen peroxide [21]. In addition to these cytoprotective functions, it has also been involved in preventing proteosomal degradation of p53 [22]. Notably, NQO1-mediated reduction of quinones may result in the formation of cytotoxic hydroquinones. Based on this, bioactivation of quinone prodrugs by NQO1 has been proposed as a therapeutic strategy against cancer cells. β-lapachone is such an example which has been found to selectively kill lung, pancreatic and breast cancer cells expressing high levels of NQO1 [23, 24]. Despite the fact that mice lacking a functional Nqo1 are born normal [25], concomitant with its cytoprotective functions, NQO1 protects mice from diverse chemical carcinogens [26], and Nqo1-/- mice exhibit reduced glucose and fatty acid metabolism due to the increased NAD(P)H/NAD(P) ratio [27].
Although NQO1 is predominately found in the cytoplasm, where it functions as a quinone reductase and/or antioxidant, it can translocate to the nucleus under stressful conditions which is thought to be relevant to its function in stabilizing p53. Interestingly, a recent study using both immunohistochemistry and confocal microscopy demonstrated that it is associated with the mitotic spindle during the different phases of mitosis [28]. Given that NQO1 activity can alter the NAD+/NADH ratio, together with the well-established role of SIRT2 during mitosis, our current study aims at exploring the undefined role of NQO1 localization in mitotic spindle and determine whether it may act as an upstream regulator of SIRT2 activity. Here we identify NQO1 as a SIRT2 interacting protein especially during mitosis and we demonstrate that NQO1 plays a role in maintaining SIRT2 activity through regulating the NAD+/NADH ratio. Thus, NQO1 is a novel regulator of SIRT2 mitotic functions and the active NQO1/SIRT2 axis is involved in both mitotic progression under normal conditions and cellular responses to mitotic stress.
MATERIALS AND METHODS
Cell culture and Treatments
Human cancer cell lines MCF-7 (ATCC® HTB-22™), MDA-MB-231 (ATCC® HTB-26™), HeLa (ATCC® CCL-2™) and PANC-1 (ATCC® CRL-1469™) were cultured in Dulbecco’s modified Eagle’s medium (DMEM) supplemented with 10% fetal bovine serum (FBS). Human cancer cell lines T47D (ATCC® HTB-133™) and BxPC3 (ATCC® CRL-1687™) were cultured in RPMI-1640 medium supplemented with 10% FBS. Antibiotics were added to the culture medium (penicillin 10,000 units/ml and streptomycin 10 mg/ml). Cells were maintained at 37°C in a humidified atmosphere containing 5% CO2 and 95% O2. Cell lines were authenticated using CellCheck by IDEXX Bioresearch, and tested for mycoplasma using PlasmoTest™ - Mycoplasma Detection Kit (InvivoGen, Inc). Immortalized Sirt2+/+ and Sirt2-/- MEFs were made as described previously [29]. For the various cell treatments, Nocodazole, Thymidine, Dicoumarol, NAD and Paclitaxel were purchased from Sigma-Aldrich.
Plasmids/transfection/infection
NQO1 expressing vector (pCMV3-C-FLAG) was purchased from Sino Biological. Site-directed mutagenesis to introduce NQO1P187S mutation was performed using a commercially available kit (Q5® Site-Directed Mutagenesis Kit, NEB). All SIRT2 and cell cycle related proteins constructs have been described previously [14]. siNQO1 human (sc-37139, Santa Cruz), siNQO1 mouse (sc-37140, Santa Cruz) and siRNA control (sc-37007, Santa Cruz) were used in all experiments at a final concentration of 20 nM. Transfections were performed using Lipofectamine RNAiMAX (Invitrogen). In brief, cells were seeded in six-well plates at 1.5×10⁵ cells/well, 16 hours prior to transfection. For each transfection, the cells were exposed to serum- and antibiotic-free Opti-MEM (Invitrogen) during 4 hours and then supplemented with 500 µl of DMEM containing 10% FBS. MCF-7 cells stably expressing H2B-GFP were generated by transfecting MCF-7 cells with a H2B-GFP plasmid (Addgene, Plasmid #11680) following selection with 500 µg/ml G418 (Invitrogen). MCF-7 cell lines stably expressing either control or NQO1 shRNA were generated by infecting MCF-7 cells with lentiviral-based shRNA constructs. For this, target sequences were subcloned into a pLKO.1 lentiviral vector (Addgene, plasmid#8453). Cells were treated forty eight hours after infection with 1 µg/ml Puromycin (Sigma) and maintained for 2–3 weeks for selection.
Pull-down assays:
Recombinant human SIRT2 and GST tagged NQO1 (GST-NQO1) proteins were purchased from Abcam and Creative BioMart, respectively. SIRT2 and GST-NQO1 were incubated for 1 hour at 4°C with rotation in 20 mM Tris-HCl (pH 7.62), 150 mM NaCl and 1% Triton X-100 binding buffer. The mixture was then incubated with either Glutathione Sepharose beads (GE Healthcare) or SIRT2 pre-conjugated magnetic beads (Bimake) for an additional 2 hours at 4°C with rotation. After 4–5 washes with binding buffer, samples were eluted with 4X LDS loading buffer, boiled for 5 min and loaded on an SDS gel. SIRT2 and GST-NQO1 were detected using a rabbit anti-SIRT2 antibody (1:1000, Protein Tech) and a mouse anti-GST antibody (1:1000, Santa Cruz) respectively. To check the molecular weight, 0.5 µg protein was loaded on a SDS-PAGE gel together with the SeeBlue® Plus2 Pre-Stained Standard (Thermo Fisher). Next, the gel was stained with commassie blue followed by destaining with water.
Immunofluorescence:
Cells were grown on chamber slides. Next cells were fixed in 4% (v/v) paraformaldehyde for 10 min at room temperature, followed by cell permeabilization with 0.5% Triton X-100 for 10 min, and blocking with 10% normal goat serum for 1 hr. Cells were incubated with appropriate primary antibodies against NQO1 (Cell signaling, dilution 1:200), and SIRT2 (Sigma, dilution 1:200) followed by incubation with Alexa Fluor 488 or 568 secondary antibodies (Life Technologies). The nuclei were stained with 4’, 6-Diamidino-2-Phenylindole, Dihydrochloride (DAPI; ThermoFisher Scientific). Images were obtained using a confocal laser microscope (Nikon A1R) and a Structured Illumination Super-resolution microscope (Nikon N-SIM) in the Center for Advanced Microscopy, Northwestern University.
Measurement of the intracellular NAD+/NADH ratio:
For intracellular NAD+/NADH determination, Total NADt (NADH and NAD) and NADH were analyzed independently in whole cell extracts (1 X 10⁶ cells) following manufacturer’s instructions (Biovision). The reactions were prepared in 96-well plates and read at 450 nm using a spectrophotometer. The ratio of NAD+/NADH was calculated based on results of NADt and NADH concentrations.
SIRT2 activity:
SIRT2 activity was measured in cell lysates using the FLUOR DE LYS® SIRT2 Deacetylase Fluorometric Assay Kit (Enzo Life Sciences, Inc) with some modifications. Briefly, SIRT2 and NAD+ were excluded from the reaction mixture and were replaced by lysates from control and NQO1 knocked down cells (20ug total protein). Reactions we performed by adding the FLUOR DE LYS® SIRT2 Substrate followed by incubation with the FLUOR DE LYS®Developer II as described in the kit.
Time-Lapse imaging:
H2B-GFP cells were seeded in 4-well Chamber slides (Nunc) followed by transfection with either control siRNA or NQO1 siRNA. Live cell imaging was performed using the Nikon BioStation equipped with a 20 x objective enclosed in a chamber maintaining temperature at 37°C, and CO2 concentration at 5% available in the Center for Advanced microscopy, Northwestern University.
In Vivo Ubiquitination Assay:
MCF-7 cells were transfected with HA-Ubiquitin, Myc-Aurora A and treated with MG132 (10 µM) for 4 hours. Cells were harvested and in vivo ubiquitination assay was conducted as described previously [14]. Briefly, cells were lysed with two volumes of TBS (10 mM Tris-HCl pH 7.5, 150 mM NaCl) supplemented with 2% SDS for 10 min at 95° C. Eight volumes of 1% Triton X-100 in TBS was added to the lysate, followed by sonication and incubation with protein G-agarose beads for 2 h at 4° C. After centrifugation, the supernatant was incubated with anti-Myc conjugated beads overnight. The immunoprecipitates were washed with 0.5 M LiCl in TBS and eluted proteins were analyzed by immunobloting with anti-Myc and anti-HA antibodies.
Mitotic index:
Cells were plated on coverslips and fixed with 4% (v/v) paraformaldehyde in PBS for 10 min at room temperature, permeabilized with 0.5% Triton X-100 in PBS for 10 min, stained with phosphor-H3 (p-H3) antibody (Cell Signaling) and 4’, 6-Diamidino-2-Phenylindole, Dihydrochloride (DAPI, ThermoFisher Scientific), and mounted on glass microscope slides. The mitotic index (MI) was determined by inspecting cells under the microscope.
Colony formation ability:
Cells were seeded in 6-well plates in triplicate and treated with nocodazole or paclitaxel for the indicated durations. After treatment, cells were washed twice with PBS and incubated in regular medium (drug-free) for 2 weeks. The resultant colonies were stained with 1% crystal violet/70% ethanol and then counted.
Kaplan-Meier (K-M) analysis:
To perform K-M analysis on NQO1 mRNA expression, an open-access online survival analysis tool [30] was used to interrogate publically available microarray data from > 5,000 breast cancer patients. Hazard ratios with 95% confidence intervals and logrank P values are calculated.
Statistics:
Data are expressed as mean ± SEM. All experiments were repeated at least three times. Student’s t test and analysis of variance (ANOVA) were performed to determine the probability of statistically significant differences (P-values) using GraphPad Prism 7 (GraphPad Software, CA, USA) and recorded in figure legends. A P-value less than 0.05 was considered statistically significant.
RESULTS
SIRT2 colocalizes with NQO1 in the mitotic spindle
It has been previously shown that SIRT2 localizes to the mitotic spindle functioning as a deacetylase to regulate mitotic progression [13, 14]. Similar to SIRT2, NQO1 has been also recently found to associate with the mitotic spindle while still maintaining catalytic activity [28]. Although this indicates that NQO1 might be involved in regulating mitosis, the exact underlying mechanism is unexplored. Given that NQO1 oxidizes NAD(P)H to NAD(P)+, we hypothesized there might be a coherent interplay between NQO1 and SIRT2 during mitosis. To this end, we sought to determine, first, whether the two proteins co-localize to the mitotic spindle. NQO1 is expressed in MCF-7 cells (Supplementary Fig. 1A) and it has been previously reported to bind the mitotic spindle [28]. Immunofluorescent staining of MCF-7 breast cancer cells using confocal microscopy revealed that both endogenous NQO1 and SIRT2 are located primarily in the cytoplasm. However, intense immunostaining for both proteins was observed at different phases of mitosis, including metaphase and telophase (Fig. 1A, B). After drawing a transversal line through the nucleus in the merged images using ImageJ software, the signal intensities for SIRT2, NQO1 and DAPI strongly supported the colocalization of both proteins to the mitotic spindle (Fig. 1A, B right). To exclude that the observed colocalization is cell type dependent, immunofluorescent staining was also performed in BxPc-3 human pancreatic adenocarcinoma cell line where NQO1 mitotic spindle localization was first reported [28]. Again, colocalization of SIRT2 and NQO1 was confirmed (Fig. 1C, D), whereas higher magnification images show that both proteins localize to different structures of the spindle during mitosis including metaphase, anaphase and telophase (Fig, 1E–G and Supplementary Fig. 1B, C). These results suggest that SIRT2 and NQO1 might be binding partners during mitosis.
Figure 1:

NQO1 and SIRT2 colocalize to the mitotic spindle during mitosis. (A, B) Confocal microscopy images show the locations of endogenous SIRT2 (red) and NQO1 (green) during both metaphase (A) and telophase (B) in MCF-7 human breast cancer cells. (C, D) Confocal microscopy images show the locations of endogenous SIRT2 (red) and NQO1 (green) during both metaphase (C) and telophase (D) in BxPC-3 human pancreatic cancer cells. In all panels above, DNA was stained with DAPI (blue). On the right, graphs represent signal intensity scans along the lines drawn for each panel. Scale bar, 20 µm. (E, F, G) Higher magnification images (60x) under same experimental conditions as shown in A, B.
Since it is unclear whether SIRT2 and NQO1 bind either directly or indirectly to mitotic structures, we wanted to examine whether their interaction is required for tethering to the mitotic spindle. MDA-MB-231 breast cancer cells and PANC-1 pancreas ductal adenocarcinoma cells do not express NQO1 (Supplementary Fig. 1A) due to homozygous expression of the NQO1*2 polymorphism resulting in decreased protein stability through ubiquitination-dependent degradation by the proteasome. Despite the absence of NQO1, SIRT2 was still able to localize to the spindle in both cell lines as revealed by immunofluorescence staining and confocal microscopy (Supplementary Fig. 1D, E). To elucidate whether SIRT2 is required for NQO1 binding to the spindle, similar staining was performed in Sirt2-/- MEFs [14, 29] as well. In accordance with the previous result, NQO1 interaction with the spindle was not affected by the loss of SIRT2 (Supplementary Fig. 1F, G), suggesting that SIRT2 and NQO1 bind independently to the mitotic spindle.
NQO1 interacts with SIRT2
To start unraveling the mechanistic details regarding the interplay between SIRT2 and NQO1, we checked whether the two proteins are present in the same protein complex. Reciprocal co-immunoprecipitation (co-IP) experiments confirmed interaction between Flag-NQO1 and HA-SIRT2 in MCF-7 cells (Fig 2A). Same results were obtained when co-IP experiments were performed using antibodies to detect endogenous proteins (Fig 2B). The strong colocalization of the two proteins during mitosis, as revealed by confocal microscopy (Fig. 1), prompted us to check protein-protein interaction in cells synchronized at the G2/M phase of the cell cycle. MCF-7 cells were synchronized in mitosis following treatment with nocodazole (Supplementary Fig. 2A). Co-IP experiments showed a strong interaction between HA-SIRT2 and Flag-NQO1 (Fig 2C). To exclude either a cell-type specific effect or an effect specific to the synchronization protocol, HeLa cells were synchronized at the G2/M phase after serum starvation and release to regular medium (Supplementary Fig. 2B). Convincingly, a stronger interaction of the two proteins was detected in synchronized cells as compared to unsynchronized cells (Fig. 2D). This was consistent with relatively more abundant accumulation of both proteins in the nuclear fraction in synchronized cells as revealed by detecting intracellular biochemical distribution of both SIRT2 and NQO1 after fractionation into cytoplasmic (cyt) and nuclear (nuc) extracts.
Figure 2:

NQO1 interacts directly with SIRT2. (A) MCF-7 cells were transiently transfected with Flag-NQO1 and HA-SIRT2. 48 h after transfection, cell lysates were subjected to immunoprecipitation (IP) using either a Flag (left) or an HA (right) antibody followed by western blotting using antibodies against HA and Flag, respectively. Specificity was confirmed by using species-matched control IgG as a negative control. (B) Cell lysates from MCF-7 cells were subjected to immunoprecipitation (IP) using a SIRT2 antibody followed by western blotting using an anti-NQO1 antibody. * denotes Ig heavy and light chain. (C) Cell lysates from MCF-7 cells as described in (A) either unsynchronized or synchronized in mitosis after treatment with nocodazole (Noc, 200 nM for 12 h) were subjected to immunoprecipitation using an antibody against HA followed by western blotting using a Flag antibody. Specificity was confirmed by using species-matched control IgG as a negative control. Overexpression of both Flag-NQO1 and HA-SIRT2 is confirmed by western blotting (lower). (D) Reciprocal co-immunoprecipitation of endogenous SIRT2 and NQO1 in either unsynchronized or synchronized in mitosis Hela cells. For cell synchronization, HeLa cells were serum starved for 48 h and then released into regular media for 16 h. Cell lysates were subjected to immunoprecipitation (IP) using either a SIRT2 (left) or an NQO1 (right) antibody followed by western blotting using antibodies against SIRT2 and NQO1. Specificity was confirmed by using species-matched control IgG as a negative control. (E) Either unsynchronized or synchronized in mitosis (syn, as described in C) MCF-7 cells were fractionated into cytoplasmic extracts (cyt) and nuclear extracts (nuc). Levels of both SIRT2 and NQO1 were detected by western blotting. Successful cellular fractionation was confirmed by western blotting using antibodies against markers such as Lamin A/C (nuc) and actin (cyt). (F) Recombinant human SIRT2 and GST-NQO1 were used to check protein-protein interaction in vitro. Coomassie staining shows the molecular weight of the two proteins. GST-NQO1 was immunoprecipitated followed by SIRT2 immunodetection of (upper). In addition, SIRT2 was immunoprecipitated first, followed by immunodetection of GST-NQO1 (lower). Beads alone were used in the pull-down assays as negative controls.
To confirm the direct interaction between the two proteins, co-IP experiments were performed in a cell-free system using purified proteins. As shown in Figure 2F, pull-down of GST-tagged NQO1 resulted in immunodetection of SIRT2, whereas no interaction was detected when control beads were used. Same results were obtained when pull-down of SIRT2 was performed first, followed by immunodetection using an anti GST antibody to detect NQO1. Again, no interaction was detected using control beads. Collectively, these results strongly support a direct interaction between the two proteins.
NQO1 positively regulates SIRT2 deacetylase activity
Based on the identified colocalization and physical interaction of NQO1 and SIRT2, we next sought to explore the physiological consequences of this interaction. Given that NQO1 activity can alter the NAD+/NADH ratio, we assumed that NQO1 might function as an upstream regulator of SIRT2. To optimally test this hypothesis, acetylated levels of α-tubulin were used as a readout for SIRT2 activity [8]. Knockdown of NQO1 using siRNA resulted in increased levels of acetylated Lys-40 α-tubulin in MCF-7 cells as compared to cells transfected with ctr siRNA (Fig 3A). On the contrary, decreased α-tubulin acetylation was detected after exogenous expression of NQO1 in MDA-MB-231 cells (regarded as NQO1 null) (Fig. 3B). Consistent with genetic inhibition, cells treated with the NQO1 inhibitor dicoumarol showed increased levels of acetylated α-tubulin (Fig. 3C). Considering that sirtuins are NAD+ dependent deacetylases, we further examined whether decreased SIRT2 deacetylase activity was accompanied with decreased NAD+ levels. Indeed, NQO1 knocked-down MCF-7 cells exhibited a reduction in the NAD+/NADH ratio (Fig. 3D–F). Simultaneously, NQO1 knocked-down cells exhibited a decrease in SIRT2 activity as revealed using a fluorometric assay to check for enzymatic activity (Fig. 3G). More importantly, exogenous NQO1 expression or NAD+ supplementation restored to normal levels acetylated α-tubulin in the NQO1 knocked-down cells (Fig. 3H) implying that NQO1 may regulate directly SIRT2 activity.
Figure 3:

NQO1 positively regulates SIRT2 activity. (A) MCF-7 cells were transfected with either control (ctr) siRNA or NQO1 siRNA. 48 h after transfection, lysates were analyzed by western blotting using antibodies against Lys-40 acetylated tubulin (Ac-Tubulin), NQO1, SIRT2 and tubulin/actin. Quantification of acetylated tubulin levels are presented, **p<0.01. (B) MDA-MB-231 cells (NQO1 null) were transfected with either empty vector (ctr), Flag-NQO1 or Flag-NQO1P187S. 48h after transfection, lysates were analyzed by western blotting using antibodies against Lys-40 acetylated tubulin (Ac-Tubulin), Flag, SIRT2 and tubulin/actin. Quantification of acetylated tubulin levels are presented, **p<0.01. (C) MCF-7 cells were treated with Dicoumarol (100 uM) for different times or with different concentrations as indicated for 24h. Lysates were analyzed by western blotting using antibodies against Lys-40 acetylated tubulin (Ac-Tubulin), SIRT2 and tubulin. Quantification of acetylated tubulin levels are presented, *p<0.05. (D, E, F) MCF-7 cells were transfected with either control (ctr) siRNA or NQO1 siRNA. Cells were lysed in extraction buffer, and NADtotal (NAD and NADH) (D) as well as NADH alone (E) were calculated. The ratio of NAD/NADH (F) is calculated based on the formula (NADtotal-NADH)/NADH. Data represent Mean ± SEM of three independent experiments, *P<0.05. (G) MCF-7 cells were transfected with either control (ctr) siRNA or NQO1 siRNA. 48 h after transfection, SIRT2 activity in these lysates was determined by using a fluorometric assay based on the deacetylation of a unique target peptide included in the kit (FLUOR DE LYS® SIRT2 Deacetylase Fluorometric Assay Kit). Data represent Mean ± SEM of three independent experiments, *P<0.05. (H) MCF-7 cells were transfected with either control (ctr) siRNA or NQO1 siRNA. NQO1 knockdown cells were next transfected with NQO1 cDNA or treated with NAD+ (0.5 mM). Cell extracts were analyzed by western blotting using antibodies against Acetylated-Tubulin (Ac-tubulin), NQO1, SIRT2 and actin/GAPDH. * denotes exogenously expressed Flag-NQO1, whereas ** denotes the expression of endogenous NQO1. (I) MCF-7 cells were transfected with either control (ctr) siRNA or SIRT2 siRNA in the presence or absence of exogenously expressed NQO1 or NQO1P187S. Cell extracts were analyzed by western blotting using antibodies against acetylated histone H4 lysine16 (Ac-H4K16), SIRT2, Flag (NQO1) and actin. Note that NQO1P187S cannot be detected as this mutation affects enzymatic activity by extremely decreasing stability due to ubiquitination and proteasomal degradation [44]. (J) Wild-type (Sirt2+/+) and Sirt2 knockout (Sirt2-/-) MEFs were transfected with either control (ctr) siRNA, Nqo1 siRNA or Flag-NQO1 cDNA. Cell extracts were analyzed by western blotting using antibodies against acetylated histone H4 lysine16 (Ac-H4K16), SIRT2, Flag (NQO1) and actin.
Lys-16 histone H4 (H4K16) has been previously described as a SIRT2-specific deacetylation target [9]. Therefore, Lys-16 acetylation is considered to be a marker for intracellular SIRT2 activity [18] and, for this reason, it was also included in our analysis. Consistent with previous results, NQO1 overexpression decreased H4K16 acetylation in MCF-7 cells whereas expression of an NQO1 mutant (NQO1P187S), which exhibits decreased protein stability and enzymatic activity, had no effect (Fig. 3I, lanes 1, 3 and 5). However, NQO1 overexpression combined with SIRT2 knock-down failed to reduce H4K16 acetylation (Fig. 3I, lanes 3 and 4), implying that there is a functional interplay between the two proteins. Similarly, Nqo1 knockdown in Sirt2-/- MEFs didn’t affect H4K16 acetylated levels as opposed to the increased levels detected upon Nqo1 knockdown in Sirt2+/+ MEFs (Fig. 3J lanes 2, 4 vs lanes 1, 3), whereas NQO1 overexpression didn’t reverse H4K16 acetylation in cells lacking Sirt2 (Fig. 3J). The differences in the acetylated levels of downstream SIRT2 targets could be explained by decreased SIRT2 protein levels, decreased deacetylation activity or both. However, the unchanged levels of SIRT2 levels upon either NQO1 down-regulation or NQO1 overexpression in different cell systems (Fig. 3), the unaltered stabilization of SIRT2 by assessing protein levels after cyclohexamide treatment in both control and NQO1 knocked-down cells (Supplementary Fig. 2C, D) along with the previously described concomitant decrease in both NAD+ levels and SIRT2 enzymatic activity upon NQO1 downregulation (Fig. 3C–F), substantially suggest that altered SIRT2 deacetylase activity is the underlying mechanism.
NQO1-SIRT2 axis regulates mitotic progression
Since SIRT2 catalytic activity has been previously shown to regulate mitotic progression [14], we examined the unexplored role of NQO1 in mitotic cells which could provide insights into its functional role resulting from its presence in mitotic structures. Both control (ctr) siRNA and NQO1 siRNA transfected MCF-7 cells were synchronized in mitosis after treatment with nocodazole as described previously followed by release in normal medium. To determine progression and completion of mitosis, flow cytometry using propidium iodide DNA staining was employed at different time points after release in normal medium. MCF-7 NQO1 siRNA cells exhibited a significant delay in completing mitosis and progressing to G1 compared to control cells as revealed by the decreased number of cells in G1 phase following mitotic synchronization (Fig. 4 A, B). Same results were obtained when stable NQO1 knockdown cells were analyzed (Fig. 4C and Supplementary Fig. 3A). The opposite effect was observed after exogenous NQO1 expression in MDA-MB-231 cells (NQO1 null). In this case, the ratio of G1 to G2/M cells following mitotic synchronization with nocodazole treatment was increased upon NQO1 expression (Supplementary Fig. 3B and C), although the response was weaker compared to the effect of NOQ1 inhibition on MCF-7 cells.
Figure 4:

NQO1 controls mitotic progression. (A) Control (ctr) siRNA and NQO1 siRNA transfected MCF-7 cells were synchronized in mitosis after treatment with nocodazole (Noc, 200 nM for 12 h) followed by release in normal medium. Flow cytometric analysis of cell cycle at the indicated time points after release was done using propidium iodide DNA staining. (B) Table shows percentage of cells in each phase of the cell cycle (G0/G1, S, and G2/M) at indicated time points after nocodazole release from the experiment presented in (A). (C) Control shRNA and NQO1 shRNA stable MCF-7 cells were synchronized in mitosis after treatment with nocodazole (Noc, 200 nM for 12 h). Cell cycle distribution was assessed as in A. (D) Mitotic progression of MCF-7 cells transfected with either control (ctr) siRNA or NQO1 siRNA was monitored by live-cell microscopy. Characteristic phase-contrast images are shown. Mitosis is completed in less than 90 min under normal conditions (arrow, upper). Mitosis fails to be completed as evidenced by the lack of formation of two daughter cells (arrow, lower). (E) MCF-7 cells stably expressing H2B-GFP were transfected with either control (ctr) siRNA or NQO1 siRNA. Mitosis was monitored by live-cell microscopy. Characteristic images are shown. Normal completion of mitosis is shown in the upper panel, whereas impaired mitoses are shown in the lower panel. Scale bar is 10 µm. (F) Percentage of cells exhibiting mitotic defects under different experimental conditions. Mitoses were checked in control (ctr) siRNA, NQO1 siRNA and NQO1 siRNA treated with Nicotinamide mononucleotide (ΝΜΝ, 0.5 mΜ) MCF-7 cells.
Cell division phenotypes are rare and transient in cell culture and are therefore missed in endpoint assays. For this reason, live-cell imaging was used to monitor mitotic progression. Analysis by phase-contrast in live-time lapse microscopy revealed that control cells could complete mitosis in less than 90 min as indicated by successful cytokinesis and formation of two daughter cells (Fig 4D and Supplementary video 1). In contrast, NQO1 knocked-down cells resulted in mitotic defects including cells that failed to complete mitosis for an extended period of time (Fig. 4D, lower and Supplementary video 2). This effect was further confirmed after treating cells with dicoumarol (Supplementary Fig. 3D), a pharmacologic inhibitor of NQO1 that has been shown not to affect binding of NQO1 to mitotic spindles [28]. The mitotic defects due to NQO1 knockdown were further confirmed in MCF-7 cells stably expressing a chromatin marker (H2B-GFP). An obvious observation after checking the cells under microscope was that the number of cells with high fluorescence intensity was higher in the NQO1 knocked down cells compared to control cells, which was an indication of an increased number of cells with condensed chromosomes. Indeed, live-time lapse microscopy showed that NQO1 knocked down cells exhibited mitotic defects as revealed by either the significant delay or failure in successfully exiting mitosis (Fig. 4E, F and Supplementary video 3 and 4). To show that NAD+ is the key function of NQO1 in regulating mitotic progression, NQO1 knocked down cells were treated with nicotinamide mononucleotide (NMN), an NAD+ precursor. There are several studies that have used this approach to augment NAD+ levels at both the cellular and organismal level resulting in beneficial effects in the context of obesity, aging, and diabetes [31–33]. Of note, NMN treatment (0.5 mM) rescued the mitotic defects observed in siNQO1 cells as evidenced by the increased number of cells that could successfully complete mitosis (Fig. 4F and Supplementary video 5 and 6).
NQO1 interacts with APC/C complex and regulates its activity through SIRT2
Of note, Sirt2-/- cells have been previously found to display abnormalities in mitosis including failure to complete cytokinesis and arrest at metaphase [14]. These phenotypes have been attributed to the role of SIRT2 in regulating APC/C complex formation and activity through deacetylating co-activators essential for substrate specificity, such as Cdc20 and Cdh1 [34]. Provided that NQO1 interacts with SIRT2 and regulates its deacetylation activity, we sought to determine the impact of NQO1-SIRT2 axis on APC/C complex. Cdh1 and Cdc20 activate APC/C by binding to Cdc27, whereas increased acetylation upon Sirt2 loss impairs their interaction [14, 35]. To this end, following Cdc27 immunoprecipitation, decreased interaction of both Cdc20 and Cdh1 was detected in MCF-7 cells knocked-down for NQO1 as compared to control cells, whereas no difference was observed with regards to other components of the protein complex (Fig. 5A). Furthermore, NQO1 was found to be associated with the APC/C complex following Cdc27 immunoprecipitation (Supplementary Fig. 4A). Given that protein-protein interaction between the co-factors and Cdc27 is negatively regulated by acetylation, we wanted to check whether NQO1 affects protein acetylation through its role in regulating SIRT2 activity. Decreased interaction between Cdh1 and Cdc27 was associated with increased Cdh1 acetylation upon NQO1 knockdown (Fig. 5B, C). Moreover, we couldn’t detect interaction between Cdh1 and SIRT2 upon NQO1 knockdown, which is consistent with the negative role of Cdh1 acetylation in the formation of the APC/C complex (Supplementary Fig. 4B). All together, these results imply that decreased SIRT2 deacetylation activity underlies the effect of NQO1 knockdown on APC/C complex.
Figure 5:

NQO1-SIRT2 axis regulates APC/C complex during mitosis. (A) Cell extracts from control shRNA (sh ctr) and NQO1 shRNA (sh NQO1) MCF-7 cells were used to immunoprecipitate endogenous Cdc27. Interaction with several components of the APC/C complex was determined by western blotting using the indicated antibodies. Specificity was confirmed by using species-matched control IgG as a negative control. Input levels of the interacting proteins are shown (right). (B) MCF-7 cells overexpressing HA-Cdh1 were transfected with either control (ctr) siRNA or NQO1 siRNA followed by immunoprecipitation using an anti-acetylated lysine antibody (Ac-K). Acetylated levels of Cdh1 were checked by western blotting using an anti-HA antibody. Specificity was confirmed by using species-matched control IgG as a negative control. In parallel, immunoprecipitation with an antibody against Cdc27 was performed to check interaction between Cdc27 and Cdh1. Input levels of both Cdc27 and NQO1 are shown. (C) MCF-7 cells were transfected with either control (ctr) siRNA or NQO1 siRNA followed by immunoprecipitation using an anti-acetylated lysine antibody (Ac-K). Acetylated levels of endogenous Cdh1 were checked by western blotting using an anti-Cdh1 antibody. Specificity was confirmed by using species-matched control IgG as a negative control. In parallel, immunoprecipitation with an antibody against Cdc27 was performed to check interaction between Cdc27 and Cdh1. Input levels of Cdh1, Cdc27 and NQO1 are shown. (D) Western blot analysis in whole cell lysates MCF-7 cells transfected with either control (ctr) siRNA or NQO1 siRNA. Antibodies against well–established mitotic proteins including Aurora A, Cyclin B1 and Cdc20 were used. Mitotic cells following nocodazole treatment were collected by shake-off, replated and harvested at indicated time points. Protein levels of SIRT2, NQO1 and actin are shown. (E) Quantification of Aurora A protein levels in (D) using the ImageJ software is presented. (F) For in vivo ubiquitination assay, Myc-Aurora A and HA-Ubiquitin were co-transfected into control shRNA (sh ctr) and NQO1 shRNA (sh NQO1) MCF-7 cells. To block proteasomal degradation, cells were treated with MG132 (10 µM, 4 h). Aurora A was immunoprecipitated using an anti-Myc antibody followed by western blotting against HA to detect ubiquitinated levels of Aurora A. Levels of NQO1 and actin are shown. (G) A similar in vivo ubiquitination assay was performed in MCF-7 cells transfected with either a control (ctr) vector or a Flag-NQO1 vector. Aurora A was immunoprecipitated using an anti-Myc antibody followed by western blotting against HA to detect ubiquitinated levels of Aurora A. Levels of Flag-NQO1 and actin are shown.
The interaction between Cdc27 and co-activators plays an important role in activation of APC/C which marks several cell cycle protein during mitosis for ubiquitin-mediated degradation by the 26S proteasome. This prompted us to check whether NQO1 inhibition impairs APC/C activity as a result of the observed defect in APC/C complex formation. Towards this end, we performed further analysis and detected increased levels of multiple mitotic regulators, including Aurora-A, Cyclin B1 and Cdc20 (an APC/C-Cdh1specific substrate), after cells were released from mitosis in NQO1 knocked down cells as compared to control cells (Fig 5D, E). Since NQO1 inhibition decreases the protein levels of mitotic regulators and NQO1 regulates the APC/C-Cdh1 interaction, we used an in vivo ubiquitination assay to directly assess APC/C activity. Control and NQO1 knocked-down MCF-7 cells were co-transfected with myc-tagged Aurora-A and hemagglutinin (HA)-ubiquitin plasmids. Following treatment with the proteasome inhibitor MG132, immunoprecipitated Aurora-A showed enhanced ubiquitination in the control cells whereas ubiquitinated levels were decreased in shNQO1 cells (Fig. 5F). Notably, NQO1 was found to interact with Aurora A under these experimental conditions confirming that it is part of the complex regulating Aurora A ubiquitination (Supplementary Fig. 4C). Conversely, NQO1 expression in cells co-transfected with myc-tagged Aurora-A and hemagglutinin (HA)-ubiquitin plasmids resulted in increased Aurora-A ubiquitination following treatment with MG-132. Collectively, these result suggest that the mitotic defects observed in cells upon NQO1 inhibition might be due to impaired APC/C activity as NQO1-SIRT2 axis plays a regulatory role on both formation and activity of the complex.
NQO1-SIRT2 axis regulates checkpoint activation and response to mitotic stress
Compounds inducing mitotic arrest represent one of the most important classes of cancer drugs [36] used in the treatment of different types of cancer including breast, lung and pancreatic cancer. The underlying mechanism involves the activation of the spindle assembly checkpoint (SAC), whereas prolonged delay in mitosis has been positively associated with increased sensitivity [37]. Given that APC/C inhibition is a requirement for successful SAC-induced mitotic arrest, and can negatively affect mitotic progression, we examined the contribution of NQO1-SIRT2 axis in this context. To this end, nocodazole was, first, used as a mitotic stressor based on its function in causing mitotic stress without affecting DNA damage checkpoints. MCF-7 cells treated with nocodazole for various times exhibited increased mitotic index (MI) as compared to untreated cells indicating mitotic arrest as a cellular response. Consistent with the role of NQO1 inhibition in delaying mitotic progression under normal conditions (Fig. 4), NQO1-knockdown enhanced the response to nocodazole treatment (Fig. 6A) by increasing the MI. More importantly, NQO1 inhibition reversed the effect of SIRT2 overexpression in decreasing the MI upon nocodazole treatment (Fig. 6B). In further support, breast cancer cells expressing NQO1 exhibited decreased MI upon nocodazole treatment as compared to breast cancer cells with low endogenous NQO1 levels (Supplementary Fig. 1A and 5A). Provided these results, we wanted to examine whether the increased mitotic arrest in NQO1 knocked down cells will affect sensitivity in response to nocodazole treatment by checking the survival of cells in chronic mortality assays. Following removal of the drug after treatment for the various times as indicated in Figure 6C, number of colonies formed was scored after 14 days. As shown (Fig. 6C), NQO1 suppression enhanced sensitivity to nocodazole for treatment times exceeding 24 hours which could be the result of an increase in mitotic arrest.
Figure 6:
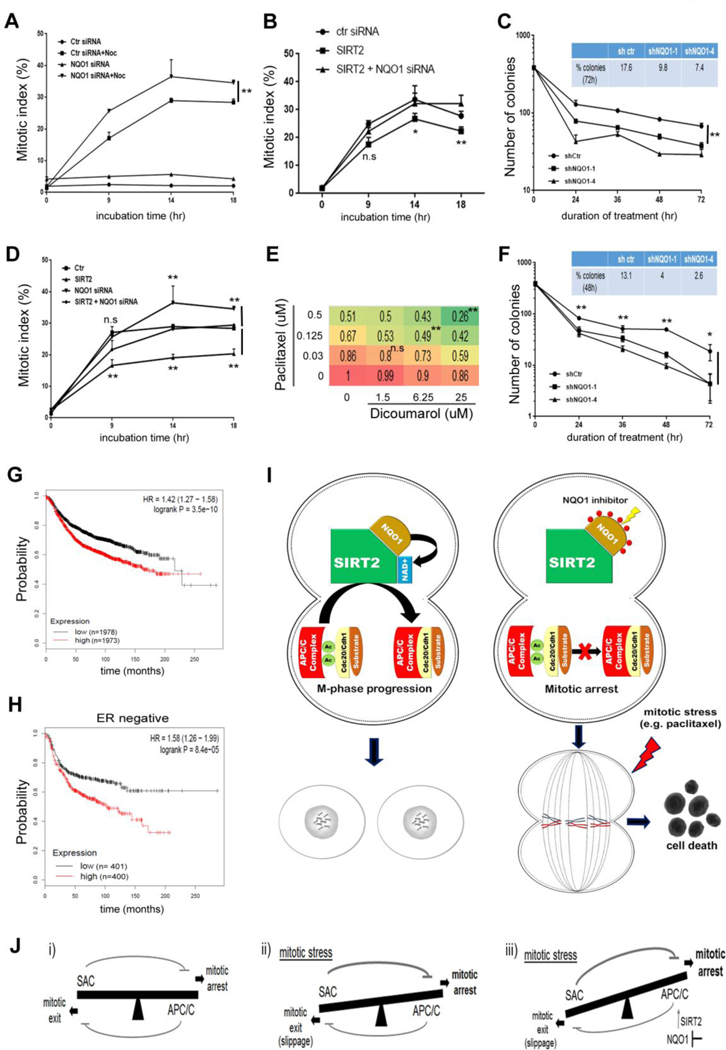
NQO1 inhibition sensitizes cancer cells to mitotic stress. (A) Mitotic index in nocodazole (400 nM) treated control and NQO1 siRNA MCF-7 cells as well as untreated cells. Mitotic index values are compared at different time points. ** P<0.01. (B) Mitotic index in nocodazole treated control, SIRT2 overexpressing (SIRT2) and SIRT2 overexpressing cells followed by NQO1 siRNA (SIRT2 + NQO1 siRNA) MCF-7 cells. Mitotic index values are compared at different time points between SIRT2 and SIRT2 + NQO1 siRNA cells. n.s not-significant, * P<0.05, ** P<0.01. (C) Chronic mortality assay in control (shctr) and NQO1 knocked down MCF-7 cells (shNQO1–1, shNQO1–4) following treatment with nocodazole for the indicated times. ** P<0.01. (D) Mitotic index in paclitaxel (20 nM) treated control, NQO1 siRNA, SIRT2 overexpressing (SIRT2) and SIRT2 overexpressing cells followed by NQO1 siRNA (SIRT2 + NQO1 siRNA) MCF-7 cells. Mitotic index values are compared at different time points between control and NQO1 siRNA cells as well as SIRT2 and SIRT2 + NQO1 siRNA cells. n.s not-significant, ** P<0.01. (E) BxPC3 cells were treated with increasing concentrations of paclitaxel and dicoumarol as indicated. Cell viability was assessed using the membrane-permeable dye Calcein AM. A heat map was made based on the fraction of viable cells (numbers) as compared to untreated cells. n.s not-significant. ** P<0.01. (F) Chronic mortality assay in control (shctr) and NQO1 knocked down MCF-7 cells (shNQO1–1, shNQO1–4) following treatment with paclitaxel for the indicated times. * P<0.05, ** P<0.01. (G, H) Kaplan-Meier analysis of the prognostic value of NQO1 expression in (G) all breast cancer patients and (H) ER-negative patients. (I) Proposed model regarding the effect of NQO1-SIRT2 axis on regulating mitotic progression through APC/C complex. (J) The interplay between the spindle assembly checkpoint (SAC) and APC/C is crucial for the response of cancer cells to mitotic stress. (i) High SAC activity drives mitotic arrest (though inhibiting APC/C) whereas high APC/C activity drives mitotic exit (through inhibiting SAC). (ii) Under mitotic stress, SAC activity remains high which is required for efficient APC/C inhibition, and mitotic arrest. APC/C activity is not fully inhibited which may eventually contribute to SAC inhibition, escape from mitotic arrest, mitotic slippage and resistance to anti-mitotic drugs. (iii) Given that NQO1-SIRT2 is a positive regulator of APC/C, NQO1 inhibition tips the balance towards APC/C inhibition and enhanced mitotic arrest which may confer sensitivity to microtubule poisons.
Enhanced sensitivity under conditions of mitotic stress may directly affect response of cancer cells to chemotherapeutic drugs that function through inducing mitotic stress. For this, we sought to examine the contribution of NQO1-SIRT2 axis in response to paclitaxel treatment (Fig. 6D). In accordance with previous results, we detected an increase in MI when NQO1 was knocked down. Furthermore, we confirmed that the negtive effect of SIRT2 overexpression in mitotic arrest was abolished following genetic inhibition of NQO1. As observed previously with nocodazole treatment, NQO1 levels negatively correlated with MI in presence of paclitaxel (Supplementary Fig. 5B). To determine whether the effect on mitotic arrest could determine sensitivity to paclitaxel treatment, both cell viability and chronic mortality assays were employed. Co-treatment of cells with paclitaxel and dicoumarol (NQO1 inhibitor) significantly decreased cell viability as opposed to paclitaxel alone (Fig. 6E and Supplementary Fig. 5C). Interestingly, increased NQO1 protein levels were detected in response to paclitaxel treatment (Supplementary Fig. 5D), justifying the potential use of NQO1 as a pharmacological target in this context. More importantly, NQO1 knockdown decreased the number of colonies formed following treatment with paclitaxel in chronic mortality assays (Fig. 6F). Of note, clinical data analysis shows that higher mRNA expression of NQO1 is associated with poor outcome as evident by the decreased recurrence–free survival of breast cancer patients, including ER-negative breast cancer patients (Fig. 6G, H and Supplementary Fig. 5E–H). Provided that recurrence results from lack of response to drug treatment, these findings further emphasize the potential therapeutic potential of NQO1 inhibition towards improving treatment outcomes by, at least to some extent, increasing sensitivity to anti-mitotic drugs.
DISCUSSION
Several previous studies have shown that SIRT2 plays a significant role in mitosis by unveiling downstream pathways/targets involved [9, 11, 14, 17]. In contrast to this, much less is known about upstream regulators that may control its catalytic activity and functions. In this study, we provide evidence that NQO1 is an upstream regulator of SIRT2 (proposed model is summarized in Fig. 6I). NQO1 directly interacts with SIRT2 and regulates its activity by functioning as an NAD(P)H dehydrogenase and providing NAD+, which is a required co-factor for SIRT2. The strong protein-protein interaction and co-localization of the two proteins during mitosis imply a novel role for NQO1 during this phase of the cell cycle which provides a mechanistic understanding of its unexplored, up to date, localization in the mitotic spindle [28, 38]. In this regard, NQO1 could be involved in regulating acetylation status of SIRT2–specific targets including Cdc20 and Cdh1. Consistent with this, our results show that NQO1 inhibition perturbs proper APC/C complex formation due to acetylation-mediated impaired interaction between Cdc20/Cdh1 and Cdc27. This negatively affects APC/C complex activity as revealed by decreased ubiquitination of mitotic proteins. Therefore, mitotic defects observed upon NQO1 inhibition by using live-cell imaging could be explained provided the regulatory role of NQO1/SIRT2 axis in progression of mitosis. Intriguingly, our results showing that treatment with nicotinamide mononucleotide (NMN), an NAD+ precursor, alleviates the observed mitotic defects in NQO1 knocked down cells, underscore the dependency of the NQO1-SIRT2 interplay on NAD.
APC/C is a 13-subunit ubiquitin ligase that initiates the metaphase–anaphase transition and mitotic exit by targeting proteins such as securing and cyclin B1 for ubiquitin-dependent destruction by the proteasome. Because delaying or blocking mitotic exit is considered an effective approach to induce cell death, mitosis and APC/C, more specifically, have been targeted for therapeutic benefit [37, 39]. Given the observed delay in mitotic completion upon NQO1 inhibition under normal conditions, which could be explained through the effect on SIRT2-regulated APC/C activity, we sought to determine the response of cancer cells under mitotic stress. Here, we show that NQO1 inhibition in cancer cells increases sensitivity to anti-mitotic drugs functioning as microtubule poisons. The observed increase in cells arrested in mitosis might be attributed to decreased SIRT2 activity and, concomitantly, decreased APC/C complex activity upon NQO1 inhibition. Therefore, a prolonged delay in mitosis could allow cells to accumulate cell death signals and prevent mitotic slippage which is thought to be one of the main mechanisms of resistance against anti-mitotic drugs.
Drugs that inhibit microtubule dynamics activate the spindle assembly checkpoint (SAC) that delays mitosis through inhibiting APC/C to provide cells with additional time to resolve errors in microtubule-kinetochore attachment [40]. Nevertheless, SAC does not fully inhibit the APC/C during normal division, as residual activity is required to allow mitotic exit by eventually inactivating the SAC [41]. In a similar manner, during mitotic stress in presence of nocodazole (through blocking polymerization of tubulin) or paclitaxel (through stabilizing microtubules), SAC activation remains above the rate at which the APC/C inactivates the SAC, thereby preventing mitotic progression. However, residual APC/C activity may inactivate SAC and induce mitotic slippage, thus affecting duration of mitotic arrest and response to anti-mitotic drugs. In this context, it is reasonable to propose, that NQO1 inhibition through decreasing SIRT2 activity enhances the inhibitory effect of SAC on APC/C activity (Fig. 6J). Therefore, tipping the balance towards APC/C inhibition and preventing mitotic slippage may provide the underlying mechanism for the increased sensitivity to anti-mitotic drugs upon NQO1 inhibition.
Although NQO1 is not considered as an essential protein/gene for mitosis, we propose that it may fine tune SIRT2 activity and responses to mitotic stress. Loss of essential genes is associated with developmental defects. For example, mutant embryos lacking Cdh1, the APC/C complex regulator, die at E9.5–E10.5 due to mitotic defects [42]. On the contrary, Sirt2-/- mice do not exhibit any developmental effects even though we showed previously that SIRT2 regulates APC/C activity through deacetylation of Cdc20/Cdh1 [14]. With this in mind, it is not surprising that Nqo1-/- mice are developmentally normal, despite the regulatory role of NQO1 on APC/C activity through SIRT2. We believe that it is expected that deletion of genes resulting in decreased activity of APC/C has less severe effects compared to deletion of genes essential for mitosis such as components of the APC/C complex that may result in complete deactivation of the APC/C complex. This is further supported by the finding that Cdh1+/- mice, where APC/C activity is not completely lost, do not show any developmental abnormalities [42]. However the role of regulatory genes/proteins might be more evident under stressful conditions where APC/C activity drives cellular responses. For this reason, based on our results, we propose that the NQO1/SIRT2 axis may affect cellular outcomes in response to mitotic stress.
Notably, NQO1 has attracted growing interest from a therapeutic perspective. Its role in bioactivating quinone prodrugs, such as β-lapachone, has been recently exploited in cancer cells. To this end, it has been shown that cells expressing high levels of NQO1 can be selectively killed with β-lapachone monotherapy or combined therapy with PARP inhibitors [23, 24]. In addition to these studies, our results underscore that NQO1 could be used as a therapeutic target or a biomarker for response and resistance to anti-mitotic drugs based on its new role in regulating mitosis. Although targeting mitosis and mitotic exit has been theoretically plausible for therapeutic purposes, failure to discriminate between cancer and normal proliferating cells often causes toxic side effects. With regards to this, NQO1 inhibition may provide an opportunity to specifically target mitosis in cancer cells while not affecting normal cells given the low NQO1 expression in normal tissues as opposed to its high expression in tumors (Supplementary Fig. 5E–G). Furthermore, based on the heterogeneity with regards to NQO1 expression among tumors within the same cancer type (Supplementary Fig. 5E–G) and our previous results, it is reasonable to suggest that NQO1 low expressing tumors might be more sensitive to anti-mitotic drugs implying a new possible role for NQO1 as a predictive biomarker for drug response.
Further highlighting the emerging roles of NQO1 in cancer, a recent study revealed that NQO1 confers the tamoxifen-resistance phenotype in ER-positive breast cancers cells [43]. Although the underlying mechanism is still obscure, NQO1 showed to drive an enhanced mitochondrial metabolic phenotype which rendered breast cancer cells more resistant to tamoxifen treatment. This hypothesis was supported by analyzing clinical data showing that higher levels of NQO1 mRNA strongly predicted patient relapse in high-risk ER-positive breast cancer patients receiving endocrine therapy. Following a similar approach, our analysis shows that NQO1 has significant prognostic value in other types of breast cancer (Fig. 6G, H and Supplementary Fig. 5H). For example, high NQO1 expression is associated with reduced relapse-free survival in ER-negative tumors. As these aggressive tumors are characterized by a lack of response to chemotherapy including anti-mitotic drugs, this finding might be indicative of a clinical association with treatment resistance which is not limited to tamoxifen. Thus, elevated levels of NQO1 could contribute to resistance to microtubule poisons, such as paclitaxel, that might provide the basis for novel therapeutic strategies to inhibit NQO1 and increase sensitivity to standard treatments.
In summary, our study identifies NQO1 as a novel upstream regulator of SIRT2. By directly modulating NAD+ levels, it directs SIRT2 activity during mitosis in a mechanistically distinct way compared to Cyclin E-Cdk2 which regulates SIRT2 activity through phosphorylating Ser-331 [16, 17]. More importantly, the NQO1-SIRT2 axis regulates normal progression of mitosis by modulating APC/C activity as well as response to mitotic stress imposed by microtubule poisons. These findings reveal a new role for NQO1 in cancer, which can explain, at least to some extent, why high NQO1 expression is associated with poor outcome of cancer patients. More importantly, our study opens up new therapeutic opportunities targeting NQO1 as a means to increase sensitivity to anti-mitotic drugs that are currently used as standard care in the clinic.
Supplementary Material
HIGHLIGHTS.
NQO1 is an upstream positive regulator of SIRT2 activity by providing NAD+
NQO1 colocalizes with SIRT2 during mitosis and regulates mitotic progression
SIRT2-directed acetylation status of APC/C complex provides the mechanistic link
The NQO1/SIRT2 axis affects response of cancer cells to anti-mitotic compounds/drugs
ACKNOWLEDGMENTS
We would like to thank the members of the Vassilopoulos lab for critically reading the manuscript. Also, we would like to thank the staff of the Center for Advanced Microscopy for their assistance with our experiments. Imaging work was performed at the Northwestern University Center for Advanced Microscopy generously supported by NCI CCSG P30 CA060553 awarded to the Robert H. Lurie Comprehensive Cancer Center.
FINANCIAL SUPPORT
A. Vassilopoulos was supported by R01CA182506-01A1, a Lefkofsky Family Foundation Innovation Research Award and the Lynn Sage Foundation.
Footnotes
Publisher's Disclaimer: This is a PDF file of an unedited manuscript that has been accepted for publication. As a service to our customers we are providing this early version of the manuscript. The manuscript will undergo copyediting, typesetting, and review of the resulting proof before it is published in its final citable form. Please note that during the production process errors may be discovered which could affect the content, and all legal disclaimers that apply to the journal pertain.
The authors declare that there are no conflicts of interest
REFERENCES
- 1.Rine J, Strathern JN, Hicks JB, Herskowitz I. A suppressor of mating-type locus mutations in Saccharomyces cerevisiae: evidence for and identification of cryptic mating-type loci. Genetics 1979; 93: 877–901. doi: [DOI] [PMC free article] [PubMed] [Google Scholar]
- 2.Kaeberlein M, McVey M, Guarente L. The SIR2/3/4 complex and SIR2 alone promote longevity in Saccharomyces cerevisiae by two different mechanisms. Genes Dev 1999; 13: 2570–80. doi: [DOI] [PMC free article] [PubMed] [Google Scholar]
- 3.Finkel T, Deng CX, Mostoslavsky R. Recent progress in the biology and physiology of sirtuins. Nature 2009; 460: 587–91. doi: 10.1038/nature08197. [DOI] [PMC free article] [PubMed] [Google Scholar]
- 4.Vassilopoulos A, Fritz KS, Petersen DR, Gius D. The human sirtuin family: evolutionary divergences and functions. Hum Genomics 2011; 5: 485–96. doi: [DOI] [PMC free article] [PubMed] [Google Scholar]
- 5.Choudhary C, Weinert BT, Nishida Y, Verdin E, Mann M. The growing landscape of lysine acetylation links metabolism and cell signalling. Nat Rev Mol Cell Biol 2014; 15: 536–50. doi: 10.1038/nrm3841. [DOI] [PubMed] [Google Scholar]
- 6.Choudhary C, Kumar C, Gnad F, Nielsen ML, Rehman M, Walther TC, Olsen JV, Mann M. Lysine acetylation targets protein complexes and co-regulates major cellular functions. Science 2009; 325: 834–40. doi: 10.1126/science.1175371. [DOI] [PubMed] [Google Scholar]
- 7.Houtkooper RH, Pirinen E, Auwerx J. Sirtuins as regulators of metabolism and healthspan. Nat Rev Mol Cell Biol 2012; 13: 225–38. doi: 10.1038/nrm3293. [DOI] [PMC free article] [PubMed] [Google Scholar]
- 8.North BJ, Marshall BL, Borra MT, Denu JM, Verdin E. The human Sir2 ortholog, SIRT2, is an NAD+-dependent tubulin deacetylase. Mol Cell 2003; 11: 437–44. doi: [DOI] [PubMed] [Google Scholar]
- 9.Vaquero A, Scher MB, Lee DH, Sutton A, Cheng HL, Alt FW, Serrano L, Sternglanz R, Reinberg D. SirT2 is a histone deacetylase with preference for histone H4 Lys 16 during mitosis. Genes Dev 2006; 20: 1256–61. doi: 10.1101/gad.1412706. [DOI] [PMC free article] [PubMed] [Google Scholar]
- 10.Dryden SC, Nahhas FA, Nowak JE, Goustin AS, Tainsky MA. Role for human SIRT2 NAD-dependent deacetylase activity in control of mitotic exit in the cell cycle. Mol Cell Biol 2003; 23: 3173–85. doi: [DOI] [PMC free article] [PubMed] [Google Scholar]
- 11.Inoue T, Hiratsuka M, Osaki M, Yamada H, Kishimoto I, Yamaguchi S, Nakano S, Katoh M, Ito H, Oshimura M. SIRT2, a tubulin deacetylase, acts to block the entry to chromosome condensation in response to mitotic stress. Oncogene 2007; 26: 945–57. doi: 10.1038/sj.onc.1209857. [DOI] [PubMed] [Google Scholar]
- 12.Inoue T, Nakayama Y, Yamada H, Li YC, Yamaguchi S, Osaki M, Kurimasa A, Hiratsuka M, Katoh M, Oshimura M. SIRT2 downregulation confers resistance to microtubule inhibitors by prolonging chronic mitotic arrest. Cell Cycle 2009; 8: 1279–91. doi: 10.4161/cc.8.8.8245. [DOI] [PubMed] [Google Scholar]
- 13.North BJ, Verdin E. Interphase nucleo-cytoplasmic shuttling and localization of SIRT2 during mitosis. PLoS One 2007; 2: e784. doi: 10.1371/journal.pone.0000784. [DOI] [PMC free article] [PubMed] [Google Scholar]
- 14.Kim HS, Vassilopoulos A, Wang RH, Lahusen T, Xiao Z, Xu X, Li C, Veenstra TD, Li B, Yu H, Ji J, Wang XW, Park SH, et al. SIRT2 maintains genome integrity and suppresses tumorigenesis through regulating APC/C activity. Cancer Cell 2011; 20: 487–99. doi: 10.1016/j.ccr.2011.09.004. [DOI] [PMC free article] [PubMed] [Google Scholar]
- 15.North BJ, Rosenberg MA, Jeganathan KB, Hafner AV, Michan S, Dai J, Baker DJ, Cen Y, Wu LE, Sauve AA, van Deursen JM, Rosenzweig A, Sinclair DA. SIRT2 induces the checkpoint kinase BubR1 to increase lifespan. EMBO J 2014; 33: 1438–53. doi: 10.15252/embj.201386907. [DOI] [PMC free article] [PubMed] [Google Scholar]
- 16.Pandithage R, Lilischkis R, Harting K, Wolf A, Jedamzik B, Luscher-Firzlaff J, Vervoorts J, Lasonder E, Kremmer E, Knoll B, Luscher B. The regulation of SIRT2 function by cyclin-dependent kinases affects cell motility. J Cell Biol 2008; 180: 915–29. doi: 10.1083/jcb.200707126. [DOI] [PMC free article] [PubMed] [Google Scholar]
- 17.North BJ, Verdin E. Mitotic regulation of SIRT2 by cyclin-dependent kinase 1-dependent phosphorylation. J Biol Chem 2007; 282: 19546–55. doi: 10.1074/jbc.M702990200. [DOI] [PubMed] [Google Scholar]
- 18.Movahedi Naini S, Sheridan AM, Force T, Shah JV, Bonventre JV. Group IVA Cytosolic Phospholipase A2 Regulates the G2-to-M Transition by Modulating the Activity of Tumor Suppressor SIRT2. Mol Cell Biol 2015; 35: 3768–84. doi: 10.1128/MCB.00184-15. [DOI] [PMC free article] [PubMed] [Google Scholar]
- 19.Dinkova-Kostova AT, Talalay P. Persuasive evidence that quinone reductase type 1 (DT diaphorase) protects cells against the toxicity of electrophiles and reactive forms of oxygen. Free Radic Biol Med 2000; 29: 231–40. doi: [DOI] [PubMed] [Google Scholar]
- 20.Lind C, Cadenas E, Hochstein P, Ernster L. DT-diaphorase: purification, properties, and function. Methods Enzymol 1990; 186: 287–301. doi: [DOI] [PubMed] [Google Scholar]
- 21.Siegel D, Gustafson DL, Dehn DL, Han JY, Boonchoong P, Berliner LJ, Ross D. NAD(P)H:quinone oxidoreductase 1: role as a superoxide scavenger. Mol Pharmacol 2004; 65: 1238–47. doi: 10.1124/mol.65.5.1238. [DOI] [PubMed] [Google Scholar]
- 22.Asher G, Tsvetkov P, Kahana C, Shaul Y. A mechanism of ubiquitin-independent proteasomal degradation of the tumor suppressors p53 and p73. Genes Dev 2005; 19: 316–21. doi: 10.1101/gad.319905. [DOI] [PMC free article] [PubMed] [Google Scholar]
- 23.Bey EA, Bentle MS, Reinicke KE, Dong Y, Yang CR, Girard L, Minna JD, Bornmann WG, Gao J, Boothman DA. An NQO1- and PARP-1-mediated cell death pathway induced in non-small-cell lung cancer cells by beta-lapachone. Proc Natl Acad Sci U S A 2007; 104: 11832–7. doi: 10.1073/pnas.0702176104. [DOI] [PMC free article] [PubMed] [Google Scholar]
- 24.Huang X, Motea EA, Moore ZR, Yao J, Dong Y, Chakrabarti G, Kilgore JA, Silvers MA, Patidar PL, Cholka A, Fattah F, Cha Y, Anderson GG, et al. Leveraging an NQO1 Bioactivatable Drug for Tumor-Selective Use of Poly(ADP-ribose) Polymerase Inhibitors. Cancer Cell 2016; 30: 940–52. doi: 10.1016/j.ccell.2016.11.006. [DOI] [PMC free article] [PubMed] [Google Scholar]
- 25.Radjendirane V, Joseph P, Lee YH, Kimura S, Klein-Szanto AJ, Gonzalez FJ, Jaiswal AK. Disruption of the DT diaphorase (NQO1) gene in mice leads to increased menadione toxicity. J Biol Chem 1998; 273: 7382–9. doi: [DOI] [PubMed] [Google Scholar]
- 26.Shen J, Barrios RJ, Jaiswal AK. Inactivation of the quinone oxidoreductases NQO1 and NQO2 strongly elevates the incidence and multiplicity of chemically induced skin tumors. Cancer Res 2010; 70: 1006–14. doi: 10.1158/0008-5472.CAN-09-2938. [DOI] [PMC free article] [PubMed] [Google Scholar] [Retracted]
- 27.Gaikwad A, Long DJ 2nd, Stringer JL, Jaiswal AK. In vivo role of NAD(P)H:quinone oxidoreductase 1 (NQO1) in the regulation of intracellular redox state and accumulation of abdominal adipose tissue. J Biol Chem 2001; 276: 22559–64. doi: 10.1074/jbc.M101053200. [DOI] [PubMed] [Google Scholar]
- 28.Siegel D, Kepa JK, Ross D. NAD(P)H:quinone oxidoreductase 1 (NQO1) localizes to the mitotic spindle in human cells. PLoS One 2012; 7: e44861. doi: 10.1371/journal.pone.0044861. [DOI] [PMC free article] [PubMed] [Google Scholar]
- 29.Song HY, Biancucci M, Kang HJ, O’Callaghan C, Park SH, Principe DR, Jiang H, Yan Y, Satchell KF, Raparia K, Gius D, Vassilopoulos A. SIRT2 deletion enhances KRAS-induced tumorigenesis in vivo by regulating K147 acetylation status. Oncotarget 2016; 7: 80336–49. doi: 10.18632/oncotarget.12015. [DOI] [PMC free article] [PubMed] [Google Scholar]
- 30.Lanczky A, Nagy A, Bottai G, Munkacsy G, Szabo A, Santarpia L, Gyorffy B. miRpower: a web-tool to validate survival-associated miRNAs utilizing expression data from 2178 breast cancer patients. Breast Cancer Res Treat 2016; 160: 439–46. doi: 10.1007/s10549-016-4013-7. [DOI] [PubMed] [Google Scholar]
- 31.Uddin GM, Youngson NA, Doyle BM, Sinclair DA, Morris MJ. Nicotinamide mononucleotide (NMN) supplementation ameliorates the impact of maternal obesity in mice: comparison with exercise. Sci Rep 2017; 7: 15063. doi: 10.1038/s41598-017-14866-z. [DOI] [PMC free article] [PubMed] [Google Scholar]
- 32.Uddin GM, Youngson NA, Sinclair DA, Morris MJ. Head to Head Comparison of Short-Term Treatment with the NAD(+) Precursor Nicotinamide Mononucleotide (NMN) and 6 Weeks of Exercise in Obese Female Mice. Front Pharmacol 2016; 7: 258. doi: 10.3389/fphar.2016.00258. [DOI] [PMC free article] [PubMed] [Google Scholar]
- 33.Yoshino J, Baur JA, Imai SI. NAD(+) Intermediates: The Biology and Therapeutic Potential of NMN and NR. Cell Metab 2018; 27: 513–28. doi: 10.1016/j.cmet.2017.11.002. [DOI] [PMC free article] [PubMed] [Google Scholar]
- 34.Pines J The APC/C: a smorgasbord for proteolysis. Mol Cell 2009; 34: 135–6. doi: 10.1016/j.molcel.2009.04.006. [DOI] [PubMed] [Google Scholar]
- 35.Park SH, Zhu Y, Ozden O, Kim HS, Jiang H, Deng CX, Gius D, Vassilopoulos A. SIRT2 is a tumor suppressor that connects aging, acetylome, cell cycle signaling, and carcinogenesis. Transl Cancer Res 2012; 1: 15–21. doi: [PMC free article] [PubMed] [Google Scholar]
- 36.Dumontet C, Jordan MA. Microtubule-binding agents: a dynamic field of cancer therapeutics. Nat Rev Drug Discov 2010; 9: 790–803. doi: 10.1038/nrd3253. [DOI] [PMC free article] [PubMed] [Google Scholar]
- 37.Manchado E, Guillamot M, Malumbres M. Killing cells by targeting mitosis. Cell Death Differ 2012; 19: 369–77. doi: 10.1038/cdd.2011.197. [DOI] [PMC free article] [PubMed] [Google Scholar]
- 38.Siegel D, Dehn DD, Bokatzian SS, Quinn K, Backos DS, Di Francesco A, Bernier M, Reisdorph N, de Cabo R, Ross D. Redox modulation of NQO1. PLoS One 2018; 13: e0190717. doi: 10.1371/journal.pone.0190717. [DOI] [PMC free article] [PubMed] [Google Scholar]
- 39.Sackton KL, Dimova N, Zeng X, Tian W, Zhang M, Sackton TB, Meaders J, Pfaff KL, Sigoillot F, Yu H, Luo X, King RW. Synergistic blockade of mitotic exit by two chemical inhibitors of the APC/C. Nature 2014; 514: 646–9. doi: 10.1038/nature13660. [DOI] [PMC free article] [PubMed] [Google Scholar]
- 40.Alfieri C, Chang L, Zhang Z, Yang J, Maslen S, Skehel M, Barford D. Molecular basis of APC/C regulation by the spindle assembly checkpoint. Nature 2016; 536: 431–6. doi: 10.1038/nature19083. [DOI] [PMC free article] [PubMed] [Google Scholar]
- 41.Zeng X, Sigoillot F, Gaur S, Choi S, Pfaff KL, Oh DC, Hathaway N, Dimova N, Cuny GD, King RW. Pharmacologic inhibition of the anaphase-promoting complex induces a spindle checkpoint-dependent mitotic arrest in the absence of spindle damage. Cancer Cell 2010; 18: 382–95. doi: 10.1016/j.ccr.2010.08.010. [DOI] [PMC free article] [PubMed] [Google Scholar]
- 42.Garcia-Higuera I, Manchado E, Dubus P, Canamero M, Mendez J, Moreno S, Malumbres M. Genomic stability and tumour suppression by the APC/C cofactor Cdh1. Nat Cell Biol 2008; 10: 802–11. doi: 10.1038/ncb1742. [DOI] [PubMed] [Google Scholar]
- 43.Fiorillo M, Sotgia F, Sisci D, Cappello AR, Lisanti MP. Mitochondrial “power” drives tamoxifen resistance: NQO1 and GCLC are new therapeutic targets in breast cancer. Oncotarget 2017; 8: 20309–27. doi: 10.18632/oncotarget.15852. [DOI] [PMC free article] [PubMed] [Google Scholar]
- 44.Siegel D, Anwar A, Winski SL, Kepa JK, Zolman KL, Ross D. Rapid polyubiquitination and proteasomal degradation of a mutant form of NAD(P)H:quinone oxidoreductase 1. Mol Pharmacol 2001; 59: 263–8. doi: [DOI] [PubMed] [Google Scholar]
Associated Data
This section collects any data citations, data availability statements, or supplementary materials included in this article.