Abstract
Plane-wave ultrasound contrast imaging offers faster, less destructive means for imaging microbubbles compared to traditional ultrasound imaging. Despite many of the most acoustically responsive microbubbles having resonant frequencies in the lower MHz range, higher frequencies (>3 MHz) have typically been employed to achieve high spatial resolution. In this work we implement and optimize low-frequency (1.5–4 MHz) plane-wave pulse inversion imaging on a commercial, phased-array imaging transducer in vitro and demonstrate its use in vivo by imaging a mouse xenograft model. We found that the 1.8 MHz contrast signal was ~4 times that acquired at 3.1 MHz on matched probes and 9 times greater than echoes received on a higher frequency probe. Low frequency imaging was also much more resilient to motion. In vivo, we could identify sub-mm vasculature inside a xenograft tumor model and easily assess microbubble half-life. Our results indicate that low frequency imaging can provide better signal to noise due to generating stronger non-linear responses. Combined with high-speed plane-wave imaging, this method could open the door to super-resolution imaging at depth, while high power pulses could be used for image-guided therapeutics.
Keywords: Ultrasound, microbubble, contrast imaging, pulse inversion, low-frequency
Introduction
Plane-wave ultrasound (US) imaging is becoming increasingly common due to improvements in computational power and availability of programmable ultrasound systems, opening new doors in US imaging and therapeutics. In conventional US imaging, select elements are activated to generate a focused beam (scan line), which is then steered across the imaging plane, acquiring data at each location in a line-by-line manner. The full image is then reconstructed from the entire series of acquisitions. In plane-wave imaging (as well as diverging wave), all elements are recruited to produce a coherent plane-wave, illuminating the entire imaging field, and the echoes are detected and parallel beamformed by all elements (Montaldo et al. 2009). Whereas conventional imaging can take up to hundreds of acquisitions to generate a single image, limiting the frame rate to tens of hertz, plane-wave imaging can produce an image from a single acquisition, allowing for frame rates in the kHz range (Couture et al. 2009). Plane-wave imaging (as well as diverging-wave imaging) has been implemented in applications with high temporal resolution demands such as echocardiography (Hasegawa and Kanai 2011; Papadacci et al. 2014). The unfocused plane-wave generates fewer pulses and lower peak-negative pressures (PNP), making it well suited for contrast imaging, since reduced PNP minimizes microbubble (MB) disruption (Couture et al. 2012).
Microbubbles are echogenic gas-filled vesicles of 1–10 microns clinically approved for enhancing endocardial borders (Crouse et al. 1993) increasingly explored and translated for improving cancer diagnosis via perfusion estimations (Kasoji et al. 2016) or targeted imaging (Willmann et al. 2017). Upon insonation, MBs produce unique backscatter echoes that consist of the fundamental frequency as well as harmonic and sub-harmonic frequencies, which allows the MB signal to be isolated from tissue signal (De Jong et al. 1994). Pulse inversion (PI) is a selective contrast imaging technique that exploits the difference in MB compression and rarefaction (Simpson et al. 1999). When a dominantly linear responder, such as tissue is insonified with a pulse pair of inverse polarity, the resulting echoes will be of inverse reflections to each other, and summing these two echoes will cancel each other out, resulting in no signal. When a non-linear responder, such as a MB is insonified with inverted pulses, the resulting echoes will not be perfect inverse reflections to each other, and the sum of these echoes will result in a non-zero signal (contrast image).
Combining plane-/diverging-wave and contrast imaging is a logical next step, and has been implemented into various methods including Contrast Pulse Sequence (Couture et al. 2012), pulse inversion (Couture et al. 2012; Leow et al. 2015; Toulemonde et al. 2015) and amplitude modulation (Tremblay-Darveau et al. 2016; Viti et al. 2016). Plane-wave imaging suffers from reduced lateral resolution as compared to line-by-line acquisition, but this can be ameliorated with coherent image compounding (Montaldo et al. 2009). As image resolution is closely tied to the transmit frequency, many of the plane-wave contrast pulses tested thus far operate at higher frequencies (>3 MHz). However, imaging penetration depth decreases with increasing frequency, and the higher frequency imaging does not fully leverage the harmonic content of the most acoustically active MBs, which is one of the MB’s strongest mechanisms for contrast. MBs exhibit a size- and stiffness-dependent resonance frequency, where US back scatter is maximized (De Jong et al. 2002; Medwin 1977), and experimental work by Gorce et. al shows that for SonoVue, MBs of 3–9 um, despite accounting for only 20% of the MB population, are responsible for 80% of the acoustic efficiency, with the overall attenuation coefficient peaking at 1.5–2 MHz (Gorce et al. 2000). Toulemonde et al recently successfully implemented ultra-fast diverging wave contrast echocardiography using low-frequency (1.5 MHz) pulse-inversion in vivo in a goat (Toulemonde et al. 2017). By imaging at frequencies closer to the resonant frequency of the most acoustically active MBs, a low frequency plane wave contrast imaging method may be a useful tool for its ability to image MBs with higher contrast and at greater depths.
In this study we implemented plane-wave pulse-inversion imaging on a programmable US imaging platform using a commercial, low frequency, phased array transducer (P4-1). Contrast images were acquired and optimized in vitro over transmit-frequencies of 1.6–4 MHz, where we found low frequency (<2 MHz) to be optimal. We compare contrast images acquired with transducers of different central frequency to show that the enhancement is not solely due to bandwidth limitation. We demonstrate the capability of the low-frequency pulse sequence by characterizing MB half-life and assessing tumor vasculature in vivo. Our study is the first to optimize pulse inversion at a low frequency (<2 MHz) for plane-wave imaging and apply the optimized parameters to an in vivo cancer model. We also contribute our optimized code for pulse inversion imaging for other researchers to utilize (Supplementary File 1).
Materials and methods
Flash-angle pulse inversion (FAPI) contrast imaging
Plane-wave pulse-inversion (PI) imaging was programmed on the Vantage system (Verasonics, Kirkland, WA, USA) using MATLAB (MathWorks, Naticks, MA, USA) for the P4-1 and L7-4 imaging probe (Philips, Amsterdam, NLD). We implemented PI in favor of amplitude modulation schemes due to the msec-scale delay required to change pulse amplitude while still using all elements to maintain a consistent beam. Flash-angle (FA), a multi-angle plane-wave imaging sequence available on the Vantage system, was modified to perform pulse-inversion (FAPI). In FA imaging an image is reconstructed from the sum of echoes from multiple delay-modulated plane waves directed at various angles (−30 to 30 degrees). In the case of FAPI, a positive and negative pulse is collected at each angle, summed, and reconstructed. Images were reconstructed using the Verasonics native code for multi-angle plane-wave imaging, after acquisition that includes an 11-tap FIR low pass filter and a 21-tap FIR band pass filter. Transmit frequency (Tx), peak negative pressure (PNP), compounding angle numbers (Na) and pulse cycle duration in cycles (N) for the P4-1 were experimentally optimized on an in vitro flow phantom described below. An inter-pulse time of 200 μs was chosen to minimize artifacts due to motion, while also allowing time for sound waves from previous pulses to attenuate. Images were acquired at a sampling frequency of 25 MHz.
FAPI in vitro flow phantom characterization
FAPI parameters were optimized in vitro by flowing MBs through a tissue mimicking flow phantom and acquiring contrast images, in the manner illustrated in Figure 1A. Contrast- and phantom-signal were characterized by drawing regions of interests (ROI) over the area of MB flow and area directly adjacent (Figure 1B), and their respective mean pixel intensity were calculated. Image analysis was carried out on images that underwent the Verasonics standard square-root compression. Contrast to tissue ratio (CTR) was calculated by dividing the mean pixel intensity of the contrast signal ROI over the mean pixel intensity of the phantom ROI.
Figure 1.
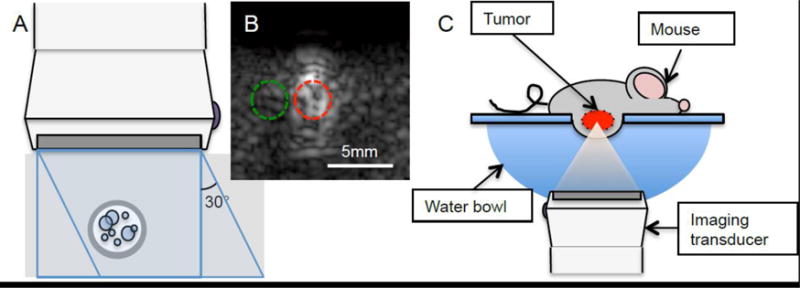
In vitro and in vivo imaging set up. A) In vitro flow phantom - MBs flowing through a rubber tube (3 mm inner diameter) encased in 3% m/m silicon carbide agar phantom was imaged perpendicularly. B) ROIs were drawn over the flow area (red) and the area directly adjacent (green) on the flow phantom images. Mean pixel intensity was measured for each ROI. C) In vivo imaging - the mouse was laid on a platform with a window, allowing for the tumor to be submerged into a warm water bath. The tumor was imaged from beneath.
Flash angle and FAPI images of the in vitro flow phantom were acquired and optimized for transmit frequency (1.64 - 3.90 MHz, with and without the addition of motion noise), pressure (PNP of 23–164 kPa), number of plane wave angles compounded (Na = 1–25 angles), and pulse length (N = 1 or 2 cycles). The flow phantom comprised of an elastic rubber tube with 3 mm inner diameter encased in a tissue-mimicking graphite phantom (0.6 dB/cm/MHz) consisting of 3% (g/ml) silicon carbide (400 grit, Beta Diamond Products, Anaheim, CA, USA), 1.5% agarose (g/ml) and 10% (ml/ml) n-propanol (Fisher Scientific, Pittsburgh, PA, USA) in deionized water. The tube was embedded ~ 1 cm beneath the graphite phantom surface, with attenuation expected to be ~ 1 dB at 1.8MHz Tx. MBs were flowed through the flow phantom at a mean flow velocity of 6 cm/s at 0.02% (v/v) (20 ul MB in 100 ml water). Imaging depth was fixed at 22.5 mm. Motion noise was added by imaging the flow phantom atop a vibration source (Welch 2561B-50, Gardner Denver, Sheboygan, WI, USA)
In vitro flow phantom contrast images were also acquired using focus-beam pulse inversion imaging using the P4-1 and FAPI on the L7-4, and compared with P4-1 FAPI images. For focus-beam contrast imaging, the Verasonic’s native focus-beam PI (WBHI: wide-beam harmonic imaging) code, with 48 multi-line acquisitions, was employed. The L7-4 was operated at 3.9 MHz, 120 and 530 kPa PNP, Na = 7, N = 1, with and without vibration to compare FAPI performance of a transducer operating at higher frequencies but in comparable bandwidth region.
Transducer output characterization
The P4-1 and L7–4 pressure output of a single plane-wave was measured in a water bath using a hydrophone (HNC-0200, Onda, Sunnyvale, CA, USA) and oscilloscope (DS1102E, Rigol, Beaverton, OR, USA) at a distance of 22.5 mm from the transducer surface. The PNP for the P4-1 and L7-4 were recorded for transmit frequencies between 1.56 and 4.46 MHz, and 3.13 and 8.93 MHz, respectively.
Microbubbles (MB)
MBs were synthesized in-house using methods described in (Borden et al. 2005), with 90 mol% 1,2-distearoyl-sn-glycero-3-phosphocholine (DSPC) and 10 mol% 1,2-distearoyl-sn-glycero-3-phosphoethanolamine-N-[amino(polyethylene glycol)-2000] (DSPE-PEG2000) for a final concentration of 2.5 mg/ml in buffer solution (80% 0.9% NaCl, 10% Propylene Glycol (1,2 Propanediol), and 10% Glycerol). MB solution headspace was filled with C4F10 and agitated with a VialMix (DuPont, Wilmington, DE, USA) for 45 seconds to form MBs. DSPC and DSPE- PEG2000 were purchased from Avanti (Alabaster, AL, USA), and C4F10 was purchased from FluoroMed (Round Rock, TN, USA). MBs were sized using the Multisizer 3 Coulter counter (Beckman Coulter, Brea, CA, USA) and the mean diameter was 2.1 ± 1.4 μm.
MB radiofrequency (RF) frequency response
Microbubble RF response to positive and inverted plane-waves were captured and analyzed, using an in vitro tissue mimicking phantom (formulation above) with a cellulose tube of 200 μm inner diameter (Spectrum Laboratories, Rancho Dominguez, CA, USA) encased inside. MBs were flowed into the cellulose tube, stopped, and the echoes from positive and inverted single plane-wave pulses were captured separately for Tx frequencies of 1.8, 2.1, 2.5 and 3.1 MHz. A Gaussian window was applied to the RF signal at the depth of the tube and the frequency spectra of the RF signal for each positive and inverted pulse, as well as the summed pulse was computed and analyzed using MATLAB.
Xenograft mouse model
Human pancreatic adenocarcinoma cells (BxPC-3) were purchased from ATCC (Manassas, VA, USA) and cultured and expanded in accordance to the supplier’s recommended protocol. 5-week old female nude mice (BALB/c) were purchased from Charles River (Wilmington, MA, USA). At approximately 6 weeks of age, 2 × 10⁶ BxPC-3 cells suspended in 200 ul of 20% Matrigel (Corning, Corning, NY, USA)/80% FBS-free culture media were subcutaneously injected at each thigh. Tumors were imaged after having reached a diameter of at least 5 mm. All procedures were done in accordance with the Vanderbilt IACUC.
In vivo FAPI imaging
In vivo imaging was carried out using the experimental setup illustrated in Figure 1C. The animal was anesthetized on a windowed platform using 2% isoflurane (SouthMedic Inc, Barrie, CAN), with the tumor submerged in a warm water bath, allowing for tumors to be imaged from beneath at ~22.5 mm depth. For contrast imaging, a 50μl bolus of MB solution (30% (v/v) in DPBS−/−) was delivered through retro orbital injection for a final MB dilution of 0.75% (15ul in ~2 ml blood). Microbubble flow-in and flow-out was captured through FAPI imaging, acquired over 300 seconds at 1Hz (for MB in vivo half-life assessment) or over 30 seconds at 6.7Hz (for vascular imaging). Imaging parameters found to be optimal in the in vitro flow phantom imaging were employed for the in vivo FAPI imaging (1.83 MHz Tx, 120 kPa, Na = 7, N = 1). An ROI was drawn over the tumor area and the mean pixel intensity was calculated for each frame and plotted against time.
Results
P4-1 and L7-4 efficiency
Pressure output of P4-1 and L7-4 transducers over the ranges of 1.56 to 4.46 MHz and 3.13 to 8.93 MHz, respectively, provided an estimate of the frequency response (Figure 2). The P4-1 central frequency was at 2.5 MHz, with fractional bandwidth of 73% estimated from the −3 dB bandwidth of the measured transmit frequency response. At 1.8 and 3.6 MHz (potential fundamental and 2nd harmonic frequency), the efficiencies were 90 and 69%, respectively. The L7-4 transducer’s central frequency and fractional bandwidth was estimated at 6 MHz, and 96%, and the efficiency at 3.9 and 7.8 MHz was 84 and 74%, respectively.
Figure 2.
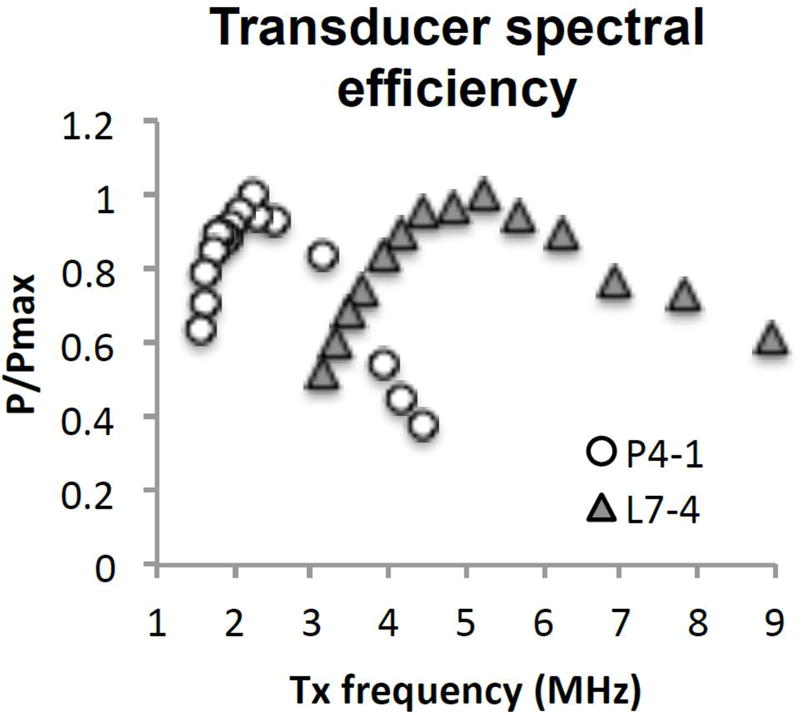
Hydrophone measurements of pressure output of P4-1 and L7-4 probe at 22.5 mm from surface, with unfocused plane-wave. Pressure is normalized to each transducer’s maximal output pressure at that distance.
FAPI optimization; Transmit (Tx) frequency
The effects of Tx frequency (1.64 to 3.91 MHz) on FA and FAPI image quality was characterized on contrast agents flowing through the tissue-mimicking flow phantom at 120kPa pressure, Na = 7, and N = 2. In FA imaging, both contrast and phantom signal increased with Tx frequency up to 3.13 MHz, after which signal decreased (Figure 3A). Both contrast and phantom signal followed similar patterns, though FA CTR (contrast ROI signal/phantom ROI signal) was highest at the lower Tx frequencies (Figure 3B). In FAPI imaging, contrast signal peaked between 1.64 and 1.83 MHz and decreased with increasing Tx frequency. FAPI imaging suppressed phantom signal to varying degrees, from 65% reduction at 1.64 MHz to over 99% at 3.13 MHz and above. FAPI CTR was greatest at higher frequencies primarily due to FAPI phantom signal approaching zero at higher frequencies. However, high CTR with narrow dynamic range can lead to images susceptible to noise, such as those expected to be encountered in in vivo imaging. The introduction of vibration led to a consistent increase in overall phantom signal that decreased the CTR at high frequencies (Figure 3C, D). To maximize contrast signal and minimize phantom signal with motion noise, 1.83 MHz was chosen as the FAPI imaging frequency.
Figure 3.
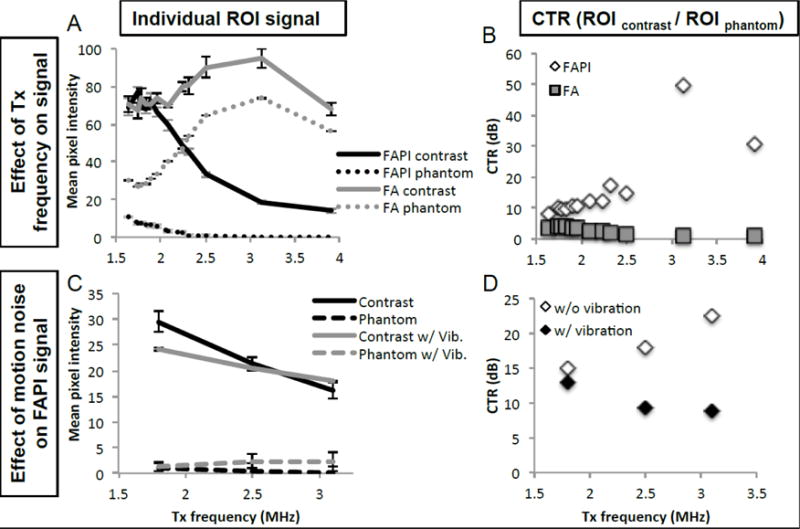
P4-1 FAPI frequency optimization. A) Comparison of contrast and phantom signal acquired through FA and FAPI, over a range of Tx frequencies. Data acquired with PNP of 120kPa, Na = 7 and N = 2. B) CTR representation of data from 3A, comparing CTR of FAPI and FA at various frequencies. C) Comparison of FAPI contrast and phantom signal with and without the addition of vibration to simulate motion noise. Data acquired with PNP of 120kPa, Na = 7 and N = 1. D) CTR representation of data from 3C, comparing CTR of FAPI with and without vibration and various frequencies.
FAPI optimization; PNP
The effects of PNP (23, 58, 120, 164 kPa) on FA and FAPI images were characterized in vitro on the tissue mimicking flow phantom with MBs flowing through, at 1.83 MHz Tx, Na = 7, N = 2. Contrast signal under FA and FAPI was nearly identical over the pressure range studied (Figure 4A). FAPI phantom signal, as expected, was significantly smaller than FA phantom signal. Past 120kPa, the rise in FAPI phantom signal increased, while the rise in FAPI contrast remained the same, suggesting that employing higher pressure would result in diminished CTR. For contrast imaging studies, 120kPa was employed.
Figure 4.
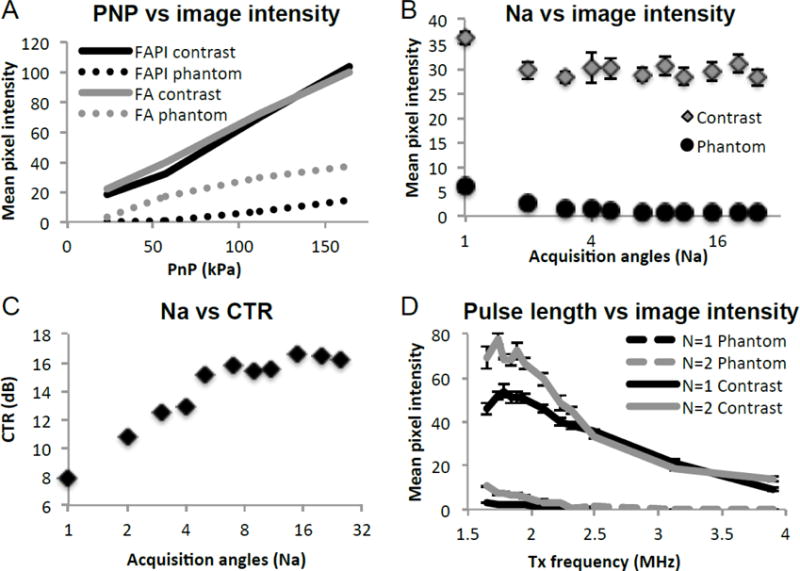
P4-1 transducer optimization. A) Effect of transducer voltage across each element on contrast and phantom signal, under FA and FAPI imaging. B) Effect of the number of angles (Na) to be coherently summed on FAPI contrast and phantom signal as well as C) the contrast to tissue ratio (CTR). D) The effect of pulse cycle (N) on contrast signal and phantom signal, acquired over a range of Tx frequency.
FAPI optimization; Flash angle numbers (Na)
Contrast and phantom signal amplitude from FAPI images acquired with Na ranging from 1 to 25 angles were compared with the following settings; 1.83 MHz Tx, 120 kPa, N = 2. The number of acquisitions compounded had minimal effect on contrast agent signal, while phantom signal suppression steadily improved with increasing Na (Figure 4B). Compounding over multiple angles significantly improved CTR, with single-, 3-, 7-, and 15-angle images yielding CTR of 8, 12, 16, and 17 dB, respectively (Figure 4C). Since we expect that increasing the number of angles to be compounded to also increase FAPI susceptibility to motion, we chose 7 angles where contrast signal, as well as CTR began to plateau, for our in vivo contrast imaging parameter.
FAPI optimization; Number of cycles per pulse (N)
FAPI images obtained using a pulse of either 1 or 2 cycles were compared over a Tx frequency range of 1.64 to 3.91 MHz, with the following settings; 120 kPa, Na = 7. The longer pulse duration led to a stronger signal for both contrast and phantom at Tx frequencies below 2.5 MHz, however the phantom signal exhibited a greater proportional increase with longer pulse duration (Figure 4D). Above frequencies of 2.5 MHz, no noticeable difference in signal strength due to pulse duration was observed. The 2-cycle pulses generated visibly blurrier images as expected from the longer axial length. Overall, for optimal FAPI imaging, a transmit pulse of 1.83MHz, 120kPa, single cycle and a compound of 7 flash angles was chosen to achieve adequate axial contrast and CTR.
L7-4 FAPI and P4-1 WBHI
To determine whether lower Tx frequency truly led to greater non-linear echo production, or simply that as Tx frequency increased the 2nd harmonic echoes were being pushed out of the transducer bandwidth, we compared FAPI images acquired with a transducer with greater central frequency. P4-1 and L7-4 were operated at Tx of 1.8 and 3.9 MHz, where transducer sensitivity at 2*Tx (3.6 and 7.8 MHz) was 69 and 74%, respectively (Figure 2). Since the second harmonic of both transducers has similar sensitivity, comparable CTRs should be achievable with both transducers if contrast agents generated similar harmonic echo amplitudes. In vitro flow phantom images were acquired at PNP of 120 kPa and 530 kPa, Na = 7, N = 1, with and without vibration, and the contrast and phantom signals were quantified (Figure 5A). Contrast and phantom signals in images from the L7-4 were detectable but with lower amplitude than the P4-1 probe at both pressures. During vibration of the phantom, the contrast signal detected by the P4-1 decreased by 18% while both contrast and phantom signals increased with the L7-4, significantly reducing CTR.
Figure 5.
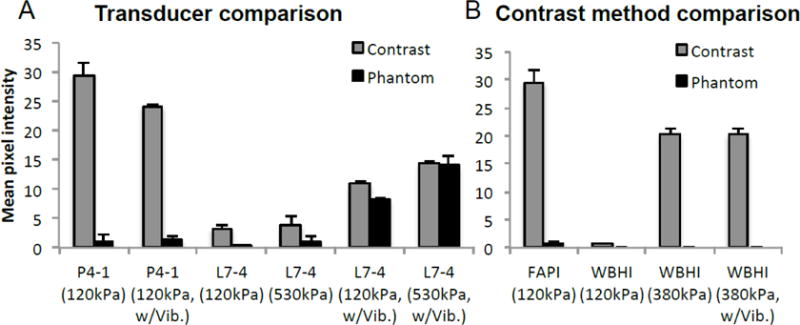
Comparison of contrast image acquired with A) transducers of differing center frequency, and B) differing contrast imaging methods. A) Contrast and phantom signal amplitude captured with FAPI using P4-1 (1.8MHz) and L7-4 (3.9MHz), with and without vibration. L7-4 Tx frequency was chosen based upon its spectral efficiency (figure 2), such that the transducer would be comparably sensitive to both the fundamental and 2nd harmonic frequencies. B) Comparing FAPI with wide beam harmonic imaging (WBHI), the Verasonics’ line-by-line contrast imaging method using pulse inversion.
To compare FAPI to traditional B-mode imaging, flow phantom contrast images were acquired with the P4-1 at 1.83 MHz using focus-beam pulse inversion (WBHI) and compared with those acquired using FAPI. At matched pressure (120 kPa), FAPI contrast signal was 45 times that of WBHI’s. However, unlike FAPI WBHI phantom signal was completely suppressed (Figure 5B). Increasing pressure to 380kPa significantly improved the amplitude of WBHI contrast signal without affecting phantom signal. Signal intensity acquired through WBHI was minimally affected by vibration.
RF frequency response
The RF response of positive and negative ultrasound pulses of varying frequencies to MBs were acquired and analyzed. Both RF responses to positive and inverted pulse shared similar fundamental harmonic components, while the mismatch arose from the 2nd harmonic components (Figure 6A). The frequency spectra of the sum of the positive and inverted pulses (PI) of Tx frequencies of 1.8, 2.1, 2.5 and 3.1 were calculated (Figure 6B). The majority of the PI signal stems from the signal mismatch in the 2nd harmonic component, and the difference diminishes as Tx frequency is increased.
Figure 6.
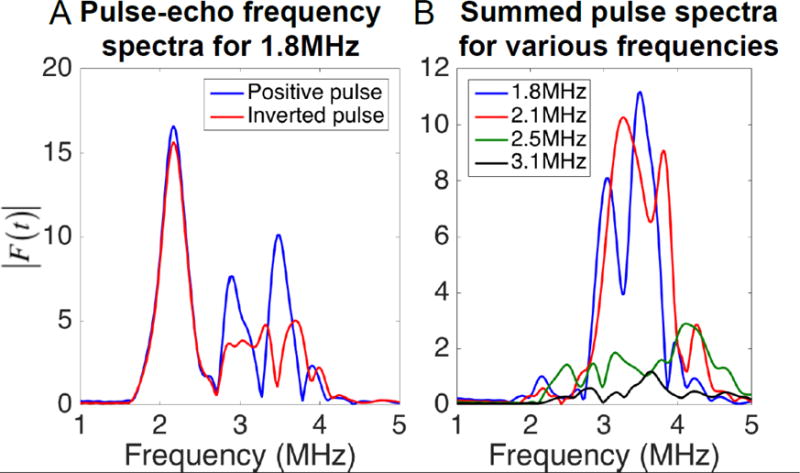
Frequency spectra of the pulse-echo from MBs received on a single element, with y-axis representing the linear Fourier transform amplitude at each frequency. RF echoes were generated in response to an incident pressure of 150kPa. A) Frequency spectrum of the response from MBs of a positive pulse (blue line) and an inverted pulse (red line). B) Frequency spectra of the summed positive and negative pulse (pulse inversion) for 1.8, 2.1, 2.5 and 3.1 MHz Tx.
In vivo imaging; Wash-in, wash-out of microbubbles
Xenograft mouse contrast imaging was carried out using FAPI parameters optimized in the above reported in vitro imaging characterization. The mean pixel intensity of an ROI inside the tumor during MB wash-in and wash-out increases quickly after injection and dissipates (Figure 7A). Pixel intensity across the tumor reached maxima within 10 seconds of initial MB detection, presumably when the tumor became fully perfused with MB. On wash-out, the MB signal reduced to ½ its maximum 140 seconds after peaking. Figures 7B, 7C, 7D and 7E represent images acquired prior to MB injection (Figure 7B), immediately post injection (Figure 7C), during signal peak (Figure 7D) and after much of the washout had already occurred (Figure 7E).
Figure 7.
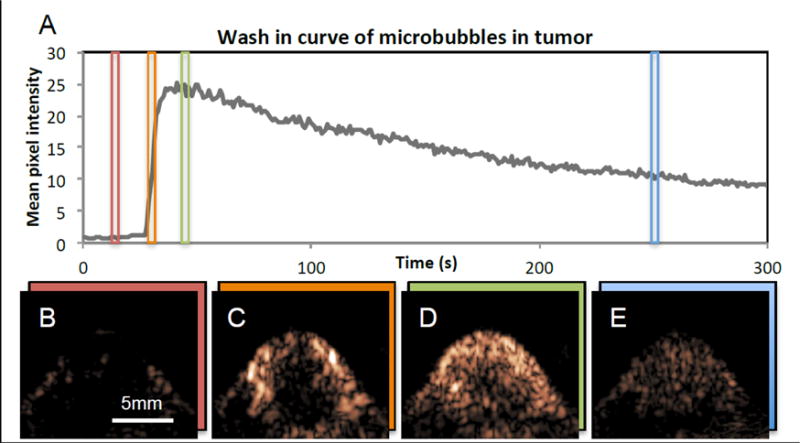
In vivo plane-wave pulse inversion imaging of MBs in mouse with tumor. Microbubbles were injected at the 27 s mark, and the images were collected over a period of 300 seconds. A) Time activity curve of signal inside ROI drawn over tumor. B) Tumor image obtained at t = 15 s, prior to MB injection. C) Tumor image obtained at t = 31 s, immediately after MB injection. D) Tumor image obtained at 46 s, when MB signal has peaked. E) Tumor image obtained at 250s, after much of the MBs has washed out.
A 30 second FAPI acquisition was collected at 6.7 Hz to better visualize MB wash-in. The FA B-mode image, FAPI contrast image, and the combined image, with B-mode represented in magenta and FAPI represented in green are displayed in Figures 8A, 8B and 8C, respectively. Figure 8D was created by averaging together the first 45 FAPI frames (~7 seconds) acquired post contrast injection. Here, the tumor vasculature of sub-mm size can be readily identified, such as can be seen between the white arrows in figure 8D.
Figure 8.
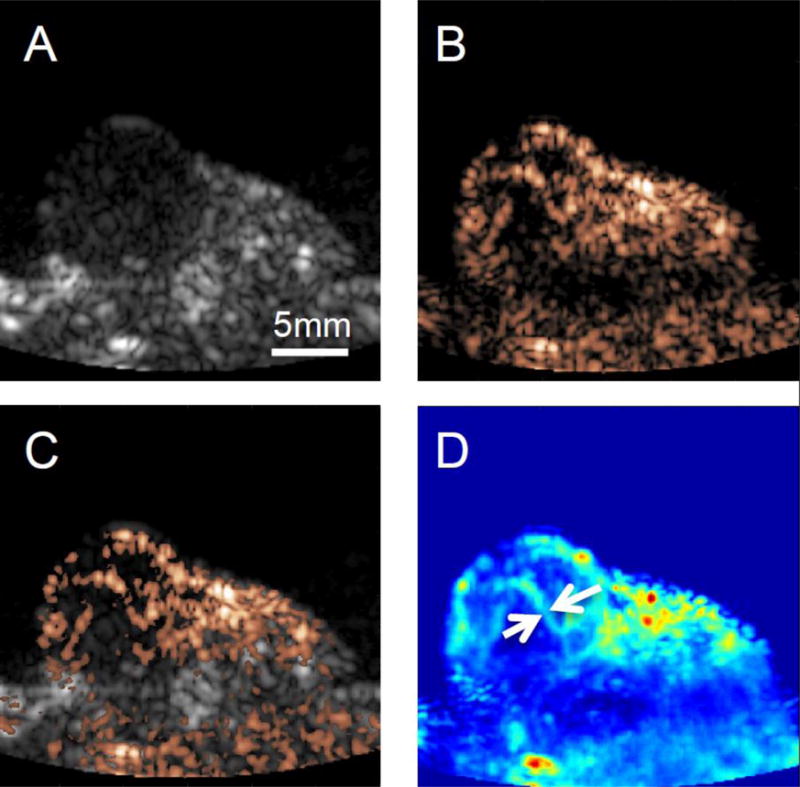
In vivo contrast imaging, and B-mode imaging. A) B-mode image of tumor. B) Contrast image of tumor post MB injection. C) Combined image of B-mode (gray scale) and contrast imaging (copper) post contrast injection, and D) Average of contrast images of the first 45 frames of (~7 seconds) post MB injection. In contrast imaging, vascular features on the order of sub mm size can clearly be identified (white arrows)
Discussion
In this work we developed and optimized low frequency plane-wave contrast imaging in vitro on a commercial imaging transducer (P4-1) and validated its performance in a mouse tumor xenograft. We observed higher CTR with low frequency harmonic imaging compared to higher frequency harmonic imaging implemented on the same and a separate probe (L7-4). We demonstrated in vivo imaging capabilities of low frequency plane-wave imaging by characterizing MB half-life and assessing tumor vasculature. We show that plane-wave contrast imaging at low frequencies is feasible in vivo and offers higher magnitude contrast signal and therefore better selective imaging of contrast agents compared to higher frequencies. We attribute the higher SNR observed with the low frequency probe to a combination of 1) increased non-linear echo amplitude from contrast signal emitted in response to lower transmit frequencies and 2) efficient motion cancellation at longer wavelengths.
Source of contrast signal
To elucidate whether the stronger contrast signal at lower transmit frequency (Tx) was due solely to greater non-linear echo production or simply transducer bandwidth, we compared the P4-1 contrast imaging performance with that of the L7-4, operated at similar ranges of their bandwidths, where both Tx and 2*Tx fit comfortably within. Images at 3.9MHz on the L7-4 had considerably lower contrast and phantom signal, as compared to the P4-1 at 1.8MHz. Using a transmit pressure of 530 kPa, the 3.9 MHz pulse inversion image had substantially lower magnitude than the 1.8 MHz acquisition acquired at 120 kPa. Since the signal acquisition and image presentation post-processing were closely matched between the probes, this observation is consistent with the idea that the microbubbles used in our study generate stronger non-linear echoes in response to lower frequencies compared to higher frequencies.
To relate our observations to underlying bubble activity, we can consider the properties of the bubble and expected activity in response to acoustic pulses. The lipid-shelled microbubbles used in this study had a mean diameter of 2.1 ± 1.4 μm and median volume concentration of 5.6 μm. This distribution is similar to prior measurements of the commercial contrast agent Definity® decanted from a solution within 30 sec of mixing (Goertz et al. 2007). Using commonly assumed shell properties for lipid-shelled bubbles, the resonant frequency of a 2.1-μm and 5.6-μm bubble can be estimated to be 8.5 MHz and 2.1 MHz, respectively (De Jong et al. 2002a; Morgan et al. 2001; Qin et al. 2009). We expect this bubble population to be responsive across the frequencies examined. Lower imaging frequencies yielded higher contrast signal and better CTR in the presence of motion in our study. One potential explanation is that a majority of the signal observed in the reconstructed image is contributed by a sub-population of bubbles that are most acoustically active. Prior researchers have observed that MBs of 3–9um, despite accounting for only 20% of the MB population, are responsible for 80% of the acoustic efficiency, with the overall attenuation coefficient peaking at 1.5–2MHz (Gorce et al. 2000). Kaya et al. have reported simulated and experimental echo amplitudes from lipid shelled bubbles with monodispersed populations across diameters of 1.8–4.8 μm in response to frequencies ranging from 0.75 to 3 MHz at 100 kPa PNP. In their study, echoes from monodisperse microbubbles with mean populations in the range of 3–4.4 μm were many times higher at 1.25 MHz and 1.75 MHz compared to echoes from bubbles in response to 3 MHz pulses regardless of size (Kaya et al. 2010). We conclude that the majority of the nonlinear signal observed from the polydispersed bubbles used in our study is from the large bubbles that generate substantially larger non-linear echoes in response to the 1.8 MHz pulse compared to comparable resonant bubbles at 3.9 MHz.
From our RF studies, we observe that the majority of the enhanced contrast-agent signal arose from the 2nd harmonic frequency components in the inverted pulse-echoes. This is consistent with prior studies by others, where it was shown that the sum of echoes from inverted pulse pairs would contain the even-ordered harmonic components, whereas the difference would contain the odd-ordered harmonics (Simpson et al. 1999). Contrast enhancement diminished as Tx frequency was increased. The contrast signal improvement at the lower frequencies is likely due to a combination of factors, with one being transducer bandwidth limitation. Because the bulk of the contrast signal is at the 2nd harmonic, this frequency must be within the transducer’s upper bound of bandwidth for optimal contrast signal via PI imaging.
Contrast imaging sequences such as PI and CPS, which rely on summing sequential pulses to suppress linear responders, are particularly susceptible to motion artifacts. Any spatial changes that occur between the acquisition of pulses to be summed will persist, regardless of the echo’s linearity. In our study, higher Tx frequencies were more susceptible to motion induced by vibration. Since PI relies on algebraic summing of sequential pulses, the pulses to be summed need only be mismatched by ½ wavelength to be maximally mismatched and generate motion artifacts. Successful tissue suppression can only take place if the tissue displacement occurring between successive pulse transmissions is much smaller than ½ the Tx wavelength. Low frequencies have longer wavelengths and are less sensitive to motion since tissue would need to move further. This is consistent with our finding that low frequency contrast imaging on the P4-1 maintained good tissue suppression and a high CTR in the presence of vibration compared to the high frequency probe that did not.
Benefits of low frequency plane wave imaging
The use of low Tx frequency on a commercial imaging transducer could lead to simplified, more economic means for image-guided therapy. Lower ultrasound frequencies are used in a variety of therapies with MB, including delivery of genes (Bez et al. 2017), opening the blood brain barrier (BBB) (McDannold et al. 2005), and ablation at very high intensities (Kennedy 2005). Effective and safe FUS treatment requires guidance via MRI or ultrasound imaging, typically achieved by using separate imaging and therapy systems, but often require custom hardware development and co-registration of imaging and therapeutic systems. Ultrasound-guided FUS (USgFUS) systems have been steadily gaining prominence (Ebbini and Ter Haar 2015) since they supply real-time feedback and do not require an MR imaging system, but many of these systems are bulky or are dedicated treatment systems (Choi et al. 2014; Haritonova et al. 2015). A perpendicular configuration of a transmit (therapeutic) and receive transducer to monitor bubbles at the focus has been used but leaves for a mechanically limited system with a constrained treatment area (Wang et al. 2015). Others have employed a parallel configuration, where the receive transducer is embedded into the center of a doughnut shaped transmit transducer (Choi et al. 2014; Liu et al. 2016; Tung et al. 2010), or sandwiched between the therapeutic transducers (Kruse et al. 2010). The use of a low-frequency phased-array transducer opens the possibility of having dual therapy and imaging modes in a single transducer (Ebbini et al. 2006; Kotopoulis et al. 2013) with no custom hardware development or co-registration required to align the therapeutic and imaging plane. A commercial, low frequency imaging probe such as the P4-1 could be adapted for image-guided therapeutics since it is capable of generating a PNP of >4 MPa at low duty cycles. The P4-1’s small aperture likely limits its theranostic capabilities to small animals and superficial areas, but it has been used recently to image in larger animals (Toulemonde et al. 2017). However, by reducing the maximum spatial compounding angle and using a transducer with a larger aperture, low-frequency plane-wave contrast imaging for deep tissue imaging and therapy may be feasible.
Compared with traditional line-by-line acquisitions, at matched pressure, plane-wave contrast imaging can achieve higher frame rates and exhibited greater contrast signal, but was less successful at tissue suppression. Compounding data acquired over multiple angles significantly improved FAPI CTR, consistent with the previous works of others (Montaldo et al. 2009; Viti et al. 2016). The increase primarily stemmed from the reduction in tissue signal with increased acquisition number. CTR enhancement plateaued at ~7 angles, where a 16 dB greater contrast agent signal to tissue signal was observed. Even with multiple acquisitions for compounding, contrast plane-wave imaging significantly reduced acquisition time as compared to line-by-line imaging. At the depths examined, a 3- or 7-angle FAPI sequence can be acquired at frame rates of over 1 kHz and 440 Hz, respectively, whereas a traditional contrast acquisition with 96 elements would be limited to 32 Hz.
The ultrafast (FPS greater than 500 Hz) nature of plane-wave imaging has recently been used for super-resolution imaging (Errico et al. 2015), improving the resolution of MB imaging over 10-fold the wavelength limit. Super resolution methods have been successfully implemented on the programmable imaging platforms at high frequencies (>7 MHz) with and without harmonic imaging sequences (Foiret et al. 2016; Lin et al. 2017). Our studies suggest that the transmit frequency and bandwidth of transducers used in prior imaging studies may primarily emphasize MB motion and do not leverage the MB’s non-linear responses. Comparing contrast signal of stationary vs flowing MB in the in vitro flow phantom, we observed a reduction in CTR of ~19% (Supplemental Figure S1), leading us to conclude that approximately 19% of the contrast signal was due to motion rather than harmonic content. Low-frequency plane wave contrast imaging presented here could be ideal for super-resolution applications, since the penetration depth of the low frequency could compensate for the mm-scale resolution, resulting in a contrast imaging method with high CTR, deep penetration, and fine resolution for vasculature mapping.
Limitations and practical considerations
Our study supports the idea that high CTR achieved with low frequency plane wave imaging occurs due to very strong bubble oscillations at low frequencies (<2 MHz). Strong oscillations are well-known to occur in this range, and here we explore the role of these oscillations with respect to algebraic contrast imaging methods. Although we have matched filters and image processing closely when varying parameters in our study (i.e. transmit frequency or imaging probes), many factors that are difficult to control will affect the reconstructed intensity. One potential issue is soft-clipping, which can be obscured by either of the receive filters of the Verasonics. As part of this study, the RF echoes from MBs imaged at varied pressures were also collected and analyzed (Supplementary S2). At pressures of 200 kPa and above, frequency peaks outside of the transducer bandwidth emerged, suggesting the presence of soft clipping. In a practical scenario where the transmit MI is adjusted interactively along with post processing on the beamformed image, it would be difficult to predict whether this had occurred. Our analysis also does not consider the role of the elevational plane, which varies between the transducer geometry and transmit frequency. Hydrophone measurements indicate that the P4-1 elevational plane ranges from ~7mm to 3mm over the depths used in this study. Although we demonstrated perfusion imaging in a mouse tumor with a diameter of 5mm, better images would likely be feasible if we optimized imaging depth with respect to maximum spatial compounding angle and elevational profile. Potential applications of low frequency plane wave imaging may ultimately require large apertures, such as those currently being explored for abdominal imaging (Bottenus et al. 2018).
Conclusion
Overall, our study demonstrates that low frequency plane-wave contrast imaging is a viable tool for monitoring contrast agents in vivo in real-time, with resolution to identify vasculature on the sub-mm scale. To our knowledge, this is the first work where low-frequency (<2 MHz) plane-wave pulse inversion imaging was optimized and then applied in vivo. In addition to the improved penetration depth that low frequency imaging offers, we find that the use of low frequency pulses significantly improves contrast signal. Low frequency plane-wave contrast is a promising tool since it could potentially be combined with super-resolution localization to improve image resolution for vascular mapping. The low peak negative pressure of plane-wave imaging is conducive to targeted contrast imaging, and should be suitable for integration with ultrasound-guided focused ultrasound therapy. We have made the codes for the algorithms developed in this study publically available to facilitate the use of plane wave contrast imaging. By making the codes publicly available, we hope to provide the research community with an accessible tool for low-frequency plane wave contrast that has been demonstrated to work in small animals.
Supplementary Material
Supplemental figure 1 – Effect of MB flow on contrast agent signal. A) Contrast agent signal was acquired through plane-wave pulse inversion imaging on an in vitro flow phantom at various pressures at 2.1 MHz, with the contrast agent flowing (dynamic) or stopped (static). Contrast was flowed at a mean velocity of 6 cm/s. At all pressures, the flow of contrast agents slightly increases the contrast signal. B) Change in contrast signal (static contrast/dynamic contrast) over all pressures, for plane-wave imaging vs plane-wave pulse inversion imaging. Stopping the flow lead to a contrast signal decrease of ~19%.
Supplemental figure 2 – Frequency spectra of the RF response of positive (black line) and inverted (blue line) ultrasound pulses of varying PNP to MB. The transmit frequency was 1.8MHz. The frequency spectra of the summed response (pulse inversion) is expressed in red. At pressures of 200 kPa and above, frequency peaks outside of the transducer bandwidth emerge, suggesting the presence of soft clipping.
Supplemental file 1 – MATLAB code for the optimized, flash angle, plane-wave, pulse inversion imaging sequence programmed on the Verasonics platform for the P4-1 imaging probe, used in this paper.
Acknowledgments
The work presented here was supported by the Vanderbilt University Institutional Discovery Grant (#IRG-58-009-56), the R25 training grant in cancer imaging (NCI R25CA092043), and the T32 Radiation therapy training grant (5T32CA093240-16).
Footnotes
Publisher's Disclaimer: This is a PDF file of an unedited manuscript that has been accepted for publication. As a service to our customers we are providing this early version of the manuscript. The manuscript will undergo copyediting, typesetting, and review of the resulting proof before it is published in its final citable form. Please note that during the production process errors may be discovered which could affect the content, and all legal disclaimers that apply to the journal pertain.
References
- Bez M, Sheyn D, Tawackoli W, Avalos P, Shapiro G, Giaconi J, Da X, David SB, Gavrity J, Awad HA, Bae HW, Ley EJ, Kremen TJ, Gazit Z, Ferrara KW, Pelled G, Gazit D. In situ bone tissue engineering via ultrasound-mediated gene delivery to endogenous progenitor cells in mini-pigs. Sci Transl Med. 2017;9:6. doi: 10.1126/scitranslmed.aal3128. [DOI] [PMC free article] [PubMed] [Google Scholar]
- Borden MA, Kruse DE, Caskey CF, Zhao S, Dayton PA, Ferrara KW. Influence of Lipid Shell Physicochemical Properties on Ultrasound-Induced Microbubble. Destruction. 2005;52:1992–2002. doi: 10.1109/tuffc.2005.1561668. [DOI] [PMC free article] [PubMed] [Google Scholar]
- Bottenus NB, Long W, Morgan M, Trahey GE. Evaluation of large aperture imaging through the ex vivo human abdominal wall. Ultrasound Med Biol. 2018:687–701. doi: 10.1016/j.ultrasmedbio.2017.10.019. (in press) [DOI] [PMC free article] [PubMed] [Google Scholar]
- Choi JW, Lee JY, Hwang EJ, Hwang I, Woo S, Lee CJ, Park E-J, Choi BI. Portable high-intensity focused ultrasound system with 3D electronic steering, real-time cavitation monitoring, and 3D image reconstruction algorithms : a preclinical study in pigs. 2014;33:191–199. doi: 10.14366/usg.14008. [DOI] [PMC free article] [PubMed] [Google Scholar]
- Couture O, Bannouf S, Montaldo G, Aubry J-F, Fink M, Tanter M. Ultrafast imaging of ultrasound contrast agents. Ultrasound Med Biol. 2009;35:1908–1916. doi: 10.1016/j.ultrasmedbio.2009.05.020. [DOI] [PubMed] [Google Scholar]
- Couture O, Fink M, Tanter M. Ultrasound contrast plane wave imaging. IEEE Trans Ultrason Ferroelectr Freq Control. 2012;59:1. doi: 10.1109/TUFFC.2012.2508. [DOI] [PubMed] [Google Scholar]
- Crouse LJ, Cheirif J, Hanly DE, Kisslo JA, Labovitz AJ, Raichlen JS, Schutz RW, Shah PM, Smith MD. Border Delineation Improvement in Patients with Suboptimal Endocardial Border Definition in Routine Echocardiography: Results of the Phase III Albunex Multicenter Trial. JACC. 1993;22:1494–1500. doi: 10.1016/0735-1097(93)90562-f. [DOI] [PubMed] [Google Scholar]
- De Jong N, Bouakaz A, Frinking P. Basic Acoustic Properties of Microbubbles. Echocardiography. 2002a;19:229–240. doi: 10.1046/j.1540-8175.2002.00229.x. [DOI] [PubMed] [Google Scholar]
- De Jong N, Bouakaz A, Ten Cate FJ. Contrast harmonic imaging. 2002b;40:567–573. doi: 10.1016/s0041-624x(02)00171-3. [DOI] [PubMed] [Google Scholar]
- De Jong N, Cornet R, Lancee CT. Higher harmonics of vibrating gas-filled microspheres. Part one : simulations z (Ro) 3r. Ultrasonics. 1994;32:447–453. [Google Scholar]
- Ebbini ES, Ter Haar G. Ultrasound-guided therapeutic focused ultrasound: Current status and future directions. Int J Hyperth. 2015;31:77–89. doi: 10.3109/02656736.2014.995238. [DOI] [PubMed] [Google Scholar]
- Ebbini ES, Yao H, Shrestha A. Dual-Mode Ultrasound Phased Arrays for Image-Guided Surgery. Ultrason Imaging SAGE Publications Inc. 2006;28:65–82. doi: 10.1177/016173460602800201. [DOI] [PubMed] [Google Scholar]
- Errico C, Pierre J, Pezet S, Desailly Y, Lenkei Z, Couture O, Tanter M. Ultrafast ultrasound localization microscopy for deep super-resolution vascular imaging. Nature Nature Publishing Group. 2015;527:499–502. doi: 10.1038/nature16066. [DOI] [PubMed] [Google Scholar]
- Foiret J, Zhang H, Mahakian L, Tam S, Ferrara KW. Super-localization of contrast agents in moving organs, first experiments in a rat kidney. 2016:1–4. [Google Scholar]
- Goertz DE, De Jong N, Van der Steen AFW. Attenuation and Size Distribution Measurements of Definity-and Manipulated Definity-Populations. Ultrasound Med Biol. 2007;33:1376–1388. doi: 10.1016/j.ultrasmedbio.2007.03.009. [DOI] [PubMed] [Google Scholar]
- Gorce JM, Arditi M, Schneider M. Influence of bubble size distribution on the echogenicity of ultrasound contrast agents: a study of SonoVue. Invest Radiol. 2000;35:661–671. doi: 10.1097/00004424-200011000-00003. [DOI] [PubMed] [Google Scholar]
- Haritonova A, Liu D, Ebbini ES. In Vivo Application Localization of Transcranial Focused Ultrasound Using Dual-Mode Ultrasound Arrays. IEEE Trans Ultrason Ferroelectr Freq Control. 2015;62 doi: 10.1109/TUFFC.2014.006882. [DOI] [PMC free article] [PubMed] [Google Scholar]
- Hasegawa H, Kanai H. High frame rate echocardiography using diverging beams. IEEE Int Ultrason Symp IUS. 2011:132–135. doi: 10.1007/s10396-011-0304-0. [DOI] [PubMed] [Google Scholar]
- Kasoji SK, Chang EH, Mullin LB, Chong WK, Rathmell WK, Dayton PA. A Pilot Clinical Study in Characterization of Malignant Renal-cell Carcinoma Subtype with Contrast-enhanced Ultrasound. Ultrason Imaging SAGE Publications. 2016;39:126–136. doi: 10.1177/0161734616666383. [DOI] [PMC free article] [PubMed] [Google Scholar]
- Kaya M, Feingold S, Hettiarachchi K, Lee AP, Dayton PA. Acoustic responses of monodisperse lipid encapsulated microbubble contrast agents produced by flow focusing. Bubble Sci Eng Technol Taylor & Francis. 2010;2:33–40. doi: 10.1179/175889610x12779105661532. [DOI] [PMC free article] [PubMed] [Google Scholar]
- Kennedy JE. High-intensity focused ultrasound in the treatment of solid tumors. Nat Rev Cancer, London. 2005;5:321–327. doi: 10.1038/nrc1591. [DOI] [PubMed] [Google Scholar]
- Kotopoulis S, Dimcevski G, Gilja OH, Hoem D, Postema M. Treatment of human pancreatic cancer using combined ultrasound, microbubbles, and gemcitabine : A clinical case study Treatment of human pancreatic cancer using combined ultrasound, microbubbles, and gemcitabine : A clinical case study. Int J Med Phys Res Pract. 2013;40 doi: 10.1118/1.4808149. [DOI] [PubMed] [Google Scholar]
- Kruse DE, Lai C, Stephens DN, Sutcliffe P, Paoli EE, Barnes SH, Ferrara KW. Spatial and Temporal-Controlled Tissue Heating on a Modified Clinical Ultrasound Scanner for Generating Mild Hyperthermia in Tumors. 2010;57:155–166. doi: 10.1109/TBME.2009.2029703. [DOI] [PMC free article] [PubMed] [Google Scholar]
- Leow CH, Bazigou E, Eckersley RJ, Yu ACH, Weinberg PD, Tang M-X. High-Frame-Rate Plane Wave Utrasound and Image Tracking: Methods and Initial in vitro and in vivo Evaluation. Ultrasound Med Biol. 2015;41:2913–2925. doi: 10.1016/j.ultrasmedbio.2015.06.012. [DOI] [PubMed] [Google Scholar]
- Lin F, Shelton SE, Espíndola D, Rojas JD, Pinton G, Dayton PA. 3-D Ultrasound Localization Microscopy for Identifying Microvascular Morphology Features of Tumor Angiogenesis at a Resolution Beyond the Diffraction Limit of Conventional Ultrasound. Theranostics. 2017;7:196–204. doi: 10.7150/thno.16899. [DOI] [PMC free article] [PubMed] [Google Scholar]
- Liu J, Foiret J, Stephens DN, Le Baron O, Ferrara KW. Development of a spherically focused phased array transducer for ultrasonic image-guided hyperthermia. Phys Med Biol. 2016;61:5275–5296. doi: 10.1088/0031-9155/61/14/5275. [DOI] [PMC free article] [PubMed] [Google Scholar]
- McDannold N, Vykhodtseva N, Hynynen K. Targeted disruption of the blood-brain barrier with focused ultrasound: Association with inertial cavitation. Proc - IEEE Ultrason Symp. 2005;2:1249–1252. [Google Scholar]
- Medwin H. Counting bubbles acoustically: a review. Ultrasonics. 1977;15:7–13. [Google Scholar]
- Montaldo G, Tanter M, Bercoff J, Benech N, Fink M. Coherent plane-wave compounding for very high frame rate ultrasonography and transient elastography. IEEE Trans Ultrason Ferroelectr Freq Control. 2009;56:489–506. doi: 10.1109/TUFFC.2009.1067. [DOI] [PubMed] [Google Scholar]
- Morgan KE, Allen JS, Chomas JE, Klibanov AL, Ferrara KW. Experimental and Theoretical Evaluation of Ultrasonic Contrast Agent Behavior: Effect of Transmitted Phase and Bubble Size. 2001;47:1494–1509. doi: 10.1109/58.883539. [DOI] [PubMed] [Google Scholar]
- Papadacci C, Pernot M, Couade M, Fink M. High Contrast Ultrafast Imaging of the Human Heart. 2014;61:1–29. doi: 10.1109/TUFFC.2014.6722614. [DOI] [PMC free article] [PubMed] [Google Scholar]
- Qin S, Caskey CF, Ferrara KW. Ultrasound contrast microbubbles in imaging and therapy: Physical principles and engineering. Phys Med Biol. 2009;54 doi: 10.1088/0031-9155/54/6/R01. [DOI] [PMC free article] [PubMed] [Google Scholar]
- Simpson DH, Chin CT, Burns PN. Pulse Inversion Doppler : A New Method for Detecting Nonlinear Echoes from Microbubble Contrast Agents. 1999;46:372–382. doi: 10.1109/58.753026. [DOI] [PubMed] [Google Scholar]
- Toulemonde M, Duncan WC, Leow C-H, Sboros V, Li Y, Eckersley RJ, Lin S, Tang M-X, Butler M. Cardiac flow mapping using high frame rate diverging wave contrast enhanced ultrasound and image tracking. 2017 IEEE Int Ultrason Symp. 2017:1–4. [Google Scholar]
- Toulemonde M, Papadopoulou V, Tang MX. A Contrast Enhanced Ultrasound imaging system with diverging waves for cardiac imaging – initial evaluation on a beating phantom. 2015:2–6. [Google Scholar]
- Tremblay-Darveau C, Williams R, Milot L, Bruce M, Burns PN. Visualizing the Tumor Microvasculature with a Nonlinear Plane-Wave Doppler Imaging Scheme Based on Amplitude Modulation. IEEE Trans Med Imaging. 2016;35:699–709. doi: 10.1109/TMI.2015.2491302. [DOI] [PubMed] [Google Scholar]
- Tung Y-S, Choi JJ, Baseri B, Konofagou EE. Identifying the intertial cavitation threshold and skull effects in a vessel phantom using focused ultrasound and microbubbles. Ultrasound Med Biol. 2010;36:840–852. doi: 10.1016/j.ultrasmedbio.2010.02.009. [DOI] [PMC free article] [PubMed] [Google Scholar]
- Viti J, Vos HJ, De Jong N, Guidi F, Tortoli P, De Jong N, Guidi F. Detection of Contrast Agents: Plane Wave vs Focused Transmission. IEEE Trans Ultrason Ferroelectr Freq Control. 2016;63:203–211. doi: 10.1109/TUFFC.2015.2504546. [DOI] [PubMed] [Google Scholar]
- Wang T, Woo J, Pu K, Devulapally R, Bachawal S, Machtaler S, Mullick S, Luong R, Tian L, Khuri-yakub B, Rao J, Paulmurugan R, Willmann JK. Ultrasound-guided delivery of microRNA loaded nanoparticles into cancer. 2015;203:99–108. doi: 10.1016/j.jconrel.2015.02.018. [DOI] [PMC free article] [PubMed] [Google Scholar]
- Willmann JK, Bonomo L, Testa AC, Rinaldi P, Rindi G, Valluru KS, Petrone G, Martini M, Lutz AM, Gambhir SS. Ultrasound Molecular Imaging With BR55 in Patients With Breast and Ovarian Lesions : First-in-Human Results. J Clin Oncol. 2017 doi: 10.1200/JCO.2016.70.8594. [DOI] [PMC free article] [PubMed] [Google Scholar]
Associated Data
This section collects any data citations, data availability statements, or supplementary materials included in this article.
Supplementary Materials
Supplemental figure 1 – Effect of MB flow on contrast agent signal. A) Contrast agent signal was acquired through plane-wave pulse inversion imaging on an in vitro flow phantom at various pressures at 2.1 MHz, with the contrast agent flowing (dynamic) or stopped (static). Contrast was flowed at a mean velocity of 6 cm/s. At all pressures, the flow of contrast agents slightly increases the contrast signal. B) Change in contrast signal (static contrast/dynamic contrast) over all pressures, for plane-wave imaging vs plane-wave pulse inversion imaging. Stopping the flow lead to a contrast signal decrease of ~19%.
Supplemental figure 2 – Frequency spectra of the RF response of positive (black line) and inverted (blue line) ultrasound pulses of varying PNP to MB. The transmit frequency was 1.8MHz. The frequency spectra of the summed response (pulse inversion) is expressed in red. At pressures of 200 kPa and above, frequency peaks outside of the transducer bandwidth emerge, suggesting the presence of soft clipping.
Supplemental file 1 – MATLAB code for the optimized, flash angle, plane-wave, pulse inversion imaging sequence programmed on the Verasonics platform for the P4-1 imaging probe, used in this paper.


