

SUMMARY
Retinal function relies on precisely organized neurons and synapses and a properly patterned vasculature to support them. Alterations in these features can result in vision loss. However, our understanding of retinal organization pathways remains incomplete because of a lack of methods to rapidly identify neuron and vasculature regulators in mammals. Here we developed a pipeline for the identification of neural and synaptic integrity genes by high-throughput retinal screening (INSiGHT) that analyzes candidate expression, vascular patterning, cellular organization, and synaptic arrangement. Using this system, we examined 102 mutant mouse lines and identified 16 unique retinal regulatory genes. Fifteen of these candidates are identified as novel retina regulators, and many (9 of 16) are associated with human neural diseases. These results expand the genetic landscape involved in retinal circuit organization and provide a road map for continued discovery of mammalian retinal regulators and disease-causing alleles.
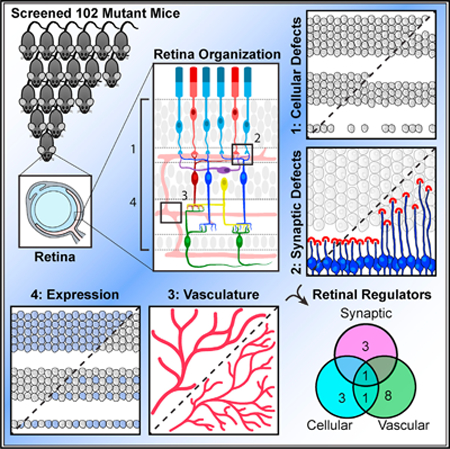
Graphical Abstract
In Brief
Vision requires an organized retina, but many retina regulatory genes remain unknown. Albrecht et al. develop a pipeline for identifying neural and synaptic integrity genes by highthroughput retinal screening. They examine 102 mutant mouse lines and uncover 16 genes responsible for distinct aspects of retina organization.
INTRODUCTION
Humans rely heavily on vision to sense and respond to the world around them, and a preponderance of the central nervous system (CNS) is devoted directly or indirectly to visual processing (Van Essen et al., 1992). Perhaps that is why visual defects, which glob-ally affect 253 million people (http://www.who.int/en/news-room/fact-sheets/detail/blindness-and-visual-impairment), can be so devastating. Vision begins in the retina, a sensory tissue that, in humans, is organized into three cellular and two synapticlayers. These layers are formed from an organized array of distinct neuron types that are connected by synapses and supported by a tripartite intraretinal vascular network. Distinct molecular pathways give rise to these features, and defects in these processes can lead to pathological changes. For example, changes to vascular layers are a hallmark of diabetic retinopathy, the leading cause of acquired blindness in adults, whereas defects in light-sensing photoreceptors can result in diseases such as retinitis pigmentosa (Hoon et al., 2014; Usui et al., 2015a). The genes responsible for regulating these and other retinal features have been explored by mutagenesis screens in invertebrates (reviewed in Bellen et al., 2010), genome-wide association studies (Zelinger et al., 2011; Shanks et al., 2013; Wang et al., 2014; Nishiguchi et al., 2013), and single-gene knockout approaches (Sun et al., 2013; Samuel et al., 2014; Wang et al., 2017a; Peng et al., 2017). Although these approaches have led to the discovery of a number of pathways important in retina structure and function (RetNet; https://sph.uth.edu/retnet/), the genes responsible for vision loss in nearly 40% of affected individuals remain unknown (Audo et al., 2012; Shanks et al., 2013; Wang et al., 2014). Thus, many important regulators may have been missed.
Several challenges have limited our ability to identify mammalian retinal regulatory genes on a large scale. In particular, a suitable model system is needed to parse these genetic path-ways. Ideally, such a system would be both amenable to high-throughput screening and share important retina structural and functional similarities with humans. Given these considerations, we focus here on the mouse retina. This is an excellent system for high-throughput identification of retina regulatory molecules for three reasons. First, the mouse retina is made up of many diverse neuron types (estimated at 100 distinct types; Macosko et al., 2015) that can be identified with robust molecular markers. Second, these neurons and their synapses are ordered in precise layers whose integrity serves as a direct readout of connectivity (Dowling, 2012). Third, unlike the majority of mammals, the mouse retina contains a three-layered intraretinal vascular network similar to that in humans (Usui et al., 2015a).
However, identifying retinal regulatory genes in mice is made difficult by the fact that there are a substantial number of potential candidates but limited ways to test them rapidly in vivo. This is in part due to the cost and time involved in generating knockout animals, and, as a result, few large-scale unbiased neural or retinal screens have been performed in mice (Goldowitz et al., 2004; Pinto et al., 2004; Dwyer et al., 2011). In addition, such screens have largely relied on transposons or chemical mutagenesis, which require post hoc identification and validation of mutations of interest (Ding et al., 2005; Stottmann and Beier, 2010). In contrast, systematic approaches to directed mutant mouse generation and high-throughput retina phenotypic analysis provide a means to obtain genome-wide gene function analysis. Here we advance this goal by pairing the resources available through the International Mouse Phenotyping Consortium (IMPC; Koscielny et al., 2014) with the development of a large-scale platform to map the genetic determinants of retinal organization.
We report detailed analysis of the retinas from 102 mutant alleles (>450 animals) and categorize lines according to their effect on vasculature patterning, cellular arrangement, and synaptic integrity because defects in these features underlie the majority of human retinal diseases. Using this system, we identified 16 retina regulatory genes, 15 of which are novel. We further provide data about exemplar genes whose deletion results in defects in one or more of these categories and assess the predicted interactions between these alleles. These results provide new candidates for unmapped retinal diseases and shed light on the genetic landscape responsible for organizing the mammalian retina.
RESULTS
Identification of Retinal Regulatory Genes
In the mammalian retina, structure dictates function so that disruptions in the integrity and location of retinal vessels and neurons serve as an indication of retinal defects (Dowling, 2012). With these features in mind, we developed a pipeline for the identification of neural and synaptic integrity genes by high throughput retinal screening (INSiGHT; Figure 1A). The goal of this pipeline is to link genetic pathways to cellular and circuit outcomes. To select genes for study, we asked which of the 276 alleles that were analyzed by the Baylor College of Medicine Knockout Mouse Phenotyping Project (BMC KOMP2) center during this study had human orthologs and showed robust expression in the retina and/or brain. Of these, 102 lines met these criteria (Tables S1 and S2). A subset of these lines were embryonic lethal or subviable (40 of 102, with the latter defined as fewer than half of the expected number of homozygous pups viable at weaning from heterozygous breeding pairs; Table S3), so for these lines, heterozygous animals were analyzed.
Figure 1. Large-Scale Identification of Retinal Regulatory Genes.
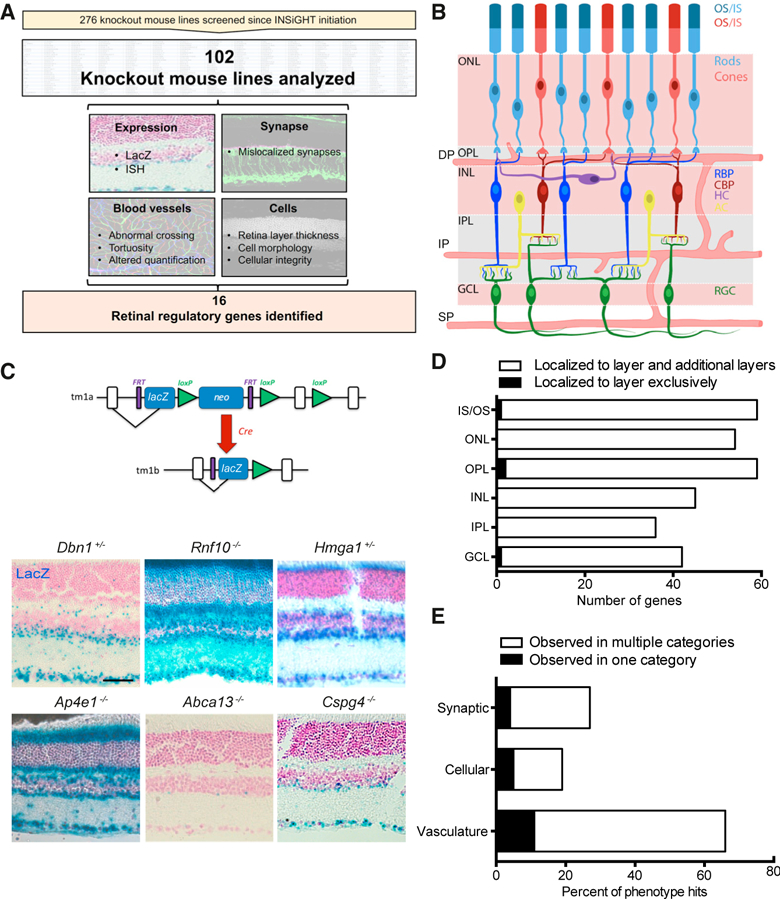
(A) INSiGHT pipeline. 102 of the available 276 lines were selected for inclusion and assayed for defects in topographic patterning of blood vessels and retinal cells, cellular integrity, and synaptic organization. Sixteen lines were identified with defects in one or more of these categories.
(B) Schematic of the retina. The outer nuclear layer (ONL) contains rod and cone photoreceptors with outer segments (OSs) and inner segments (ISs). These cells synapse onto interneurons in the outer plexiform layer (OPL). The inner nuclear layer (INL) is comprised of horizontal cells (HCs), amacrine cells (ACs), rod bipolars (RBPs), and cone bipolars (CBPs); the latter three make connections with retinal ganglion cells in the inner plexiform layer (IPL). The ganglion cell layer (GCL) contains retinal ganglion cells (RGCs), whose axons project to the brain, as well as displaced amacrine cells (not pictured). Blood vessels integrate into this network and form a superficial plexus (SP), intermediate plexus (IP), and deep vascular plexus (DP) in the GCL, IPL, and OPL, respectively.
(C) IMPC allele structure of the LacZ reporter gene and example images of varied expression patterns. Scale bar, 50 μm.
(D) Quantification of the LacZ expression pattern in all 102 mutants across distinct sub-regions of the retina.
(E) Percentage of retinal regulatory genes identified in this study that demonstrated defects in one or more of the tested categories.
See also Data S1, S2, S3, and S4 and Tables S1, S2, S3, and S4.
We used structural and histological assays to examine gene expression patterns, vascular organization, neuronal distribution, and synaptic patterning. In the retina, neuron, synaptic, and vascular layers are spatially segregated (Figure 1B). Rod and cone photoreceptors reside in the outer nuclear layer (ONL) and connect to bipolar and horizontal cells in the outer plexiform layer (OPL). These interneurons are in the inner nuclear layer (INL) together with amacrine cells. Signals are then relayed in the inner plexiform layer (IPL) to retinal ganglion cells in the ganglion cell layer (GCL). Blood vessels interdigitate this circuit and form an interconnected network of superficial plexus (SP), intermediate plexus (IP), and deep plexus (DP) layers in the GCL, IPL, and OPL, respectively. Because each vascular layer can function as a neurovascular unit, localized vascular changes can induce or reflect local metabolic or neuronal defects. With this structure-function relationship, histology can readily reveal cellular, synaptic, and vascular changes that affect the retinal circuit.
First, we examined the expression pattern of each gene. Because the first series of IMPC alleles was generated using a targeted knockin of a lacZ cassette (Figure 1C), we assessed the localized expression of this reporter in the adult retina. Expression patterns varied widely; for some, expression was restricted to particular cellular layers, such as the inner retina (i.e., Dbn1), whereas other genes were expressed more broadly in diverse cell types and synapses (i.e., Rnf10) (Figures 1C and 1D; Data S1). Because LacZ reporters may not always accurately reflect endogenous gene levels, in part because of the potential persistence of this enzyme (Echelard et al., 1994), we also examined gene expression using the serial analysis of gene expression (SAGE; Blackshaw et al., 2001, 2004) database, which reports expression across a range of ages based on in situ analysis (https://cgap.nci.nih.gov/SAGE/mSEM; Table S2). Expression was reported in different parts of the eye for all of the genes for which these data were available (67 of 102). LacZ expression data for other tissues are available through the IMPC portal (https://www.mousephenotype.org/).
We then examined the architecture of the retina using assays designed to identify defects in structural features that underlie neural circuit function: patterning of vessels and organization of neurons and their synapses. To achieve the first goal, we performed optical coherence tomography (OCT) on live animals and also used vessel-specific antibody staining. To accomplish the second goal, we performed a series of immunohisto chemical assays using antibodies to reveal the cellular and synaptic organization of all major retinal neuron types (Table S4). Each of the 102 alleles was thus screened for vascular, cellular, and synaptic defects in assays that examined laminar organization of 14 neuron subtypes, outer and inner retina synaptic strata (Data S1), organization of all three vascular layers, and en face mosaic distribution of both microglia and starburst amacrines (Data S2). Using these methods, we identified 16 unique genes that modify one or more aspects of retina organization (Table 1). These phenotypes fell into three broad categories: alterations in vascular patterning (10 of 16), synapse mislocalization (4 of 16), and changes in cell distribution (5 of 16) (Figure 1E). Of these, two alleles (Bbox1−/− and Ap4e1−/−) displayed phenotypes in more than one category. Consistent with these diverse roles in the retina, each gene was expressed at distinct developmental time points and in diverse populations of retinal cells, as determined in situ. For example, some were broadly expressed in early development (e.g., Dbn1 and Hmga1), whereas others were upregulated in post-mitotic neurons (e.g., Abdh8 and Erc1) (Data S3; Table S5). Below, we describe the phenotypic alterations induced by mutations in these candidates and showcase representative mutant lines in each category.
Table 1.
Genes with Phenotypes in the INSiGHT Pipeline
| Gene Name | Vascular Phenotype |
Cellular Phenotype |
Synaptic Phenotype |
|---|---|---|---|
| Abca13−/− | yes | ||
| Abhd8−/− | yes | ||
| Adsl+/− | yes | ||
| Anapc13+/− | yes | ||
| Ap4e1−/− | yes | yes | yes |
| Aph1a+/− | yes | ||
| Bbox1−/− | yes | yes | |
| Chpt1+/− | yes | ||
| Dbn1+/− | yes | ||
| Erc1+/− | yes | ||
| Hmga1+/− | yes | ||
| Kctd7−/− | yes | ||
| Nxn+/− | yes | ||
| Rad9a+/− | yes | ||
| Rnf10−/− | yes | ||
| Slc44a1−/− | yes |
Sixteen of the 102 assayed mutant lines demonstrated defects in one or more analysis categories: topographic patterning of cells and blood vessels, cellular organization, and synaptic organization. See also Table S7.
Vascular Organization Genes
The retina is one of the most energetically demanding parts of the CNS. Thus, proper development and maintenance of retina vascular networks is critical for normal visual function (Laughlin et al., 1998). Correspondingly, a large number of visual diseases are associated with vascular defects (reviewed in Usui et al., 2015a). In humans, the retina is supported by three interconnected vascular layers. Mice share these retina vascularization patterns (Alm, 1992), making this system particularly useful for assessing genes that may be relevant to human vascular organization. We examined the superficial vascular architecture of the retina using OCT to produce en face fundus images of the eye and the central retinal artery, which branches into four to eight laterally radiating arterioles in wild-type mice. Several mutants displayed alterations in patterning of the arterioles, including increased crossing, branching, or tortuosity, relative to wild-type animals (Figure 2A; Figure S1A; Data S4). To examine these alterations in more detail and to visualize the deeper plexus layers, we stained retinas with an antibody to CD31 (Figure 2B; Data S4A). This revealed significant alterations in vessel density and branching in 10 mutant lines, with up to a doubling of the number of vessel branch points relative to wild-type controls (Figure 2C; Data S4B). These include Adsl+−/ mutants, which are heterozygous for a protein involved in meta-bolism and purine synthesis (Ratner, 1972); Bbox1 −/−mutants, which lack L-carnitine biosynthesis (Rigault et al., 2006); and Anapc13+/− mutants, which lack a subunit of an anaphase-promoting complex (Schwickart et al., 2004).
Figure 2. Vascular Organization Defects in INSiGHT Mutant Lines.
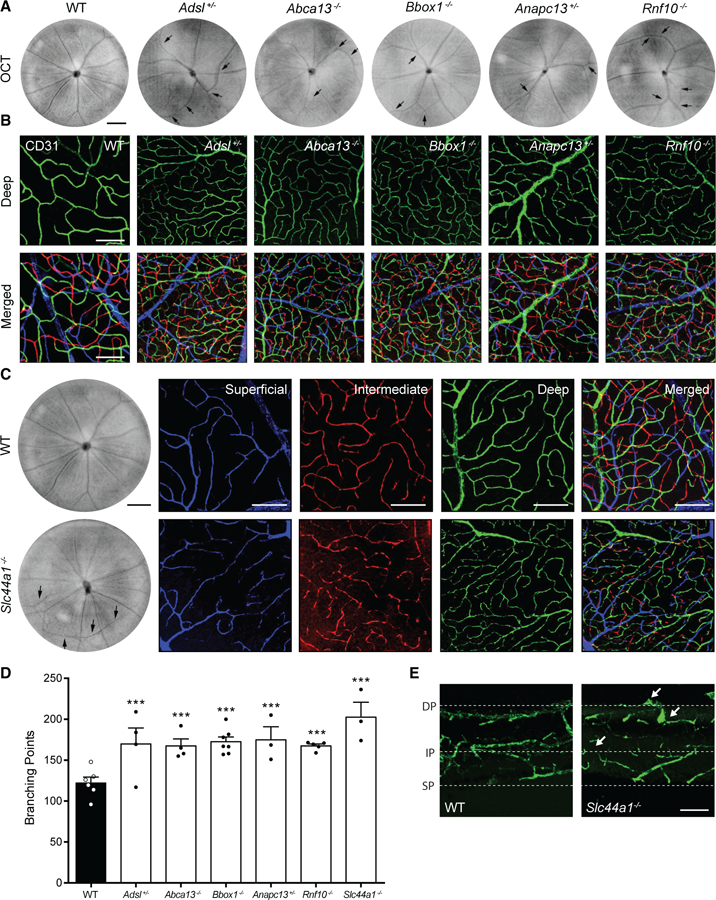
(A) OCT was used to examine mutants for defective patterning of the superficial blood vessels relative to WT controls. Phenotypes included abnormal vessel crossing as in Bbox1−/− mutants (n = 7), a decreased number of arterioles as exemplified in Rnf10−/− mutants (n = 13), and tortuosity as exemplified in Adsl+/− mutants (n = 16). Black arrows denote changes. Scale bar, 250 μm.
(B) To examine inner retina vascularization, mutants were stained with an antibody to CD31. Representative images of the deep (green) and merged vascular layers (deep, green; intermediate, red; superficial, blue) of WT animals and five mutants that demonstrated vascular phenotypes are shown. Scale bar, 100 μm.
(C) Slc44a1−/−animals showed marked defects in superficial blood vessel patterning by OCT (scale bar, 250 µm) as well as alterations in each of the vascular layers following staining for CD31 (deep, green; intermediate, red; superficial, blue; scale bar, 100 µm).
(D) Abnormalities in mutants were quantified in the deep vascular layer by counting the number of vascular branch points relative to WT controls (n = 6) following staining with CD31. Significant alterations were observed in Adsl+/− (n = 4, p < 0.0001), Abca13−/− (n = 4, p = 0.0002), Bbox1−/− (n = 7, p < 0.0001), Anapc13+/− (n = 3, p < 0.0001), Rnf10−/− (n = 5, p < 0.0001), and Slc44a1−/− (n = 3, p < 0.0001, two-way ANOVA and Dunnett’s multiple comparisons test for significance).
Data are represented as the mean ± SEM.
(E) The Slc44a1−/− retina showed a lack of proper restriction to vessel layers relative to WT animals (arrows). Scale bar, 250 μm.
***p < 0.001. See also Figures S1 and S2 and Data S2 and S4.
In particular, animals lacking solute carrier family 44 member 1 (Slc44a1) show marked vascular alterations (Figure 2C). Slc44a1 (also known as CLT1) is a member of the low-affinity Na+-independent choline transporter-like protein family (Traiffort et al., 2013). Because this protein is known to be expressed in human brain microvasculature (Iwao et al., 2016), we explored the vascular changes in Slc44a1- /- mutants in more detail. Quantification of vascular density showed that the intermediate and deep vascular layers both had markedly more branch points relative to wild-type mice. In addition, Slc44a1 −/− vessels are more dispersed and lacked proper restriction to the vascular layers (Figures 2D and 2E). These data identify genes important for fine-tuning vessel patterns and implicate lipid metabolism, membrane, and cell cycle regulatory genes in these events.
Cellular Organization Genes
With simple nuclear staining, individual cellular layers in the retina can be visualized and analyzed. Because changes in the thickness or distribution of these layers can indicate potential neuronal defects, we examined nuclear organization in each mutant (Data S1). Mutations in five genes resulted in retinal thin-ning and putative nuclear loss: the cell cycle checkpoint protein Rad9a+/− (Weinert and Hartwell, 1988), the actin-binding protein Dbn1+/− , the vesicular transport protein Ap4e1−/− (Raza et al., 2015), the L-carnitine biosynthetic enzyme Bbox1 −/− , and the non-histone chromosomal protein Hmga1+/− (Figure 3A). Hmga1 functions as an architectural transcription factor involved in modifying chromatin structure. This protein has been impli-cated in retinoblastoma and other cancers (reviewed in Sumter et al., 2016) but the roles of this molecule in differentiated neu-rons are less clear. We used this mutant line to assess whether these cellular changes reflected alterations to specific neuron types.
Figure 3. Cellular Defects in INSiGHT Mutant Lines.
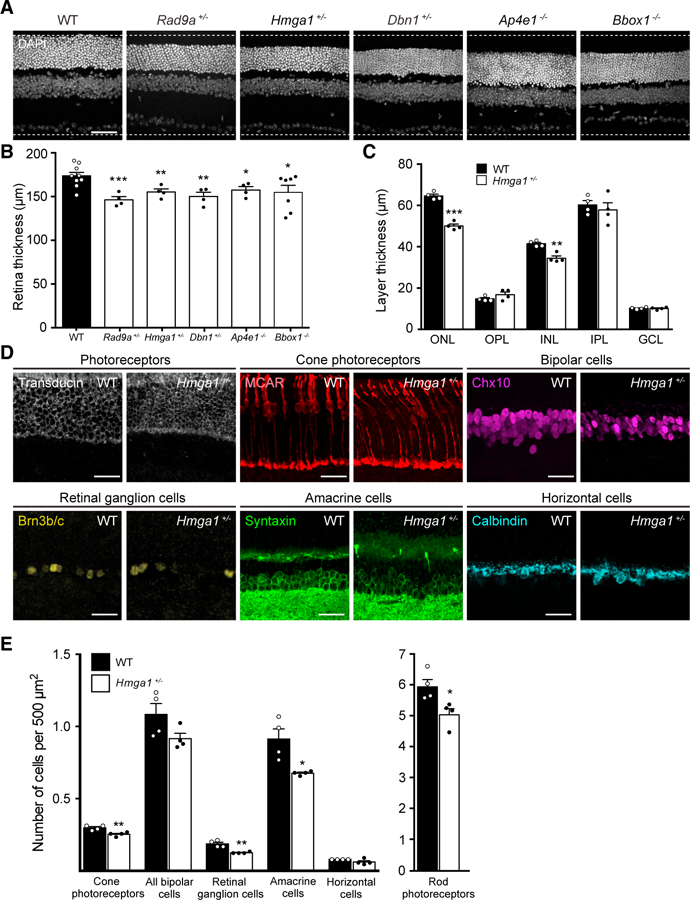
(A) Nuclei were stained using DAPI (gray) to identify mutants with defects in cellular organization. Representative images of WT animals and five mutants that demonstrated nuclear thinning are shown. Scale bar, 50 μm.
(B) Cellular abnormalities in affected mutants were quantified by measuring the thickness of the retina relative to WT controls (n = 10) following staining with DAPI. Significant alterations were observed in Rad9a+/− (n = 4, p = 0.0005), Hmga1+/− (n = 4, p = 0.0046), Dbn1+/− (n = 4, p = 0.0066), Bbox1−/− (n = 7, p = 0.0279), and Ap4e1−/− (n = 4, p = 0.0153, unpaired two-tailed Student’s t test).
(C) In Hmga1+/− animals, the thickness of each cellular and synaptic layer was visualized and quantified using DAPI to assess the width relative to WT controls (n = 4). Significant thinning was noted in the ONL (p < 0.0001) and INL (p = 0.0366, unpaired two-tailed Student’s t test).
(D and E) All major neuron types were visualized in WT and Hmga1+/− animals using antibodies specific for each population (D): rods (transducin, white), cones (MCAR, red), bipolar cells (Chx10, magenta), retinal ganglion cells (Brn3b/c, yellow), amacrine cells (Syntaxin, green), and horizontal cells (calbindin, cyan) (n = 4). Scale bars, 25 μm. The relative numbers of all major neuron types were then quantified (E). Significant reductions were observed in several neuron types (cones, p = 0.0065; retinal ganglion cells, p = 0.0020; amacrine cells, p = 0.0154; rods, p = 0.0269; unpaired two-tailed Student’s t test).
Data are represented as the mean ± SEM.
***p < 0.001, **p < 0.01, *p < 0.05. See alsoFigure S2B.
To characterize the Hmga1 mutant allele, we quantified the thickness of each retinal layer. Hmga1+/− mutants displayed reduced thickness of the ONL and INL, whereas the OPL was somewhat increased (ONL, 22.5% reduction, p < 0.0001; INL, 17.0% reduction, p = 0.0015; Figures 3B and 3C). These alterations were independently verified using an automated volumetric retinal layer thickness segmentation analysis of the OCT data (Figure S4B). To determine which neuron subsets underlie these alterations, we stained, imaged, and quantified all major neuron types in this line (Figure 3D). We found that Hmga1 is required in specific subsets of neurons that reside in the outer and inner retina. Mutants displayed decreased numbers of rod and cone photoreceptors, amacrine cells, and retinal ganglion cells relative to controls (15.2%, 15.0%, 25.9%, and 32.8% reduction, respectively; Figure 3E). In contrast, the numbers of horizontal cells and bipolar cells were not statistically different, although a trend toward decreased cell numbers was observed (Figures 3D and 3E). Interestingly, our LacZ staining suggests that Hmga1 may be expressed abundantly in neurons (Figure 1B). These results hint at neuron-specific functions for Hmga1 in regulating cell development or survival.
Synaptic Regulatory Genes
In the outer retina, synapses form between bipolar and horizontal cell interneurons and rod and cone photoreceptors. These OPL synapses localize to a thin band and are ordered and quite large, making it possible to see even single synaptic rearrangements by immunohistochemistry (Figure 1B). As a result, OPL disorga-nization is a sensitive readout for connectivity changes. We noted several lines in which OPL organization was disturbed: Aph1a+/− , a gamma secretase complex protein (Takasugi et al., 2003); Erc1+/− , a RIM-binding protein (Wang et al., 2002); Chpt1+−/ , which catalyzes phosphatidylcholine biosyn-thesis (Henneberry et al., 2000); and Ap4e1 −/− (Figures 4A and 4B). To further explore the molecular basis for such changes, we focused our analysis on Ap4e1−/−. This protein complex plays an important role in secretory and endocytic pathways, and human AP4E1 mutations are associated with autosomal recessive spastic paraplegia (Mendelian Inheritance in Man [MIM]: 613744) and autosomal dominant familial persistent stut-tering 1 (MIM: 184450). However, the cellular and molecular ba-ses for these diseases are not well understood (Raza et al., 2015). Mouse mutants lacking Ap4e1 showed marked reordering of the OPL (Figure 4C). We observed the retraction of rod termi-nals as characterized by mislocalized PSD95 staining as well as abnormal extension of postsynaptic neuron dendrites into the photoreceptor layer (Figures 4C–4E).
Figure 4. Synaptic Organization Defects in INSiGHT Mutant Lines.
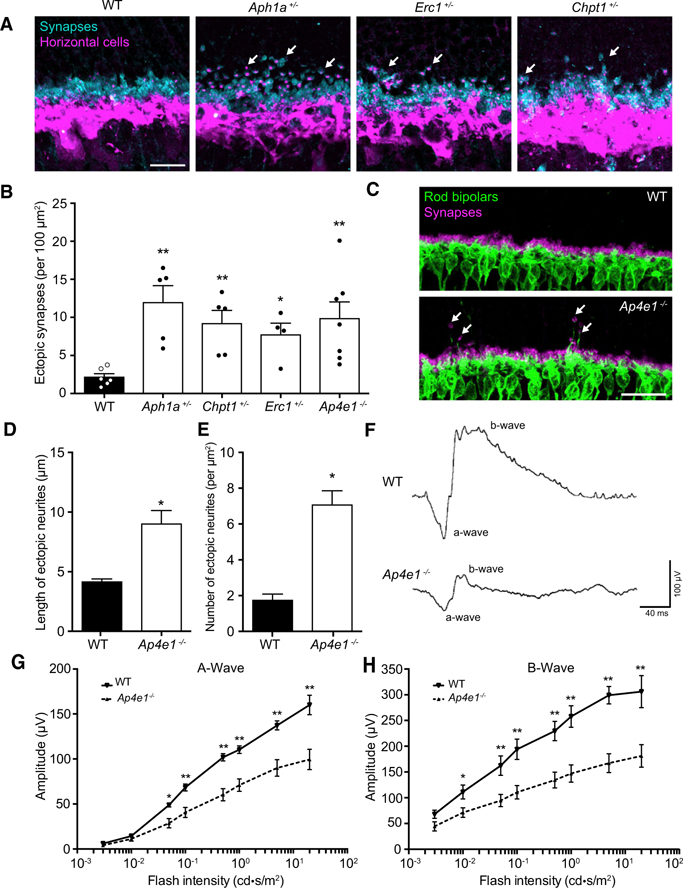
(A) Staining for the synaptic marker PSD95 (cyan) and horizontal cells (calbindin, magenta) was used to identify mutants with defects in OPL patterning. Representative images from WT animals and four affected mutants are shown. Arrows indicate synaptic defects. Scale bar, 15 μm.
(B) The relative levels of synaptic alterations were quantified in WT mice and affected mutants using an antibody to PSD95. Significant increases in the number of mislocalized synapses were observed in Aph1a+/− (n = 5, p = 0.0043), Chpt1+/− (n = 5, p = 0.0043), Erc1+/− (n = 4, p = 0.0286), and Ap4e1−/− (n = 7, p = 0.0012) animals (unpaired two-tailed Student’s t test).
(C–E) Ap4e1−/− animals (n = 7) display marked remodeling of the OPL (C, arrows; quantified in D and E) compared to the WT (n = 6), as revealed by staining for horizontal cells and presynaptic terminals (calbindin, magenta; PSD95, cyan). Both the length and the number of ectopic terminals were increased relative to WT controls (p = 0.0031 and p = 0.0012, respectively; unpaired two-tailed Student’s t test).
(F–H) Full-field electroretinograms were recorded from WT (n = 6) and Ap4e1−/− animals (n = 11). Representative traces are shown. (F) A significant reduction was observed in the a-wave amplitude for flash intensities greater than 0.01 cd*s/m2 (G) and all b-wave amplitudes for flash intensities greater than 0.003 cd*s/m2 for dark-adapted mice relative to WT controls (H). p = 0.0428, p = 0.0162, p = 0.0053, p = 0.0091, p = 0.0155, and p = 0.0158 for scotopic a-waves at 0.05, 0.1, 0.5, 1.0, 5.0, and 20.0 cd*s/m2, respectively; p = 0.0485, p = 0.0180, p = 0.0113, p = 0.0104, p = 0.0078, p = 0.0022, and p = 0.0180 for scotopic b-waves at 0.01, 0.05, 0.1, 0.5, 1.0, 5.0, and 20.0 cd*s/m2, respectively; unpaired t test using the Holm-Sidak method to correct for multiple comparisons.
Data are represented as the mean ± SEM. **p < 0.01, *p < 0.05.
To determine whether these structural alterations affect circuit function, electroretinography (ERG) recordings were conducted with flash intensities ranging from 0.003 cd*s/m2 to 20 cd*s/m2. Ap4e1−/−mice showed reduced responses in both the scotopic a-wave, which represents photoreceptor function, as well as the scotopic b-wave, which is a readout of synaptic transmission between photoreceptors and their partners (p % 0.043 and p % 0.049, respectively; Figures 4F–4H). These results are consistent with the histologic defects in Ap4e1 mutants and sug-gest that the structural alterations we document in this and other mutants can directly affect neural function. Brain abnormalities documented in human patients with AP4E1 mutations are consistent with these data because both microcephaly and reduced thickness of the hippocampal and other brain regions have been reported (Moreno-De-Luca et al., 2011).
Retinal Regulators and Protein Network Interactions
The candidate retina regulatory genes encode proteins with a wide range of biological functions, likely reflecting the large diversity of cell types and circuits in the retina. We examined the potential interactions between these genes and known genetically mapped human retinal disease genes (Figure 5A). The predicted network interaction shows that a large number of known retinal disease genes (105) mapped to seven densely connected clusters, which encompassed genes involved insignal transduction, sensory projection, neuron developmentcell differentiation, metabolic process, cell communication, and transport. Six of the candidate genes had connections with at least one other known retinal regulator,and, among these, two mapped to a densely connected cluster. A large number of the candidates, however (10 of 16), were unconnected to any other regulator, highlighting the unique biological features of many of these genes. We also undertook a gene ontology analysis of our candidates and the mapped human retinal disease genes (Figure 5B; Table S6). Although there was no particular enrichment when our 16 candidates were analyzed alone, we observed a wide range of enriched functions when these genes were analyzed together with the known human retinal regulators. At the highest ontological levels, the candidates clustered into broad functional categories (i.e., cellular process and developmental process). However, this representation greatly declined at lower ontological levels, consistent with the unexplored and/or uncategorized functions of these proteins relative to the majority of known retinal regulators.
Figure 5. Protein Network Interactions and Gene Ontology Analysis of Retinal Candidates and Known Retinal Disease Genes.
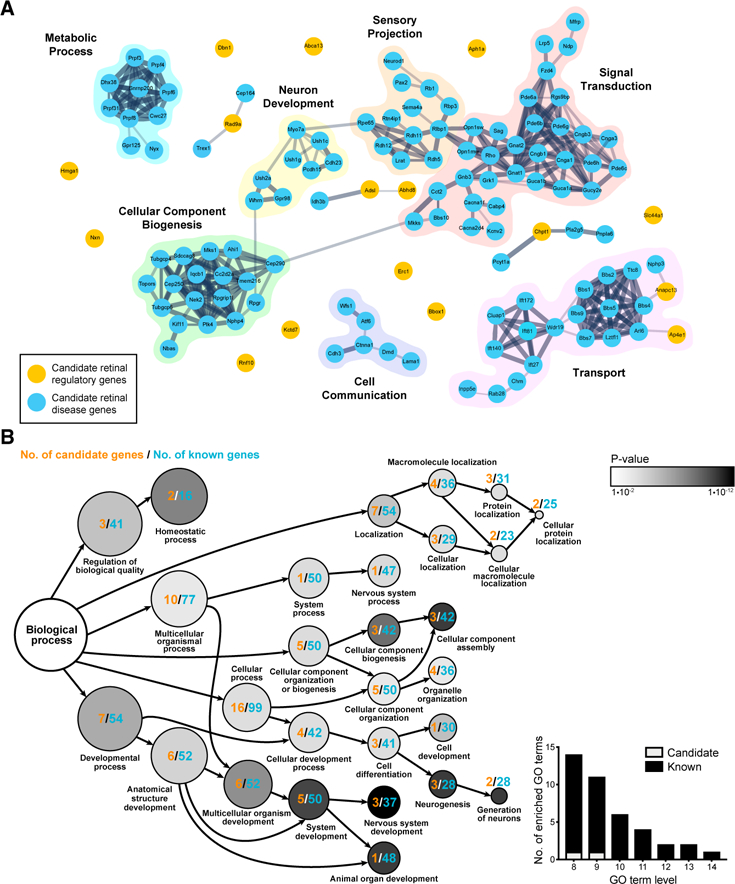
(A) A STRING interaction map, including known and predicted interactions, was generated for our candidates(16)andmouseorthologs oftheknown human retinal disease-causing genes (113). Proteins are presented as nodes, where orange denotes the INSiGHT candidate genes, and blue denotes known human retinal disease genes. Nodes are connected by gray edges whose thickness represents the combined confidence score of ≥ 0.4, summated from the evidence types ‘‘experiments,’’ ‘‘databases,’’ ‘‘co-expression,’’ ‘‘neighborhood,’’ ‘‘gene fusion,’’ and ‘‘cooccurrence.’’ We observed and curated seven clusters based on shared themes that most differentiate the known human retinal diseasecausing genes (‘‘metabolic process,’’ ‘‘neuron development,’’ ‘‘sensory projection,’’ ‘‘signal transduction,’’ ‘‘cellular component biogenesis,’’ ‘‘cell communication,’’ and ‘‘transport’’). The densely connected clusters (shaded) consist of 104 known retinal disease-causing genes and 2 candidate genes. The majority of INSiGHT candidate genes (14 of 16) are unconnected to the shaded clusters.
(B) Over-represented biologic process gene ontology terms (p ≤ 0.05) for the combined list of the retinal regulatory candidates (16) and known human retinal disease-causing genes were identified using g:GOSt. These terms were used to generate a directed tree graph in which we show gene ontology terms that contain one or more candidate genes. The ontological level and degree of significance are indicated within the circles, where higher degrees of significance are depicted as successively darker shades of gray, and lower ontological levels are depicted as successively smaller circle sizes. For a given gene ontology term,theassociated INSiGHTcandidates(orange) and known retinal disease-causing genes (blue) were counted. The inset contains data from levels L8–L16 and illustrates that candidates are depleted at lower ontology levels.
See also Table S6.
Next we assessed whether the retina regulatory genes we identified in the mouse overlapped with or extended the compendium of retinal regulators identified in other species. Toward this end, we used data from the Model Organism Aggregated Resources for Rare Variant Exploration (MARRVEL; Wang et al., 2017b) to examine the orthologs of the retina regulatorygenes we identified. As a group, the genes we assessed in this study were quite conserved across species, and the majority had clear orthologs in humans (101 of 102), zebrafish (85 of 102), fly (55 of 102), and worm (43 of 102) (Table S1). Of the 16 candidate regulators identified in our analysis, 1 has a documented link to retina organization or disease (Hmga1, retinoblastoma; Mu et al., 2010). For the remaining 15 genes, this analysis represents the first description of retina function in human, mouse, zebrafish, or fly (Table S7). These data highlight the utility of conducting large-scale retinal screens in mammals and suggest landscape of biological processes known to regulate the retina.
Because we observed a wide array of cellular functions among the candidates, we questioned whether they may play additional roles in other organ systems. To begin to assess this, we took advantage of the comprehensive physiological and morphological assessment each mutant line undergoes as part of the standardized IMPC phenotyping. In Table 2, we present a summary of the additional phenotypes observed for the 16 candidate retina regulators (for all genes in this analysis, see Table S8). These phenotypic data are also available through the IMPC portal, https://www.mousephenotype.org/. Similar to known retina regulators that have been phenotyped by KOMP (Table S9), most of our lines (12 of 16) exhibit additional phenotypes. However, there was an enrichment among a subset of these tests in our candidates, with the largest number showing alterations in body composition (56%) and open field tests (50%). The former may reflect the predicted lipid metabolism functions of many of these alleles, whereas the latter may implicate these genes in CNS regulation more broadly.
Table 2.
Additional Significant KOMP Pipeline Phenotypes for Retinal Regulatory Candidates Identified in This Study
| Gene | IMPC Procedural Phenotyping Data |
||||||||||||
|---|---|---|---|---|---|---|---|---|---|---|---|---|---|
| Eye Morphology |
Acoustic Startle and Pre-pulse Inhibition (PPI) |
Body Composition |
Calorimetry | Clinical Blood Chemistry |
Grip Strength |
Heart Function |
Hematology | Intraperitoneal Glucose Tolerance Test (IPGTT) |
Open Field |
Organ Weight |
X-Ray | Combined SHIRPA and Dysmorphology |
|
| Abca13−/− | 0/17 | 0/4 | 0/9 | 0/4 | 0/16 | 0/6 | 0/24 | 0/8 | 0/3 | 0/10 | 0/1 | 0/14 | 1/75* |
| Abhd8−/− | 0/23 | 0/4 | 5/9* | 1/4* | 0/20 | 0/6 | 0/24 | 0/8 | 0/3 | 4/10* | 0/1 | 1/25* | 0/76 |
| Adsl+/− | 1/23* | 0/4 | 0/9 | 0/4 | 0/19 | 0/6 | 0/24 | 0/8 | 0/3 | 0/10 | 0/1 | 0/25 | 0/76 |
| Anapc13+/− | 0/23 | 0/4 | 0/9 | 0/4 | 0/19 | 0/6 | 0/24 | 0/8 | 0/3 | 0/10 | 0/1 | 0/25 | 0/76 |
| Ap4e1−/− | 0/24 | 4/6* | 7/8* | 1/3* | – | 1/3* | – | 0/22 | 1/3* | 15/27* | 2/4* | 1/32* | 2/34* |
| Aph1a+/− | 0/23 | 0/4 | 2/9* | 0/4 | 0/18 | 0/6 | 0/24 | 0/8 | 0/3 | 6/10* | 0/1 | 0/25 | 1/76* |
| Bbox1−/− | 0/29 | 0/4 | 0/9 | 0/1 | – | 0/2 | 0/24 | 0/22 | 0/3 | 3/15* | 0/2 | 0/27 | 0/34 |
| Chpt1−/− | 0/28 | 0/4 | 0/9 | – | 0/18 | 0/6 | – | 0/8 | 0/3 | 0/28 | 0/2 | 0/25 | 0/77 |
| Dbn1−/− | 2/41* | 1/6* | 6/8* | 0/3 | 8/24* | 1/3* | – | 2/22* | 0/3 | 2/15* | – | 0/25 | 0/36 |
| Erc1+/− | 0/22 | 0/4 | 0/9 | 0/4 | 0/18 | 0/6 | 0/24 | 0/8* | 0/3 | 0/10 | 0/1 | 0/25 | 0/76 |
| Kctd7−/− | 0/23 | 0/4 | 0/9 | 0/4 | – | 0/6 | 0/9 | 0/8 | 0/3 | 0/28 | 0/1 | 0/25 | 0/77 |
| Hmga1+/− | 3/35* | 0/4 | 2/9* | – | 1/16* | 0/6 | 0/24 | 0/8 | 0/3 | 2/10* | 0/1 | 0/25 | 0/76 |
| Nxn+/− | 2/34* | 0/6 | 3/9* | 0/3 | – | 0/2 | – | 0/22 | 0/3 | 0/12 | – | 0/22 | 0/42 |
| Rad9a−/− | 0/35 | 0/4 | 1/9* | 0/1 | 0/16 | 0/6 | 0/24 | 0/8 | 0/3 | 0/8 | – | 0/25 | 0/15 |
| Rnf10−/− | 6/25* | 2/6* | 7/8* | 0/3 | 11/43* | 3/3* | – | 5/22* | 0/3 | 11/15* | 1/4* | 1/33* | 4/33* |
| Slc44a1−/− | 0/23 | 1/4* | 6/9* | 1/4* | 0/18 | 0/6 | 0/24 | 0/8 | 0/3 | 3/10* | 0/1 | 0/25 | 4/33* |
The majority of the mutants display additional significant phenotypes (12 of 16), with the greatest number displaying defects in body composition (9 of 16) and open field tests (8 of 16). The number of phenotypes with significant phenodeviance (*p < 0.0001) is shown over the number of tests performed in each category. All primary phenotype data are available through the IMPC portal. SHIRPA, SmithKline Beecham, Harwell, Imperial College, Royal London Hospital, phenotype assessment. See also Tables S8 and S9.
DISCUSSION
In this study, we deployed a systematic approach unique in its breadth, sensitivity, and cell specificity for uncovering and characterizing mammalian retinal organization genes that leverages genome-wide knockout resources. We used in vivo and in vitro methods to identify 16 genes that regulate vascular, cellular, and synaptic organization in the retina. Of these, 15 were candidates that had not been previously associated with retina organization in other model organisms.
Our approach addresses a major bottleneck in understanding the retina specifically and the nervous system broadly: the ability to effectively and rapidly identify molecules that regulate specific cells and synapses. Our efforts complement those of other groups who have used mutagenesis, CRISPR, or other technologies to identify such molecules in a range of model organisms (Goldowitz et al., 2004; Pinto et al., 2004; Bellen et al., 2010; Yamamoto et al., 2014; Sarin et al., 2018; Shah et al., 2015). Each of these approaches offers unique opportunities for molecular function discovery, and the nature of the genes we describe illustrate the importance and emerging feasibility of conducting highcontent screens for retina regulators in mammals. These results provide a rich resource for both the scientific and clinical communities.
Each of the 16 retina regulatory candidates will merit further study. Many show expression patterns in the retina that hint at cell-specific functions that may affect neuronal development,vascular development, or both. For example, both broadly expressed genes (e.g., Rnf10) and genes with restricted expression (e.g., Bbox1) demonstrated vascular alterations. These data are consistent with reports describing distinct functions for particular classes of retinal neurons, including amacrine cells, retinal ganglion cells, and photoreceptors, in the development of individual inner retina vascular layers (Lahdenranta et al., 2001; Sapieha, 2012; Usui et al., 2015b). Along these lines, Slc44a1 is an interesting vascular regulatory candidate. We document its expression within ONL and INL, and the energetic demand from these neurons is known to play roles in recruiting and maintaining vascularization of the inner retina (Lahdenranta et al., 2001). Consistent with this idea, we observed marked changes in the deep and intermediate vascular networks in this line. Although neurons can affect and direct vessel formation, vascular integrity can also affect neural and synaptic function and organization. For example, human retinal vascular diseases such as diabetic retinopathy can lead to synaptic defects and neuronal loss (Moran et al., 2016). Bbox1−/− and Ap4e1−/− animals showed both vascular rearrangement as well as synaptic or cellular defects. Future longitudinal studies of these and other mutant lines will be necessary to resolve whether cellular and synaptic alterations precede, coincide with, or follow vascular alterations.
These retinal regulatory candidates inform and expand the genetic pathways implicated in retinal organization. Broadly, these genes could be grouped into three categories: those that had an established link to retinal disease, those that were novel but shared pathways or features with other retina regulators, and those that expanded the networks currently known to regulate retina organization. Among the candidates, Hmga1 fell into the first category. Overexpression of HMGA1 has been linked to the progression of retinoblastoma (Mu et al., 2010), and the closely related gene Hmga2 modulates retina progenitor cell self-renewal (Parameswaran et al., 2014). These data, together with the reduction in neuron numbers we observedin Hmga1+/− animals, suggest that Hmga1 expression levels may affect cell proliferation. The remaining 15 candidates have not yet been linked to retina organization. Among these, 2 mapped to gene function clusters densely populated by known retina disease genes, 4 had links to just a few known genes, and the rest (9) fell into the latter category and expanded the genetic pathways implicated in retina regulation. These 9 candidates had diverse biological functions ranging from metabolism to cellular transport. In some cases, genes that regulated the same aspect of retina organization were functionally diverse. For example, synaptic regulators were involved in metabolism (Chpt1; Henneberry et al., 2000), vesicular trafficking (Ap4e1 [Raza et al., 2015] and Erc1 [Wang et al., 2002]), and protein processing (Aph1a, Takasugi et al., 2003). Consistent with this, proteins involved in other metabolic processes (e.g., LKB1; Samuel et al., 2014) and trafficking pathways (e.g., AP3B2; Sanuki et al., 2015) have also been linked to abnormal retina synaptic patterning. In other cases, particular biologic functions may play more significant roles; 2 of the vascular regulators are involved specifically in choline biosynthetic or transport pathways (Chpt1 and Slc44a1). Choline imbalances have been linked to vascularization defects in cultured human placental trophoblasts (Jiang et al., 2014), and inhibition of phospholipase D (which generates choline from phosphatidylcholine) induced angiogenesis defects in zebrafish (Zeng et al., 2009). These data support the idea that lipid metabolism generally and choline metabolism specifically may be central to vascularization. We expect that combining the pathways we identify with larger-scale gene ontology mapping of known retinal regulators may help bootstrap discovery of additional vascular and cellular regulators among proteins with similar functions.
IMPC mutants are generated as full-body knockouts, and a comprehensive analysis is conducted on each mutant through the IMPC pipeline. This enabled us to assess the diverse range of phenotypes associated with both the candidate retinal regulators we describe as well as the known human retinal disease genes. Nearly all of the candidate retina organizers had additional phenotypes. These results are consistent with the broad range of KOMP phenotypic defects exhibited by mouse mutants lacking known human retinal disease regulators. These data may help inform studies of human patients in four ways. First, they may support screening of humans with particular genetic retina disorders for additional phenotypes that may affect health or treatment outcomes. For example,mutations in FAM161A are primarily associated with vision loss in humans, but mice lacking this protein showed additional significant hearing and heart function defects. Such examples represent an opportunity for further human diagnostic studies and potential phenotypic expansion. Second, these data support the notion that particular co-morbidities are more likely to be associated with visual deficits. One well documented example of this is the co-occurrence of metabolism pathologies such as diabetes and visual decline (Usui et al., 2015a; Moran et al., 2016). Consistent with this, we observed an enrichment for body composition defects among our candidate retina regulators (9 of 16) as well as known human retinal disease genes (17 of 72). Additional analysis of cell- or tissue-specific knockouts will be necessary to resolve whether these effects contribute to the retina phenotypes we describe. Third, similar to many known human retina and neural diseases (e.g., aniridia [MIM: 106210] and macrocephaly [MIM: 605309]), several of the candidates appear to display gene dosage effects so that homozygous knockouts were embryonic lethal, whereas heterozygotes were viable but displayed neural alterations (9 of 16). These lines will enable further studies of the mechanisms by which haploinsufficiency can lead to detrimental neurological phenotypes. Finally, for 15 of 16 candidate genes, retinal disease links in humans have not yet beenv reported. These alleles are prime candidates for unmapped human retinal disease cases.
Because the retina is a part of the CNS and laminar organization is a determinant of CNS connectivity, the genes we identified may also be interesting to study in the brain. Indeed, a number of the lines showed defects in behavior tests like open field (8 of 16), and several have been linked to one or more human neural disorders (e.g., Adsl, Ap4e1, Bbox1, and Dbn1). For these disorders, our results could provide insight into potential molecular and cellular disease mechanisms. For example, AP4 deficiency neurological syndrome is associated with mutations in Ap4e1, but how and why this leads to neural defects remains a mystery. Based on our data, we hypothesize that Ap4e1 is directly required for synaptic organization and function. It will be interesting to determine whether these results can inform the biological basis for this and other lesser described brain and retina diseases.
In sum, the data we present here describe a retinal screening paradigm in mammals we used to identify 16 genes with new associations to retinal phenotypes. Given that international efforts are underway to map retina and brain circuits and document their expression profiles, parallel efforts are needed to systematically uncover the genes that functionally control the organization of these circuits. The approaches we present here begin to fill this gap and may help improve our ability to understand and combat human retinal disease.
EXPERIMENTAL PROCEDURES
Mouse Strains
All mouse strains were generated by the BMC KOMP2 center using embryonic stem cells (ESCs) from the International Knockout Mouse Consortium (IKMC) on the C57BL/6N background. Control animals were obtained as littermates or from The Jackson Laboratory (Bar Harbor, Maine). Experiments were carried out in accordance with the recommendations in the Guide for the Care and Use of Laboratory Animals of the NIH under protocols approved by the BCM Institutional Animal Care and Use Committee (IACUC).
Selection of Genes for INSiGHT Analysis
We used data from NCBI’s gene portal (https://www.ncbi.nlm.nih.gov/gene), Mouse Genome Informatics (MGI) (http://www.informatics.jax.org/), UniProt (https://www.uniprot.org/), MARRVEL, and PubMed to select genes for inclu-sion in the INSiGHT pipeline from among those assigned to the BCM KOMP2 center. All phenotyping data for these lines are available from the IMPC portal (www.mousephenotype.org) and were accessed on May 10, 2018 or earlier. Based on tissue availability from the BCM KOMP2 center, between 2 and 10 animals per genotype were screened for histological alterations to retinal neuron and synaptic architecture by immunohistochemistry as detailed below. Two independent investigators evaluated each genotype. For all experiments, the sex of the animals was documented but was not included as a variable in the analysis.
Ortholog Prediction
To assess conservation of the genes in humans, flies, and zebrafish, we first obtained the raw data for the genes by utilizing DIOPT (Drosophila RNAi Screening Center [DRSC] Integrative Ortholog Prediction Tool) to obtain putative orthologs across species and MARRVEL to obtain gene ontology data. Putative orthologs of mouse genes in humans, flies, and zebrafish are filtered with high-stringency criteria, which includes genes that are most highly predicted to share orthology in both forward and reverse analyses. Each of the genes iden-tified in the IMPC analysis was then matched to orthologs in the three other organisms.
OCT
Spectral domain optical coherence tomography (SDOCT) was performed using an Envisu R2200 OCT system (Leica Microsystems). Full volumes of the retina and the cornea and lens were recorded in 15-week-old animals. The frequency of mice in each line showing abnormal vessel patterns was recorded. For subsets of mutants, an automated volumetric retinal layer thickness segmentation program (InVivoVue Diver, version 3.0.8, Leica Microsystems) was used to quantify the retinal layers. A more detailed description of the method can be found in the Supplemental Experimental Procedures.
Tissue Preparation and Immunohistochemistry
Eyes were collected from 16-week-old animals and fixed for 45 min in 4% paraformaldehyde (w/v) in lactated Ringer’s solution and then rinsed with PBS. Cryosections and retina whole mounts were prepared as described previously (Samuel et al., 2014). In brief, for cross-section analyses, the optic cup was cryoprotected in 30% sucrose, embedded in tissue freezing medium (Sakura Finetek), and sectioned at 20 mm. For vascular cross-section analysis, 100-mm vibratome sections were prepared from retinas embedded in 5% agarose blocks. All samples were then incubated in blocking solution (3% normal donkey serum and 0.3% Triton X-100 [v/v] in PBS) and with primary and secondary antibodies (Jackson ImmunoResearch Laboratories) (Table S4). For whole-mount staining, the retina was removed and incubated in blocking solution (10% normal donkey serum and 0.5% Triton X-100 [v/v] in PBS), followed by primary antibody and secondary antibody labeling at 4 C. All samples were mounted in Vectashield (Vector Laboratories). Images were acquired on an Olympus FluoView FV1200 confocal microscope and processed using Fiji. Images were acquired with the following specifications: whole mount, 635 μm 3 635 μm (Figure 2; Data S2 and S4); antibody cross-section, 211 μm 3 211 μm (Figures 2, 3, and 4; Data S1); and in situ, 317 μm 3 317 μm (Data S3).
LacZ Staining
Rehydrated retina cryosections (20 μm) were fixed with 4% paraformaldehyde (PFA) (5 min), washed in PBS, and incubated in LacZ staining solution (2 mM MgCl26H2O, 0.01% deoxycholic acid, 0.02% IGEPAL CA-630, 5 mM K4Fe(CN)63H2O, 5 mM K3FE(CN)6, 0.1% [1 mg/mL] X-Gal in dimethylfor- mamide [DMF], and cold PBS [pH 8]) at 37°C for 48 hr. Samples were then washed in PBS, post-fixed for 10 min, washed again, and then counterstained with Nuclear Fast Red. Samples were dehydrated in an ethanol gradient (70%, 100%, and 100%), cleared in xylene (3 × 30 s each), and mounted in Cytoseal XYL. 211 μm × 211 μm images were acquired on a Zeiss epifluorescence microscope.
In Situ Hybridization
In situ hybridization was performed by the RNA In Situ Hybridization Core at BCM using an automated robotic platform as described previously (Yaylaoglu et al., 2005) with minor modifications. In brief, we prepared digoxigenin (DIG)-labeled riboprobes using cDNA generated from mouse brain RNA (embryonic day 15 [E15] and post-natal day 7 [P7]). The PCR primers shown in Table S5 were used to generate cDNA fragments corresponding to the desired ribop-robes. A more detailed description of the method can be found in the Supplemental Experimental Procedures.
Histological Quantification
All quantification was performed in Fiji using images collected from 4 to 8 animals per group with at least 3 image stacks per animal. Images were acquired at equivalent retinal eccentricities from the optic nerve head; measurements were performed using 5–10 non-consecutive single optical planes per image. For total retina thickness, measurements were performed in both the central and peripheral retina, and values were averaged. For synaptic quantification, retinal sections were stained using PSD95, calbindin, and DAPI to visualize ectopic neurites that extended at least one nucleus above the OPL. To determine the number of ectopically localized rod bipolar terminals, retinal sections were stained using protein kinase Cα (PKCα) and DAPI. To quantify all major neuron types in mouse mutant lines, we used antibodies that mark each cell type. Cones, bipolar cells, amacrine cells, horizontal cells, and retinal ganglion cells were labeled with antibodies to mouse cone arrestin (MCAR), Ch×10, syntaxin, calbindin, and Brn3b/c, respectively. The total number of positively stained soma for each neuron type was determined in a standardized 211 μm × 211 μm area from single optical sections. Rods were quantified as the total number of DAPI-positive but MCAR-negative cells in the ONL. For vasculature analyses, retinas were harvested and processed for whole-mount staining using an antibody to CD31. Images were collected from 3 to 7 animals per group. The number of branch points were quantified in merged images from 20–50 consecutive optical sections to visualize each vascular layer.
ERG
Female (n = 9) and male (n = 2) Ap4e1 / and wild-type (WT) female (n = 3) and male (n = 3) controls were dark-adapted overnight and anesthetized with 1.5% isoflurane at an oxygen flow rate of 1.0 L/min. Pupils were topically dilated with phenylephrine hydrochloride and tropicamide, and mice were placed on a heated platform. Scotopic responses were elicited in the dark with flashes ranging from 0.003 cd*s/m2 to 20 cd*s/m2 using the Diagnosys Celeris ERG system. Electroretinograms were monitored from both eyes simultaneously with a contact lens-style electrode in contact with Gonak solution on each cornea. For the dark-adapted intensity series, a ground electrode was subcutaneously placed into the forehead, and a reference electrode was placed into the hip.
STRING Analysis
Assessment of functional protein-protein interactions between our candidates and known orthologous human retinal disease genes was undertaken using Search Tool for the Retrieval of Interacting Genes/Proteins (STRING) (version 10.5) at a combined medium confidence score of ≥ 0.4, summated from evidence types ‘‘experiments,’’ ‘‘databases,’’ ‘‘co-expression,’’ ‘‘neighborhood,’’ ‘‘gene fusion,’’ and ‘‘co-occurrence.’’ The network is presented as an undirected map, with nodes representing the genes and edges representing the interactions between the proteins encoded by the genes.
Gene Ontology Analysis
The gene group functional profiling (Gene Ontology Statistics [g:GOSt]) analysis tool from g:Profiler was used to conduct gene ontology (GO) analysis on a combined set of our candidate retinal regulatory genes (16) and known retinal disease-causing genes (113). Gene functions were categorized into 3 groups: biological process (BP), cellular component (CC), and molecular function (MF). Gene ontology terms with p ≤ 0.05 were selected using set counts and sizes (g:SCS) for reducing significance scores. For the term biologic process, gene ontology terms containing the candidate genes were reconstructed into a directed tree diagram that illustrates the ontological level and degree of significance. A complete list of all significant gene ontology terms for biological process and associated p values is available in Table S6. A description of the gene ontology terms is available at http://www.geneontology.org.
Statistical Analysis
Cellular and synaptic statistical analyses were performed using an unpaired two-tailed Student’s t test. ERG and vascular quantification data were analyzed using a two-way ANOVA using the animal as the unit of analysis and allowing for unequal variance. No statistical analysis was conducted to pre-determine sample sizes. Randomization and blinding were not employed in data collection and analysis. Statistical differences were evaluated using GraphPad Prism 7 software. p < 0.05 was considered statistically significant.
Supplementary Material
Highlights.
Developed pipeline for identifying neural and synaptic integrity genes in the retina
Identified 16 genes that regulate diverse aspects of retinal organization
Candidates play distinct roles in neural, synaptic, and vascular patterning
Data expand the genetic landscape involved in retinal circuit function
ACKNOWLEDGMENTS
We thank M. Konning, M. van der Heijden, K. Eagle, L. Lin, K. May, T. Watkins, R. Samaco, and members of our laboratory for scientific discussions and advice. This work was supported by the NIH (R00AG044444 and DP2EY02798 to M.A.S.) the Cancer Prevention Research Institute of Texas, and the Brain Research Foundation. N.E.A. was supported by the NIH and the National Institute of General Medical Sciences under award T32GM088129. J.W. is supported by The Robert and Janice McNair Foundation McNair MD/PhD Student Scholar Program. This project was also sup-ported by the RNA In Situ Hybridization Core facility at BMC with the expert assistance of Cecilia Ljungberg, Ph.D., and funding from the NIH (1S10 OD016167, IDDRC grant 1U54 HD083092, and the Eunice Kennedy Shriver National Institute of Child Health and Human Development). The availability of the KOMP lines was supported by KOMP2 awards UM1HG006348, U42OD11174, and U54HG006348.
Footnotes
DECLARATION OF INTERESTS
The authors declare no competing financial interests.
REFERENCES
- Alm A (1992). Ocular circulation In Adler’s Physiology of the Eye, Hart W, ed. St. Louis: Mosby; ), pp. 198–227. [Google Scholar]
- Audo I, Bujakowska KM, Le´veillard T, Mohand-Saı¨d S, Lancelot ME, Germain A, Antonio A, Michiels C, Saraiva JP, Letexier M, et al. (2012). Development and application of a next-generation-sequencing (NGS) approach to detect known and novel gene defects underlying retinal diseases. Orphanet J. Rare Dis 7, 8. [DOI] [PMC free article] [PubMed] [Google Scholar]
- Bellen HJ, Tong C, and Tsuda H (2010). 100 years of Drosophila research and its impact on vertebrate neuroscience: a history lesson for the future. Nat. Rev. Neurosci 11, 514–522. [DOI] [PMC free article] [PubMed] [Google Scholar]
- Blackshaw S, Fraioli RE, Furukawa T, and Cepko CL (2001). Compre-hensive analysis of photoreceptor gene expression and the identification of candidate retinal disease genes. Cell 107, 579–589. [DOI] [PubMed] [Google Scholar]
- Blackshaw S, Harpavat S, Trimarchi J, Cai L, Huang H, Kuo WP, Weber G, Lee K, Fraioli RE, Cho SH, et al. (2004). Genomic analysis of mouse retinal development. PLoS Biol 2, E247. [DOI] [PMC free article] [PubMed] [Google Scholar]
- Ding S, Wu X, Li G, Han M, Zhuang Y, and Xu T (2005). Efficient trans-position of the piggyBac (PB) transposon in mammalian cells and mice. Cell 122, 473–483. [DOI] [PubMed] [Google Scholar]
- Dowling J (2012). The Retina: An approachable part of the brain (Cambridge: Harvard University Press; ). [Google Scholar]
- Dwyer ND, Manning DK, Moran JL, Mudbhary R, Fleming MS, Favero CB, Vock VM, O’Leary DD, Walsh CA, and Beier DR (2011). A forward genetic screen with a thalamocortical axon reporter mouse yields novel neurodevelopment mutants and a distinct emx2 mutant phenotype. Neural Dev 6, 3. [DOI] [PMC free article] [PubMed] [Google Scholar]
- Echelard Y, Vassileva G, and McMahon AP (1994). Cis-acting regulatory sequences governing Wnt-1 expression in the developing mouse CNS. Development 120, 2213–2224. [DOI] [PubMed] [Google Scholar]
- Goldowitz D, Frankel WN, Takahashi JS, Holtz-Vitaterna M, Bult C, Kibbe WA, Snoddy J, Li Y, Pretel S, Yates J, and Swanson DJ (2004). Large-scale mutagenesis of the mouse to understand the genetic ba-ses of nervous system structure and function. Brain Res. Mol. Brain Res 132, 105–115. [DOI] [PMC free article] [PubMed] [Google Scholar]
- Henneberry AL, Wistow G, and McMaster CR (2000). Cloning, genomic organization, and characterization of a human cholinephosphotransferase. J. Biol. Chem 275, 29808–29815. [DOI] [PubMed] [Google Scholar]
- Hoon M, Okawa H, Della Santina L, and Wong RO (2014). Functional ar-chitecture of the retina: development and disease. Prog. Retin. Eye Res 42, 44–84. [DOI] [PMC free article] [PubMed] [Google Scholar]
- Iwao B, Yara M, Hara N, Kawai Y, Yamanaka T, Nishihara H, Inoue T, and Inazu M (2016). Functional expression of choline transporter like-protein 1 (CTL1) and CTL2 in human brain microvascular endothelial cells. Neuro-chem. Int 93, 40–50. [DOI] [PubMed] [Google Scholar]
- Jiang X, Jones S, Andrew BY, Ganti A, Malysheva OV, Giallourou N, Brannon PM, Roberson MS, and Caudill MA (2014). Choline inadequacy impairs trophoblast function and vascularization in cultured human placental trophoblasts. J. Cell. Physiol 229, 1016–1027. [DOI] [PubMed] [Google Scholar]
- Koscielny G, Yaikhom G, Iyer V, Meehan TF, Morgan H, Atienza-Herrero J, Blake A, Chen CK, Easty R, Di Fenza A, et al. (2014). The International Mouse Phenotyping Consortium Web Portal, a unified point of access for knockout mice and related phenotyping data. Nucleic Acids Res 42, D802– D809. [DOI] [PMC free article] [PubMed] [Google Scholar]
- Lahdenranta J, Pasqualini R, Schlingemann RO, Hagedorn M, Stallcup WB, Bucana CD, Sidman RL, and Arap W (2001). An anti-angiogenic state in mice and humans with retinal photoreceptor cell degeneration. Proc. Natl. Acad. Sci. USA 98, 10368–10373. [DOI] [PMC free article] [PubMed] [Google Scholar]
- Laughlin SB, de Ruyter van Steveninck RR, and Anderson JC (1998). The metabolic cost of neural information. Nat. Neurosci 1, 36–41. [DOI] [PubMed] [Google Scholar]
- Macosko EZ, Basu A, Satija R, Nemesh J, Shekhar K, Goldman M, Tirosh I, Bialas AR, Kamitaki N, Martersteck EM, et al. (2015). Highly Parallel Genome-wide Expression Profiling of Individual Cells Using Nanoliter Droplets. Cell 161, 1202–1214. [DOI] [PMC free article] [PubMed] [Google Scholar]
- Moran EP, Wang Z, Chen J, Sapieha P, Smith LE, and Ma JX (2016). Neurovascular cross talk in diabetic retinopathy: Pathophysiological roles and therapeutic implications. Am. J. Physiol. Heart Circ. Physiol 311, H738–H749. [DOI] [PMC free article] [PubMed] [Google Scholar]
- Moreno-De-Luca A, Helmers SL, Mao H, Burns TG, Melton AM, Schmidt KR, Fernhoff PM, Ledbetter DH, and Martin CL (2011). Adaptor protein complex-4 (AP-4) deficiency causes a novel autosomal recessive cerebral palsy syndrome with microcephaly and intellectual disability. J. Med. Genet 48, 141–144. [DOI] [PMC free article] [PubMed] [Google Scholar]
- Mu G, Liu H, Zhou F, Xu X, Jiang H, Wang Y, and Qu Y (2010). Correlation of overexpression of HMGA1 and HMGA2 with poor tumor differentiation, invasion, and proliferation associated with let-7 down-regulation in retinoblastomas. Hum. Pathol 41, 493–502. [DOI] [PubMed] [Google Scholar]
- Nishiguchi KM, Tearle RG, Liu YP, Oh EC, Miyake N, Benaglio P, Harper S, Koskiniemi-Kuendig H, Venturini G, Sharon D, et al. (2013). Whole genome sequencing in patients with retinitis pigmentosa reveals pathogenic DNA structural changes and NEK2 as a new disease gene. Proc. Natl. Acad. Sci. USA 110, 16139–16144. [DOI] [PMC free article] [PubMed] [Google Scholar]
- Parameswaran S, Xia X, Hegde G, and Ahmad I (2014). Hmga2 regulates self-renewal of retinal progenitors. Development 141, 4087–4097. [DOI] [PMC free article] [PubMed] [Google Scholar]
- Peng YR, Tran NM, Krishnaswamy A, Kostadinov D, Martersteck EM, and Sanes JR (2017). Satb1 Regulates Contactin 5 to Pattern Dendrites of a Mammalian Retinal Ganglion Cell. Neuron 95, 869–883.e6. [DOI] [PMC free article] [PubMed] [Google Scholar]
- Pinto LH, Vitaterna MH, Siepka SM, Shimomura K, Lumayag S, Baker M, Fenner D, Mullins RF, Sheffield VC, Stone EM, et al. (2004). Results from screening over 9000 mutation-bearing mice for defects in the electroret-inogram and appearance of the fundus. Vision Res 44, 3335–3345. [DOI] [PMC free article] [PubMed] [Google Scholar]
- Ratner S (1972). Agininosuccinases and Adenylosuccinases. In The Enzymes, Boyer PD, ed. (New York: Academic Press; ), pp. 167–197. [Google Scholar]
- Raza MH, Mattera R, Morell R, Sainz E, Rahn R, Gutierrez J, Paris E, Root J, Solomon B, Brewer C, et al. (2015). Association between Rare Var-iants in AP4E1, a Component of Intracellular Trafficking, and Persistent Stuttering. Am. J. Hum. Genet 97, 715–725. [DOI] [PMC free article] [PubMed] [Google Scholar]
- Rigault C, Le Borgne F, and Demarquoy J (2006). Genomic structure, alternative maturation and tissue expression of the human BBOX1 gene. Biochim. Biophys. Acta 1761, 1469–1481. [DOI] [PubMed] [Google Scholar]
- Samuel MA, Voinescu PE, Lilley BN, de Cabo R, Foretz M, Viollet B, Pawlyk B, Sandberg MA, Vavvas DG, and Sanes JR (2014). LKB1 and AMPK regulate synaptic remodeling in old age. Nat. Neurosci 17, 1190–1197. [DOI] [PMC free article] [PubMed] [Google Scholar]
- Sanuki R, Watanabe S, Sugita Y, Irie S, Kozuka T, Shimada M, Ueno S, Usukura J, and Furukawa T (2015). Protein-4.1G-Mediated Membrane Trafficking Is Essential for Correct Rod Synaptic Location in the Retina and for Normal Visual Function. Cell Rep Published online February 4, 2015. 10.1016/j.celrep.2015.01.005. [DOI] [PubMed] [Google Scholar]
- Sapieha P (2012). Eyeing central neurons in vascular growth and reparative angiogenesis. Blood 120, 2182–2194. [DOI] [PubMed] [Google Scholar]
- Sarin S, Zuniga-Sanchez E, Kurmangaliyev YZ, Cousins H, Patel M, Hernandez J, Zhang KX, Samuel MA, Morey M, Sanes JR, and Zipursky SL (2018). Role for Wnt Signaling in Retinal Neuropil Development: Analysis via RNA-Seq and In Vivo Somatic CRISPR Mutagenesis. Neuron 98, 109–126.e8. [DOI] [PMC free article] [PubMed] [Google Scholar]
- Schwickart M, Havlis J, Habermann B, Bogdanova A, Camasses A, Oelschlaegel T, Shevchenko A, and Zachariae W (2004). Swm1/Apc13 is an evolutionarily conserved subunit of the anaphase-promoting complex stabilizing the association of Cdc16 and Cdc27. Mol. Cell. Biol 24, 3562–3576. [DOI] [PMC free article] [PubMed] [Google Scholar]
- Shah AN, Davey CF, Whitebirch AC, Miller AC, and Moens CB (2015). Rapid reverse genetic screening using CRISPR in zebrafish. Nat. Methods 12, 535–540. [DOI] [PMC free article] [PubMed] [Google Scholar]
- Shanks ME, Downes SM, Copley RR, Lise S, Broxholme J, Hudspith KA, Kwasniewska A, Davies WI, Hankins MW, Packham ER, et al. (2013). Next-generation sequencing (NGS) as a diagnostic tool for retinal degeneration reveals a much higher detection rate in early-onset disease. Eur. J. Hum. Genet 21, 274–280. [DOI] [PMC free article] [PubMed] [Google Scholar]
- Stottmann RW, and Beier DR (2010). Using ENU mutagenesis for pheno-type-driven analysis of the mouse. Methods Enzymol 477, 329–348. [DOI] [PubMed] [Google Scholar]
- Sumter TF, Xian L, Huso T, Koo M, Chang YT, Almasri TN, Chia L, Inglis C, Reid D, and Resar LM (2016). The High Mobility Group A1 (HMGA1) Transcriptome in Cancer and Development. Curr. Mol. Med 16, 353–393. [DOI] [PMC free article] [PubMed] [Google Scholar]
- Sun LO, Jiang Z, Rivlin-Etzion M, Hand R, Brady CM, Matsuoka RL, Yau KW, Feller MB, and Kolodkin AL (2013). On and off retinal circuit assembly by divergent molecular mechanisms. Science 342, 1241974. [DOI] [PMC free article] [PubMed] [Google Scholar]
- Takasugi N, Tomita T, Hayashi I, Tsuruoka M, Niimura M, Takahashi Y, Thinakaran G, and Iwatsubo T (2003). The role of presenilin cofactors in the gamma-secretase complex. Nature 422, 438–441. [DOI] [PubMed] [Google Scholar]
- Traiffort E, O’Regan S, and Ruat M (2013). The choline transporter-like family SLC44: properties and roles in human diseases. Mol. Aspects Med 34, 646–654. [DOI] [PubMed] [Google Scholar]
- Usui Y, Westenskow PD, Murinello S, Dorrell MI, Scheppke L, Bucher F, Sakimoto S, Paris LP, Aguilar E, and Friedlander M (2015a). Angio-genesis and Eye Disease. Annu. Rev. Vis. Sci 1, 155–184. [DOI] [PubMed] [Google Scholar]
- Usui Y, Westenskow PD, Kurihara T, Aguilar E, Sakimoto S, Paris LP, Wittgrove C, Feitelberg D, Friedlander MS, Moreno SK, et al. (2015b). Neurovascular crosstalk between interneurons and capillaries is required for vision. J. Clin. Invest 125, 2335–2346. [DOI] [PMC free article] [PubMed] [Google Scholar]
- Van Essen DC, Anderson CH, and Felleman DJ (1992). Information processing in the primate visual system: an integrated systems perspective. Science 255, 419–423. [DOI] [PubMed] [Google Scholar]
- Wang Y, Liu X, Biederer T, and Sudhof €TC (2002). A family of RIM-binding proteins regulated by alternative splicing: Implications for the genesis of syn-aptic active zones. Proc. Natl. Acad. Sci. USA 99, 14464–14469. [DOI] [PMC free article] [PubMed] [Google Scholar]
- Wang F, Wang H, Tuan HF, Nguyen DH, Sun V, Keser V, Bowne SJ, Sullivan LS, Luo H, Zhao L, et al. (2014). Next generation sequencing-based molecular diagnosis of retinitis pigmentosa: identification of a novel ge-notype-phenotype correlation and clinical refinements. Hum. Genet 133, 331–345. [DOI] [PMC free article] [PubMed] [Google Scholar]
- Wang Y, Fehlhaber KE, Sarria I, Cao Y, Ingram NT, Guerrero-Given D, Throesch B, Baldwin K, Kamasawa N, Ohtsuka T, et al. (2017a). The Auxiliary Calcium Channel Subunit a2d4 Is Required for Axonal Elaboration, Synaptic Transmission, and Wiring of Rod Photoreceptors. Neuron 93, 1359–1374.e6. [DOI] [PMC free article] [PubMed] [Google Scholar]
- Wang J, Al-Ouran R, Hu Y, Kim SY, Wan YW, Wangler MF, Yama-moto S, Chao HT, Comjean A, Mohr SE, et al. ; UDN (2017b). MARRVEL: Integration of Human and Model Organism Genetic Resources to Facilitate Functional Annotation of the Human Genome. Am. J. Hum. Genet 100, 843–853. [DOI] [PMC free article] [PubMed] [Google Scholar]
- Weinert TA, and Hartwell LH (1988). The RAD9 gene controls the cell cycle response to DNA damage in Saccharomyces cerevisiae. Science 241, 317–322. [DOI] [PubMed] [Google Scholar]
- Yamamoto S, Jaiswal M, Charng WL, Gambin T, Karaca E, Mirzaa G, Wiszniewski W, Sandoval H, Haelterman NA, Xiong B, et al. (2014). A Drosophila genetic resource of mutants to study mechanisms underlying hu-man genetic diseases. Cell 159, 200–214. [DOI] [PMC free article] [PubMed] [Google Scholar]
- Yaylaoglu MB, Titmus A, Visel A, Alvarez-Bolado G, Thaller C, and Ei-chele G (2005). Comprehensive expression atlas of fibroblast growth factors and their receptors generated by a novel robotic in situ hybridization platform. Dev. Dyn 234, 371–386. [DOI] [PubMed] [Google Scholar]
- Zelinger L, Banin E, Obolensky A, Mizrahi-Meissonnier L, Beryozkin A, Bandah-Rozenfeld D, Frenkel S, Ben-Yosef T, Merin S, Schwartz SB, et al. (2011). A missense mutation in DHDDS, encoding dehydrodolichyl diphosphate synthase, is associated with autosomal-recessive retinitis pig-mentosa in Ashkenazi Jews. Am. J. Hum. Genet 88, 207–215. [DOI] [PMC free article] [PubMed] [Google Scholar]
- Zeng XX, Zheng X, Xiang Y, Cho HP, Jessen JR, Zhong TP, Solnica-Krezel L, and Brown HA (2009). Phospholipase D1 is required for angiogen-esis of intersegmental blood vessels in zebrafish. Dev. Biol 328, 363–376. [DOI] [PMC free article] [PubMed] [Google Scholar]
Associated Data
This section collects any data citations, data availability statements, or supplementary materials included in this article.