Abstract.
Treatment outcomes for brain cancer have seen dismal improvements over the last two decades as evident in available statistical data. Efforts to address this challenge include development of near-infrared contrast agents for improvements in diagnostic and therapeutic modalities. This creates a need for imaging technologies that can support the intraoperative use of such agents. Here, we report implementation of a recently introduced augmented microscope in combination with indocyanine green (ICG), a near-infrared contrast agent, for surgical image guidance of a glioma resection in a rat model. Luc-C6 cells were implanted in rats in the left-frontal lobe and grown for 22 days. Surgical resection was performed by a neurosurgeon using the augmented microscope with ICG contrast. ICG accumulated in the tumor tissue due to enhanced permeation and retention from the compromised blood–brain barrier. Videos and images were acquired to evaluate image quality and resection margins. The augmented microscope highlighted tumor tissue regions via visualization of ICG fluorescence and was capable of guiding the rat glioma resection.
Keywords: augmented microscopy, fluorescence, indocyanine green, glioma, vascular, brain surgery
1. Introduction
There were an estimated 22,850 brain tumor cases in the US in 2015 as reported by the NIH SEER.1 Although not a large number compared with total cancers, the American Brain Tumor Association indicates that the prognosis worsens significantly for advanced stages such as an anaplastic astrocytoma, where median survival is 2 to 3 years and more aggressive glioblastoma multiforme (GBM) with median survival of months.2 Data provided by NIH SEER also show a stagnant incidence and mortality of brain cancer, suggesting no major advancements for treatment or management have been made. Surgery is typically the primary treatment for patients with brain cancer, followed by adjunct chemotherapy and radiotherapy. However, GBM is known for its invasive growth, quickly infiltrating normal tissue of the brain. Therefore, it is often difficult to visualize tumor margins and achieve complete resection without the risk of damage to normal tissue. How the surgeon resolves this challenge is particularly critical as resection margins are shown to be directly related to prognosis.3 Development of invasive GBM is accompanied by the growth of an abnormal vascular network that feeds the tumor, and vascular angiography has become a valuable tool for improved visualization of tumor margins and surgical resection.4,5 Imaging modalities that improve tumor visualization will subsequently lead to more accurate resection and better prognosis for the patient.
Among techniques for intraoperative imaging, fluorescence imaging has seen considerable advances over the past decade including preclinical research and clinical applications of near-infrared (NIR) fluorescence imaging.6–14 NIR wavelengths are favorable by enabling work within the tissue transparency window of the electromagnetic spectrum. Fluorescent indocyanine green (ICG) is currently the only NIR dye used in neurosurgery procedures. Subsequently, there has been increased use of ICG to evaluate blood flow and vascular anomalies in cerebrovascular surgeries.15 Although ICG is not a tumor-selective probe, the blood–brain barrier (BBB) compromised by invasive cancer cells allows for enhanced permeation and retention (EPR) of the dye within the tumor. Indeed, ICG has been shown to accumulate in an astrocytoma grown in mice as imaged using a confocal endomicroscope.16 Working with invisible NIR fluorescence adds the challenge of properly identifying tumor margins and vascular networks in the surgical field. To address this challenge we introduced augmented microscopy, a multimodality imaging system, driving a technological paradigm shift in image-guided surgery.17 Here, we present augmented microscopy in combination with ICG contrast to enhance visualization and resection of a glioma in a small animal model.18
2. Methods
Rat glioma C6 cell line was purchased from ATCC. The cells were treated with a lentiviral vector [Cignal Lenti Positive Control (luc), Qiagen, Valencia, California] to transduce the cells with luciferase gene using a puromycin selector (Santa Cruz Biotechnology, Dallas, Texas) and a transducing reagent to enhance transduction efficiency. Luminescence was confirmed using a plate reader.
Adult female Wistar rats (200 g, ) were used in the study and all animal procedures were approved by the University of Arizona Institutional Animal Care and Use Committee. Rats were anesthetized by intraperitoneal injection of a ketamine/xylazine cocktail (80 and 12 mg/kg) using a dose of 1 mL/kg. Presurgical injections of saline and gentamycin (8 mg/kg) were given for hydration and antibiotics, respectively. The rats were placed into a stereotactic frame for cell implantation. Coordinates for cell implantation were 1 mm A/P, 3.5 mm M/L, and 3.5 mm V/D measured from bregma. The 105 luc-C6 cells suspended in volume at a rate of with a Hamilton syringe and a 28 gage cannula (Plastics One, Roanoke, Virginia). The cannula was slowly advanced ventrally 4 mm and then retracted 0.5 mm to create a pocket for cell infusion. Following cell infusion, 1 min elapsed before the cannula was retracted out of the injection site. The access hole was closed with bone wax and the scalp closed using wound clips. The tumor was grown in the rat for 22 days.
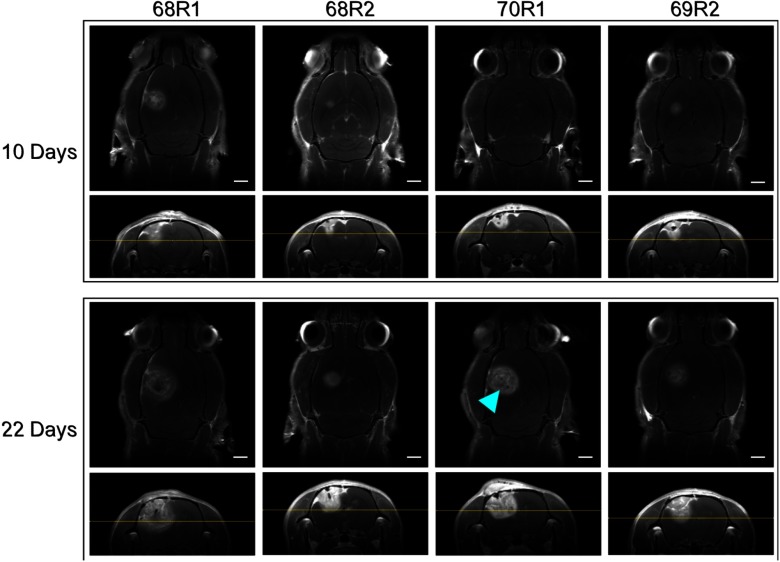
Tumor growth was monitored with magnetic resonance imaging (MRI) using a 7T Bruker BioSpec (Bruker, Billerica, Massachusetts). Animals were anesthetized with 1% to 3% isoflurane and T1-weighted imaging was carried out with a IP injection of 0.5 M gadolinium contrast (Multihance, Bracco Diagnostics, Cranbury Township, New Jersey) to enhance visualization of the tumor. T1-weighted MRI with gadolinium contrast confirmed tumor growth in the animals on days 10 and 22 (Fig. 1), respectively. Axial and coronal sections were acquired for analysis of tumor size and spatial extent. Tumor volume was calculated by measuring diameter in both axial and coronal sections and assuming spherical volumes. The average tumor volume across all animals on day 22, within 24 h of resection, was . These images were used for surgical planning, consistent with current clinical practice to confirm tumor growth.
Fig. 1.
T1 weighted MRI with gadolinium contrast. Images oriented with animal number from left to right, and midpoint (10 days) versus final preoperative (22 days) images top and bottom, respectively. Preoperative images were captured within 24 h of surgery. Axial sections are at 4-mm depth measured from top of skull and marked on coronal sections (horizontal yellow line). Blue arrowhead: possible necrotic core. Scale bars = 2 mm.
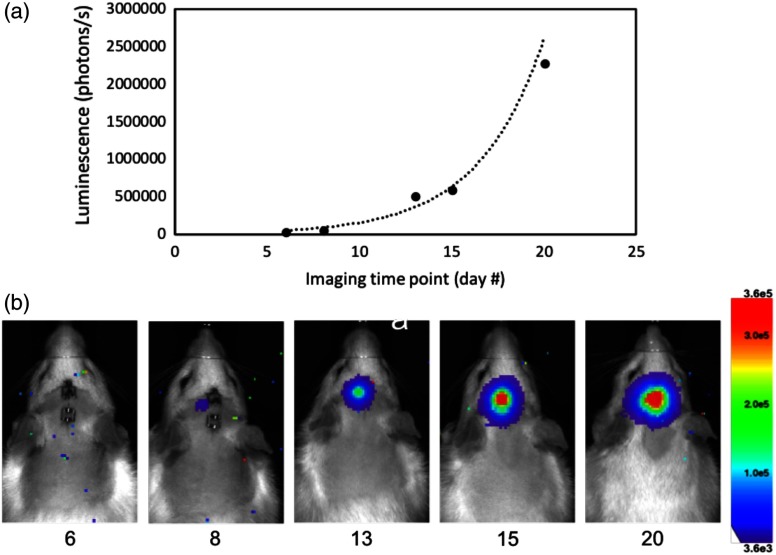
Tumor growth was also monitored using bioluminescence imaging (BLI) on a Lago X system (Spectral Instruments Imaging, Tucson, Arizona). This imaging technique requires the animal to be placed into a sealed dark box with a highly sensitive and cooled camera attached. The camera sensor is then exposed for extended periods of time to capture luminescence from the modified tumor cells in the animal. The acquired image is an integrated intensity map representing the amount of luminescence from the tumor cells. All BLI was performed with an eight-bit dynamic range and a 10-min exposure time. Rats were anesthetized with isoflurane and injected with 0.4 mL of luciferin prepared at 50 mg/mL (GoldBio, Olivette, Missouri). Doses of luciferin were prepared according to the protocol supplied by GoldBio. Percent of tumor growth was calculated by drawing a region of interest around the luminescence boundary in BLI images and integrating the intensity values. Figure 2 shows a representative time lapse of tumor growth over five imaging time points. The data showed an expected exponential growth pattern consistent with literature.19
Fig. 2.
BLI imaging of luc-C6 glioma growth in a rat over 20 days (68R2). (a) Representative growth curve and (b) BLI representative of all animals studied.
Tumor resection was performed by a neurosurgeon at the University of Arizona under standard microscopy () and augmented microscopy with ICG (). ICG dose was calculated according to standard clinical dose (Akorn Pharmaceuticals, Lake Forest, Illinois) and scaled by body weight. The rats used for resection with augmented microscopy were injected with 1 mL of solution of ICG (Sigma-Aldrich, St. Louis, Missouri) to yield a dose of 25 mg/80 kg. ICG was injected 15 min prior to resection with augmented microscopy.
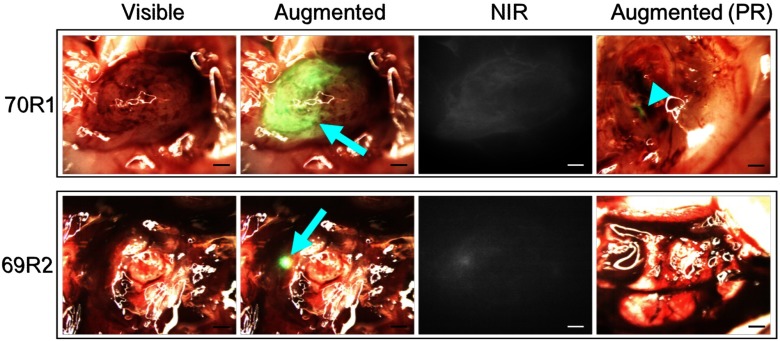
Tumor resection was performed under both standard bright-field microscopy, similar to current practice in the clinic, and under augmented microscopy with ICG contrast. Video of all resection procedures was recorded, and representative snapshots of the videos are shown in Fig. 3.
Fig. 3.
Intraoperative images from augmented microscope during glioma resection. Blue arrows indicate ICG signal. Blue arrowhead demarcates remaining ICG signal postresection. Scale bars = 1 mm.
3. Results and Discussion
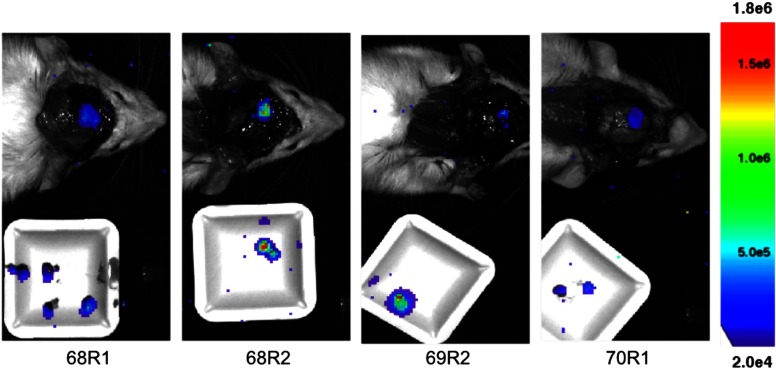
Accumulation of ICG in the tumor tissue can be seen in the tumors. Demarcated as a blue arrowhead in Fig. 3, the green signal from ICG, some tumor tissue may have been left unresected. As shown in Fig. 4, it is apparent that tumor cells remain in the resection bed after surgery, consistent across all animals. The neurosurgeon collected a majority of the resected tissue on a sample dish that was imaged with BLI in addition to the exposed resection bed in the animal. Note that the threshold scale between Figs. 2 and 4 was adjusted to account for luminescence intensity differences following craniotomy, optimize luminescence boundary, and minimize noise.
Fig. 4.
Postresection BLI. White sample dish contains resected tissue. Thresholded for optimized image presentation and reduced noise.
Following the surgical procedure, the rats and excised tissue were again imaged by BLI. The surgical procedures did not exceed 20 min and therefore no additional anesthetics were administered, and luciferin injections were not given postsurgery with the assumption that continued luminescence from the remaining and resected tumor tissue would still be present. After postsurgical BLI, the brain was explanted and placed in paraformaldehyde. Resected tumor tissue was placed in the cryoprotective solution and flash frozen in liquid nitrogen. All samples were prepared for histology.
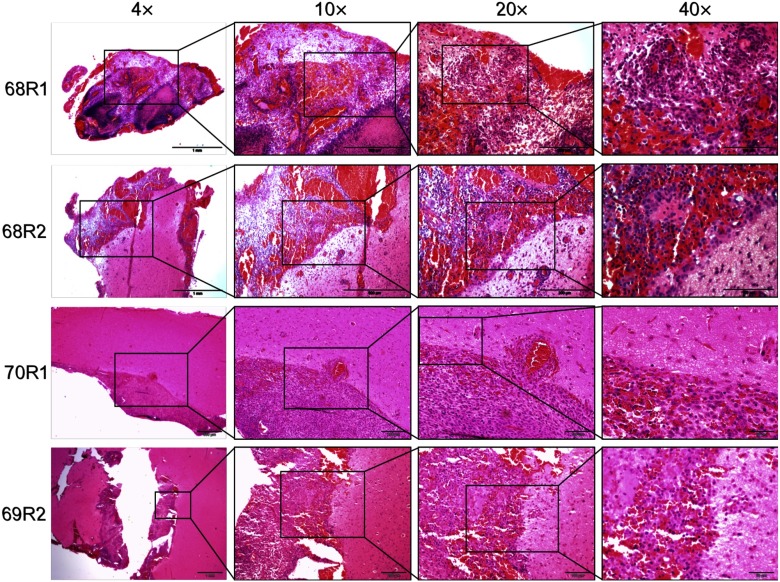
Standard hematoxylin and eosin (H&E) staining was performed on sections taken from the resection bed of the rat brains. Figure 5 shows representative sections of the brain tissues from the animals that did not receive ICG (68R1 and 68R2) and did receive ICG (70R1 and 69R2). The magnification images show the resection bed and the subsequent magnifications show the clear and distinct margins of cancerous versus normal tissue. Histology appears consistent with BLI and augmented microscopy showing tumor cells left in the resection bed.
Fig. 5.
H&E stain on representative slices of brain tissue collected. 68R1 and 68R2: resection with no ICG contrast. 70R1 and 69R2: resection with ICG contrast.
4. Conclusion
Current clinical practice requires the surgeon to visualize the visible and NIR images independently, whereas the augmented microscope presents these images superimposed and in real time for more accurate registration between the two modalities. The augmented microscope produced these images with excellent contrast in the bright-field image and was able to minimize NIR noise in the augmented image with simple thresholding. This minimizes processing time thereby reducing any lag in the real-time image processing and display. The extent of resection was at the discretion of the neurosurgeon and the augmented microscope was only used for improved image guidance and not in an effort to change the neurosurgeon’s resection decision(s). ICG was administered intravenously, and the dye was quickly cleared from the circulation with a typical half-life of 3 min. As visualized under the augmented microscope, the dye showed apparent diffusion and retention into tumor tissue, likely due to a compromised BBB caused by the invasive glioma. Postresection BLI showed remanence of tumor cells even after using the augmented microscope for image guidance. We suggest that this is due to the nonspecific nature of ICG distribution in the tumor and that the fluorescent molecule does not penetrate through the entire tumor margin. Therefore, it is probable that tumor cells extend beyond the boundary delineated by ICG signal.
There appears to be differences in tumor size when comparing MRI and ICG fluorescence images (Figs. 1 and 3). This discrepancy originates likely in the fundamental differences in how each of these modalities capture the image and how the images are displayed. Each MRI image acquired with gadolinium contrast is a two-dimensional cross-section of the three-dimensional datasets. In contrast, the ICG fluorescence images represent the cumulative signal contributed by the entire volume of the tumor, so they are impacted by the depth of the tumor and light scattering events. Therefore, these two imaging modalities yield different tumor size assessments.
It is important to note that scattering of ICG fluorescence may contribute to a misrepresentation of tumor boundaries, likely overestimating its size. However, slowly resecting from the core of the tumor and outward will eliminate the bulk of fluorescence thereby reducing the amount of scattering. Nearer to the edges and after the bulk of the tumor has been removed, less scattering will occur reducing the chances for misrepresenting location of the ICG signal. The nonspecific nature of the dye could also highlight regions of healthy tissue. However, clearance of the dye in healthy tissue would occur at a faster rate than areas of tumor tissue where the lymphatic system is typically compromised. Therefore, procedural changes, like time between contrast injection and resection, could be made to help ameliorate the chances of misdiagnosing tumor tissue with ICG fluorescence. This is an argument for transitioning toward more specific and targeted dyes that will selectively highlight only cancerous tissue.
It is evident in Fig. 3 that the green luminescence appears to have a gradient of intensity (in the horizontal direction of the image) over the tumor tissue. This is likely from uneven diffusion of ICG into the tumor tissue. The cancerous mass may have anisotropic distribution of blood supply or may be showing initial development of a necrotic core. In one example, the necrotic core may be visualized as a dark spot within the gadolinium contrast-enhanced area of the tumor on MRI (Fig. 1, blue arrowhead).
Notably, we demonstrated that the tumor growth in the rat can be monitored noninvasively using BLI through the intact skull and scalp. In comparison, postresection BLI (Fig. 4) was performed in situ with neither the skull nor scalp present. The luc-C6 cells were implanted superficially (within the cortex) as a way to maximize BLI signal through the intact skull and scalp in a rat. Although there were clearly positive tumor margins postresection, the glioma appeared to grow less invasively than expected. Human gliomas present with highly invasive growth and typically indistinguishable boundaries. Future studies may use a different model (e.g., xenograft) to encourage more diffuse integration with normal tissue and better replicate the common observation in human glioma.
The development of augmented microscopy has proven to provide a unique imaging environment for oncologic surgical procedures. This advantage is apparent when trying to determine specific margins using two separate imaging modalities, for example, bright field and NIR. With augmented microscopy, the surgeon is provided a real-time overlay of the false-colored NIR fluorescence images with the real optical view within the microscope. Therefore, direct viewing of fluorescence and tumor margins is possible without the need for mental co-registration of images or switching imaging devices. With the continued development of NIR contrast agents, the augmented microscope aims to visualize such fluorophores and to guide surgical procedures or therapies. Recent examples of fluorophores appropriate for guiding surgical interventions include protoporphyrin IX produced by administration of 5-aminolevulinic acid, fluorescent tracers such as IRDye 800CW, or fluorescent analogs of 2-deoxyglucose, a metabolic marker.12–14 Future work will aim to involve contrast agents that can function as a theranostic tool, with the ability to provide both therapeutic and diagnostic capabilities. Contrast agents that can be molecularly targeted or enzymatically activated will aim to be more specific to cancer tissue. Additionally, these contrast agents could enable specific and localized activation for heating or another deleterious outcome to surrounding cancer cells thereby inducing or causing apoptosis or necrosis, respectively. Agents that are designed for the NIR spectrum will be specifically applicable using the augmented microscope demonstrated here.
Acknowledgments
We would like to acknowledge support from T32 NIH Cardiovascular Training Grant (HL007955-17), ARCS Crawford Endowment award, the Experimental Mouse Shared Resource facility at the University of Arizona for their assistance in pre-clinical experiments, and Brenda Baggett for her assistance in luc-C6 transduction procedures.
Disclosures
The authors confirm that they have no relevant financial interests with this work.
References
- 1.Howlader N., et al. , “SEER cancer statistics review, 1975–2013,” National Cancer Institute, Bethesda, Maryland: (2016). [Google Scholar]
- 2.American Brain Tumor Association, “Brain tumor statistics” (2017), http://www.abta.org/about-us/news/brain-tumor-statistics.
- 3.Li Y. M., et al. , “The influence of maximum safe resection of glioblastoma on survival in 1229 patients: can we do better than gross-total resection?” J. Neurosurg. 124(4), 977–988 (2016). 10.3171/2015.5.JNS142087 [DOI] [PubMed] [Google Scholar]
- 4.Haglund M. M., Berger M. S., Hochman D. W., “Enhanced optical imaging of human gliomas and tumor margins,” Neurosurgery 38(2), 308–317 (1996). 10.1097/00006123-199602000-00015 [DOI] [PubMed] [Google Scholar]
- 5.Haglund M. M., et al. , “Enhanced optical imaging of rat gliomas and tumor margins,” Neurosurgery 35(5), 930–941 (1994). 10.1227/00006123-199411000-00019 [DOI] [PubMed] [Google Scholar]
- 6.Marshall M. V., et al. , “Near-infrared fluorescence imaging in humans with indocyanine green: a review and update,” Open Surg. Oncol. J. 2(2), 12–25 (2010). 10.2174/1876504101002020012 [DOI] [PMC free article] [PubMed] [Google Scholar]
- 7.Troyan S. L., et al. , “The FLARETM intraoperative near-infrared fluorescence imaging system: a first-in-human clinical trial in breast cancer sentinel lymph node mapping,” Ann. Surg. Oncol. 16(10), 2943–2952 (2009). 10.1245/s10434-009-0594-2 [DOI] [PMC free article] [PubMed] [Google Scholar]
- 8.Frangioni J. V., “In vivo near-infrared fluorescence imaging,” Curr. Opin. Chem. Biol. 7(5), 626–634 (2003). 10.1016/j.cbpa.2003.08.007 [DOI] [PubMed] [Google Scholar]
- 9.Elliott J. T., et al. , “Review of fluorescence guided surgery visualization and overlay techniques,” Biomed. Opt. Express 6(10), 3765–3782 (2015). 10.1364/BOE.6.003765 [DOI] [PMC free article] [PubMed] [Google Scholar]
- 10.Martirosyan N. L., et al. , “Integration of indocyanine green videoangiography with operative microscope,” Neurosurgery 11, 252–258 (2015). 10.1227/NEU.0000000000000681 [DOI] [PMC free article] [PubMed] [Google Scholar]
- 11.Kaneko S., Kaneko S., “Fluorescence-guided resection of malignant glioma with 5-ALA,” Int. J. Biomed. Imaging 2016, 1–11 (2016). 10.1155/2016/6135293 [DOI] [PMC free article] [PubMed] [Google Scholar]
- 12.Valdés P. A., et al. , “Quantitative, spectrally-resolved intraoperative fluorescence imaging,” Sci. Rep. 2(1), 798 (2012). 10.1038/srep00798 [DOI] [PMC free article] [PubMed] [Google Scholar]
- 13.Tichauer K. M., et al. , “Computed tomography-guided time-domain diffuse fluorescence tomography in small animals for localization of cancer biomarkers,” J. Vis. Exp. (65), e4050 (2012). 10.3791/4050 [DOI] [PMC free article] [PubMed] [Google Scholar]
- 14.Tsytsarev V., et al. , “In vivo imaging of epileptic activity using 2-NBDG, a fluorescent deoxyglucose analog,” J. Neurosci. Methods 203(1), 136–140 (2012). 10.1016/j.jneumeth.2011.09.005 [DOI] [PMC free article] [PubMed] [Google Scholar]
- 15.Killory B. D., et al. , “Prospective evaluation of surgical microscope-integrated intraoperative near-infrared indocyanine green angiography during cerebral arteriovenous malformation surgery,” Neurosurgery 65(3), 456–462 (2009). 10.1227/01.NEU.0000346649.48114.3A [DOI] [PubMed] [Google Scholar]
- 16.Martirosyan N. L., et al. , “Use of in vivo near-infrared laser confocal endomicroscopy with indocyanine green to detect the boundary of infiltrative tumor,” J. Neurosurg. 115(6), 1131–1138 (2011). 10.3171/2011.8.JNS11559 [DOI] [PubMed] [Google Scholar]
- 17.Watson J. R., et al. , “Augmented microscopy: real-time overlay of bright-field and near-infrared fluorescence images,” J. Biomed. Opt. 20(10), 106002 (2015). 10.1117/1.JBO.20.10.106002 [DOI] [PMC free article] [PubMed] [Google Scholar]
- 18.Watson J. R., et al. , “Intraoperative imaging using intravascular contrast agent,” Proc. SPIE 9696, 96960L (2016). 10.1117/12.2213867 [DOI] [Google Scholar]
- 19.Bradshaw S. L., D’Ercole A. J., Han V. K. M., “Overexpression of insulin-like growth factor-binding protein-2 in C6 glioma cells results in conditional alteration of cellular growth,” Endocrinology 140(2), 575–584 (1999). 10.1210/endo.140.2.6498 [DOI] [PubMed] [Google Scholar]


