. 2018 Aug 30;7:e36758. doi: 10.7554/eLife.36758

Figure 4. The structure of H206A Oraicryst reveals an open conformation.

(a) Electron density map of H206A Oraicryst. The map (blue mesh, contoured at 1.4 σ, and covering one channel) was calculated from 20 to 6.7 Å using native-sharpened amplitudes and phases that were improved by 24-fold non-crystallographic symmetry (NCS) averaging, solvent flattening and histogram matching (Materials and methods). The atomic model is shown in Cα representation. Figure 4—video 1 shows a video of this Figure. (b) Side view showing two opposing subunits of H206A Oraicryst and the same electron density map. Asterisks mark the location of the H206A substitution. Amino acid side chains on the pore are shown only for reference (sticks). Approximate boundaries of the membrane are shown as horizontal bars. Helices are depicted as ribbons and colored as indicated. (c) Extracellular view showing the hexameric architecture. Helices are depicted as ribbons, with Glu178 side chains (sticks) and Ca2+ ion (green sphere) shown for reference. (d) Overall structure, shown in the same orientation as (a). The M1 helices are drawn as blue ribbons and the other helices are shown as cylinders.

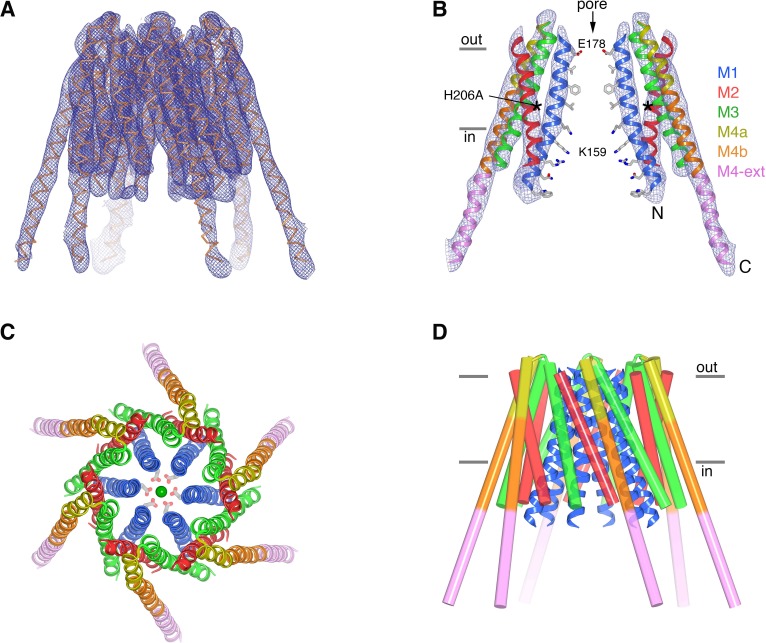
Figure 4.

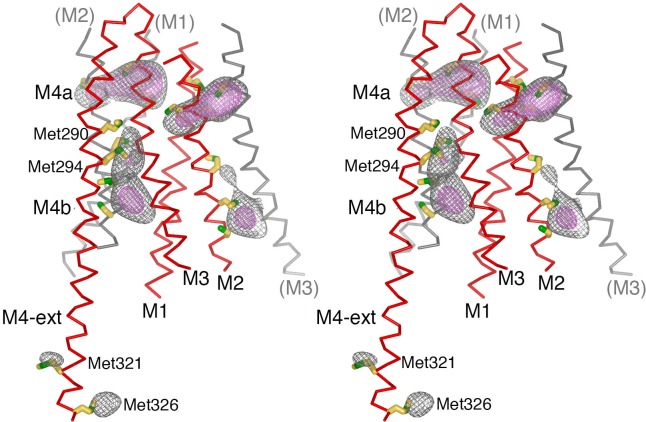
Figure 4—figure supplement 1. Anomalous-difference electron-density at cysteine and methionine residues in the final model of H206A Oraicryst, depicted in stereo.

Figure 4—figure supplement 1.

An anomalous-difference electron-density map was calculated from 25 to 10 Å resolution from highly redundant diffraction data collected with λ = 1.7085 Å X-rays (NaI experiment, Table 1) using anomalous differences as amplitudes and phases that were determined by MR-SAD, 24-fold NCS averaging, solvent flattening and histogram matching (Materials and methods). This map was then averaged in real-space according to the 24-fold NCS symmetry to yield the map shown. The map is contoured at 5.5 σ (gray mesh) and 8.5 σ (pink mesh) and shown in the vicinity of a subunit of Orai (red Cα trace). Methionine and cysteine residues are shown as sticks (colored yellow for carbon and green for sulfur atoms). Methionine residues on M4b and M4-ext are labeled. Portions of neighboring Orai subunits (gray Cα traces) are shown for reference with their helices labeled in parentheses. While their side chain conformations are hypothetical on account of the limited resolution of the diffraction data, anomalous-difference electron-density peaks for methionine and/or cysteine residues on each of the M1-M4 helices and on the M4-ext helix confirm the amino acid register of the atomic model.
Figure 4—video 1. Electron density for H206A Oraicryst from Figure 4A.
Download video file (24.4MB, mp4)
DOI: 10.7554/eLife.36758.007