

Abstract
The fast swimming and associated breaching behaviour of endothermic mackerel sharks is well suited to the capture of agile prey. In contrast, the observed but rarely documented breaching capability of basking sharks is incongruous to their famously languid lifestyle as filter-feeding planktivores. Indeed, by analysing video footage and an animal-instrumented data logger, we found that basking sharks exhibit the same vertical velocity (approx. 5 m s−1) during breach events as the famously powerful predatory great white shark. We estimate that an 8-m, 2700-kg basking shark, recorded breaching at 5 m s−1 and accelerating at 0.4 m s−2, expended mechanical energy at a rate of 5.5 W kg−1; a mass-specific energetic cost comparable to that of the great white shark. The energy cost of such a breach is equivalent to around 1/17th of the daily standard metabolic cost for a basking shark, while the ratio is about half this for a great white shark. While breaches by basking sharks must serve a different function to white shark breaches, their similar breaching speeds questions our perception of the physiology of large filter-feeding fish.
Keywords: shark, energetics, performance, power, bio-logging
1. Introduction, results and discussion
Mackerel sharks (order Lamniformes; family Lamnidae) including the white and mako shark are famous for their high-speed predatory tactics. This strategy of attack is facilitated by adaptations including a streamlined body shape, caudal fin with a high aspect ratio (figure 1a) and, in several species, regional endothermy [1]. Because prey are typically on or near the water surface and are ambushed from below, predation by these sharks often results in breaching, e.g. [2–4]; an iconic behaviour in this group. By contrast, the closely related but ectothermic basking shark (order Lamniformes; family Cetorhinidae) filter-feeds on zooplankton in cool temperate waters (8–16°C) [5]. Given the immobility of planktonic prey and the languid foraging behaviour of basking sharks, it may be expected that the performance capacity between basking sharks and other lamniformes is quite different. However, anecdotal observation of breaching in basking sharks [6,7] suggests that they exhibit high swimming speeds and hence high power outputs (figure 1b).
Figure 1.
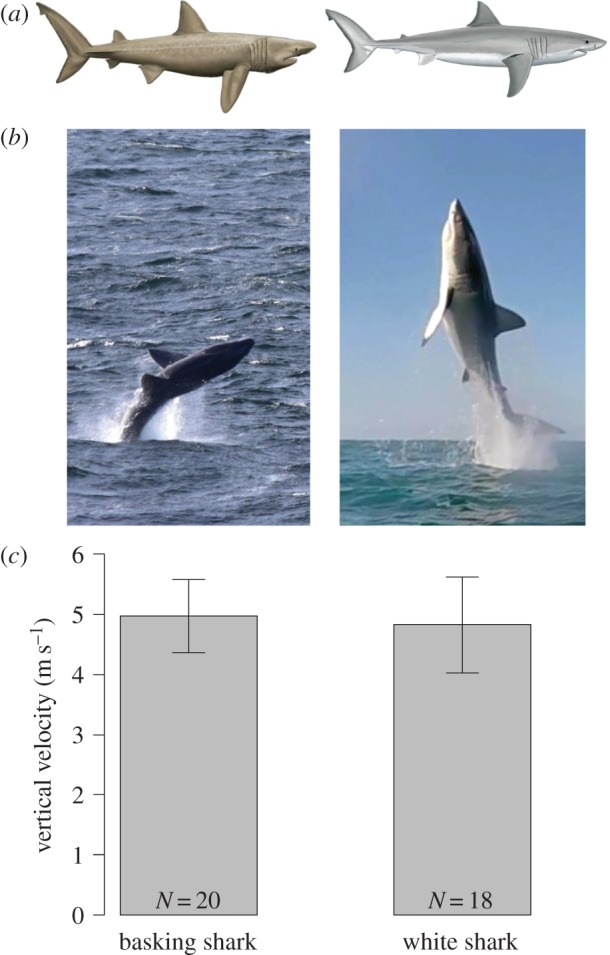
Comparing basking (left panel) and white (right panel) sharks. (a) The external morphology of these species is similar; (b) breaches by these species; (c) vertical breach velocity as determined from video analysis; means and one standard deviation. Illustrations reproduced with permission of Marc Dando, and breaching images credited to Bren Whelan and White Shark Africa™. (Online version in colour.)
To investigate this phenomenon, we compared the swimming performance of basking sharks when breaching to that of predatory white sharks exhibiting the same feat. We analysed video sequences for both species (see Methods; supplementary 1 in the electronic supplementary material) to estimate vertical swimming speeds at the moment of breach based on the duration that their approximate centre of mass (CoM) was out of the water [8]. Both basking sharks and white sharks breach at similar angles (typically around 75° from horizontal) and similar speeds (basking sharks: 5 m s−1, s.d. 0.6, N = 20; great white sharks: 4.8 m s−1, s.d. 0.8, N = 18; figure 1c).
To provide new visual and biomechanical insight into the moments leading up to breaching in basking sharks, we report on the first basking shark breach captured via an animal-borne data logger (see Methods and electronic supplementary material, figure S2). These data show the change in locomotory mode from slow and steady horizontal swimming by a basking shark to a rapid near-vertical ascent and subsequent breach (figure 2; electronic supplementary material, figure S3; supplementary video). This deployment (at the same location as the aforementioned basking shark video recordings; see methods) yielded video footage, tri-axial acceleration data and depth data which revealed the animal (an 8-m male) suddenly switching from slow tail-beat (approx. 0.2 Hz), steady ‘cruise’ swimming near the sea floor to a rapid, continuous acceleration up through the water column culminating in a near-vertical breach (figure 2). In just over 9 s and 10 tail beats, the shark accelerated from a depth of 28 m to the surface, breaking the water's surface at a steep angle. The shark's CoM cleared the water for 1.0 s and peaked at a height of 1.2 m above the surface (figure 2). To achieve this breach, the shark exhibited a sixfold increase in tail beat frequency above that applied during cruising (to 1.2 Hz) (figure 2), and attained a vertical speed of 4.9 m s−1 (and an absolute speed of approx. 5.1 m s−1; electronic supplementary material, figure S4), which is consistent with the mean breach speeds estimated from the onshore video of other basking sharks. This estimate of vertical velocity at the surface based on the duration that the CoM was out of the water (figure 2d, red line) concurs with the rate of ascent during the final second of submersion recorded by the CATSCAM on-board depth sensor (figure 2d, blue line), supporting the validity of the first principles approach to estimating vertical velocity at the point of breaching [8].
Figure 2.

CATSCAM data logger data showing the (a) depth, (b) lateral acceleration, (c) tail beat frequency (TBF) and (d) vertical speed of an 8-m male basking shark immediately prior to breaching. The red line in (d) indicates the independent estimate of vertical breach speed based on first principles and time the dorsal fin-mounted video camera was out of the water during the breach. Selected still images at various stages of the video recording (see supplementary video) are indicated by black arrows. (Online version in colour.)
We compared power output during breaching events in the two species. Mass-specific power required to accelerate a shark is (av + kv3l−1)/ηh, where l is the length of the shark, v and a are its swimming speed and longitudinal acceleration, ηh is the hydrodynamic propulsion efficiency, and k is a shark-specific coefficient depending on the body shape, fins area to body area ratio, and on the associated Reynolds number [9] (supplementary 4 in the electronic supplementary material). Being morphologically similar (figure 1a), we propose basking and white sharks have comparable values of k (0.112 and 0.087, respectively; supplementary 4 in the electronic supplementary material) and the same ηh (0.7, ibid.). Consequently, an 8-m (7.4 m fork length) basking shark swimming at a constant 5 m s−1 will use 2/3 the mass-specific power of a 4-m (3.7 m fork length) white shark at the same speed. We estimate that an 8-m, 2700-kg basking shark swimming at a constant 5 m s−1 will need to generate approximately 2.7 W kg−1 mass of mechanical power; accelerating at 0.4 m s−2 at that same speed would double the power requirement (supplementary 4 in the electronic supplementary material). Given that the maximal power of locomotive muscles is at least 50 W kg−1 muscle [10], these estimates imply that the breaching speed of the basking shark was not limited by its maximal power.
We estimate the mechanical work needed for breaching as (kE/ηh)Ek, where Ek = mv2/2 is the kinetic energy of the shark when leaving the water, and kE is a certain coefficient (probably bounded between 1.3 and 1.5) depending on the acceleration profile and body dimensions (supplementary 4 in the electronic supplementary material). An 8-m basking shark must have used 63–72 kJ of mechanical energy to breach at 5 m s−1. To supply this energy, its muscles used 2.6–3 moles adenosine triphosphate (ATP), mostly furnished by anaerobic catabolism [11,12] of muscle-stored glycogen [13,14]. Six to 7 moles of ATP are required to restore that glycogen post-breach [11,12]. Thus the full energy cost of breaching is approximately 9–10 moles ATP.
We estimate the standard metabolic rate (SMR) of a shark as  , where τ is the absolute body temperature, and kP, α and kτ are certain phenomenological parameters. Using typical values of these parameters, an 8-m basking shark at 15°C has an SMR of about 2 mmol ATP/s. Thus a single breach is energetically equivalent to 1.3–1.5 SMR-hours (5–6% of its minimal daily requirement), of which 0.9–1 SMR-hours is the ‘debt’ to pay post-breach. The ratio R = (kE/ηh)(Ek/P0) can be interpreted as the relative cost of a breach, and it is indicative of (but not equal to) the time the breaching animal will take to recover. This ratio is proportional to m1−α
 , suggesting that a larger animal (large m) with a lower body temperature (small τ) will need longer time to recover (see also [15]). In fact, the R-ratio of a 2700-kg basking shark at 15°C is twice that of a 900 kg great white shark at 23°C. This slow recovery of a large, ectothermic animal undertaking high-powered burst activity may explain why basking sharks do not breach at even higher speeds. White sharks typically breach only once but have been observed exhibiting full breaches up to three times in succession; as far as we are aware there are no data on whether basking sharks ever breach successively [4].
As to the function of breaching events by basking sharks (expensive as they are), there are many possible explanations. Such behaviour by white sharks in the absence of prey is common and considered to act as social communication [16]. Basking shark breaching may serve a similar function, or multiple functions including dominance, mating displays, parasite removal, prey aggregation and/or evasion of predators. Whatever the purpose of this behaviour, the similar breaching speeds of basking sharks and predatory lamnids questions our perception of the physiology of large filter-feeding fish and demonstrates that similar body designs can be well suited to very different lifestyles.
2. Methods
(a). Data collection
Basking shark videos were recorded in 2015 at Malin Head, Ireland (60 fps−1). Twenty-seven high density (HD) videos were captured of 600 breach events over 90 h. White shark videos were recorded in 2009 at two sites in South Africa, during predation attempts on Cape fur seals (Arctocephalus pusillus pusillus) using seal shaped decoys. Twenty-two HD videos were recorded. Vertical breach speeds presented in electronic supplementary material, table S1 and figure 1.
In 2013, a Customized Animal Tracking Solutions integrated multichannel data logger (CATSCAM) was deployed onto an estimated 8-m male basking shark at Malin Head, Ireland (55.37 N, 007.40 W) (electronic supplementary material, figure S2). Three hours of concurrent video footage and accelerometer data were retrieved from the deployment. A single breaching event was identified during the initial visual inspection of the video files (supplementary video; electronic supplementary material, figure S3), and cross-referenced with the corresponding accelerometry and depth data (figure 2). The CATSCAM was dislodged from the shark's dorsal fin during the breach event at the moment of re-entry to the water, ending the deployment.
(b). Data analysis
The time that the approximate CoM of each shark was out of the water during a breach, ta, along with its body angle on exit from the water, were estimated from video footage. The observed angle of the shark's body at the moment of breach was unclear when the breach was angled towards or away from the camera position, thus, only 20 of the 27 basking shark breach videos and 18 of the 22 white shark videos allowed the body angle at the moment of exit to be estimated. The average angle was approximately 75°. Maximum vertical height of the CoM, h, along with vertical breach velocity vv, were estimated using first principles with vv = gta/2 (g is the acceleration of gravity) and  .
.
When analysing CATSCAM data, ta was estimated using on-board video. vv was estimated from ta as before, but also by differentiating depth (as recorded by the logger) with respect to time. Absolute velocity of the shark at breach was estimated from vv using the average breaching angle observed from the shore-based recordings (75°).
Drag, power and mechanical work needed for a breach were estimated after [9] (supplementary 4 in the electronic supplementary material). Mechanical work was converted into moles ATP using the factor of 24 J mmol−1 ATP [17]. The basic metabolic rate was approximated with  , where m is the body mass, τ is the absolute body temperature, whereas kP, α and kτ are certain phenomenological parameters. Following [9], we have used kP = 127 mol ATP/s·kgα, α = 0.8, and kτ = 5020 K after ref. [18]. The mass of a basking shark was estimated with alb, where l is the fork length, whereas a and b are phenomenological constants. We have used a = 6.54 kg m−3 and b = 3 (supplementary 4 in the electronic supplementary material). The fork length of a basking shark was estimated at 93% of its total length—as for the great white. This produces a value of 2690 kg, which is very similar to the estimate of 2670 kg based on a power law best fit line of known data for basking shark lengths and masses [19].
Supplementary Material
Acknowledgements
Thank you Nikolai Liebsch and Peter Kraft of Customized Animal Tracking Solution, the volunteers of the Irish and Inishowen Basking Shark Study Groups and Morne Hardenberg and Mark van Coller of Atlantic Edge Films.
Ethics
Consent was obtained from The National Parks and Wildlife Service, Department of Arts, Heritage and Gaeltacht, Ireland.
Data accessibility
All data are included in the manuscript or in the electronic supplementary material.
Authors' contributions
E.M.J. and J.D.R.H. conceived and designed the study. E.M.J. collected the animal borne logger data and secured research funding for fieldwork in Ireland. A.A.K. and B.W. collected all other video data. G.I., L.G.H. and N.L.P. led the analysis with additional input from E.M.J. All authors discussed the results and provided extensive comments on the manuscript in terms of analysis, interpretation and writing. All authors approved the final version and have agreed accountability for all aspects of the work.
Competing interests
We have no competing interests.
Funding
Funding was provided by the Inishowen Development Partnership.
References
- 1.Shadwick R, Goldbogen J. 2012. Muscle function and swimming in sharks. J. Fish Biol. 80, 1904–1939. ( 10.1111/j.1095-8649.2012.03266.x) [DOI] [PubMed] [Google Scholar]
- 2.Compagno LJV. 2001. Sharks of the world. An annotated and illustrated catalogue of shark species known to date. Volume 2. Bullhead, mackerel and carpet sharks (Heterodontiformes, Lamniformes and Orectolobiformes). Rome, Italy: Food and Agriculture Organization of the United Nations (FAO). Species Catalogue for Fishery Purposes. [Google Scholar]
- 3.Klimley AP. 2013. The biology of sharks and rays. Chicago, IL: University of Chicago Press. [Google Scholar]
- 4.Martin RA, Hammerschlag N, Collier RS, Fallows C. 2005. Predatory behaviour of white sharks (Carcharodon carcharias) at Seal Island, South Africa. J. Mar. Biolog. Assoc. U.K. 85, 1121–1136. ( 10.1017/S002531540501218X) [DOI] [Google Scholar]
- 5.Sims DW, Southall EJ, Richardson AJ, Reid PC, Metcalfe JD. 2003. Seasonal movements and behaviour of basking sharks from archival tagging: no evidence of winter hibernation. Mar. Ecol. Prog. Ser. 248, 187–196. ( 10.3354/meps248187) [DOI] [Google Scholar]
- 6.Matthews L, Parker H. 1951. Basking sharks leaping. Proc. Zool. Soc. Lond., 121, 461–462. [Google Scholar]
- 7.Gore M, Abels L, Wasik S, Saddler L, Ormond R. 2018. Are close-following and breaching behaviours by basking sharks at aggregation sites related to courtship? J. Mar. Biolog. Assoc. U.K. 1–13. ( 10.1017/S0025315418000383) [DOI] [Google Scholar]
- 8.Brunnschweiler JM. 2005. Water-escape velocities in jumping blacktip sharks. J. R. Soc. Interface 2, 389–391. ( 10.1098/rsif.2005.0047) [DOI] [PMC free article] [PubMed] [Google Scholar]
- 9.Iosilevskii G, Papastamatiou YP. 2016. Relations between morphology, buoyancy and energetics of requiem sharks. R. Soc. open sci. 3, 160406 ( 10.1098/rsos.160406) [DOI] [PMC free article] [PubMed] [Google Scholar]
- 10.Josephson R. 1993. Contraction dynamics and power output of skeletal muscle. Annu. Rev. Physiol. 55, 527–546. ( 10.1146/annurev.ph.55.030193.002523) [DOI] [PubMed] [Google Scholar]
- 11.Alberts B, Johnson A, Lewis J, Raff M, Roberts K, Walter P. 2002. Molecular biology of the cell. New York, NY: Garland. [Google Scholar]
- 12.Murray RK, Granner DK, Mayes PA, Rodwell VW. 2000. Harper's biochemistry, 25th edn (Lange Series), pp. 192–218. New York, NY: McGraw-Hill, Health Profession Division. [Google Scholar]
- 13.Dobson G, Hochachka P. 1987. Role of glycolysis in adenylate depletion and repletion during work and recovery in teleost white muscle. J. Exp. Biol. 129, 125–140. [DOI] [PubMed] [Google Scholar]
- 14.Pearson M, Spriet L, Stevens E. 1990. Effect of sprint training on swim performance and white muscle metabolism during exercise and recovery in rainbow trout (Salmo gairdneri). J. Exp. Biol. 149, 45–60. [Google Scholar]
- 15.Goolish EM. 1991. Aerobic and anaerobic scaling in fish. Biol. Rev. 66, 33–56. ( 10.1111/j.1469-185X.1991.tb01134.x) [DOI] [Google Scholar]
- 16.Pyle P, Anderson S, Klimley A, Henderson R. 1996. Environmental factors affecting the occurrence and behavior of white sharks at the Farallon Islands, California. In Great white sharks: the biology of Carcharodon carcharias (eds AP Klimley, DG Ainley), pp. 281–291. San Diego, CA: Academic Press. [Google Scholar]
- 17.Kushmerick M, Davies R. 1969. The chemical energetics of muscle contraction. II. The chemistry, efficiency and power of maximally working sartorius muscles. Proc. R. Soc. B 174, 315–347. [DOI] [PubMed] [Google Scholar]
- 18.Clarke A, Johnston N. 1999. Scaling of metabolic rate with body mass and temperature in teleost fish. J. Anim. Ecol. 68, 893–905. [DOI] [PubMed] [Google Scholar]
- 19.Sims DW. 2008. Sieving a living: a review of the biology, ecology and conservation status of the plankton-feeding basking shark Cetorhinus maximus. Adv. Mar. Biol. 54, 171–220. ( 10.1016/S0065-2881(08)00003-5) [DOI] [PubMed] [Google Scholar]
Associated Data
This section collects any data citations, data availability statements, or supplementary materials included in this article.
Supplementary Materials
Data Availability Statement
All data are included in the manuscript or in the electronic supplementary material.