

Abstract
Visitors can play an important role in the spread of infections. Here, we incorporate an epidemic model into a game theoretical framework to investigate the effects of travel strategies on infection control. Potential visitors must decide whether to travel to a destination that is at risk of infectious disease outbreaks. We compare the individually optimal (Nash equilibrium) strategy to the group optimal strategy that maximizes the overall population utility. Economic epidemiological models often find that individual and group optimal strategies are very different. By contrast, we find perfect agreement between individual and group optimal strategies across a wide parameter regime. For more limited regimes where disagreement does occur, the disagreement is (i) generally very extreme; (ii) highly sensitive to small changes in infection transmissibility and visitor costs/benefits; and (iii) can manifest either in a higher travel volume for individual optimal than group optimal strategies, or vice versa. The simulations show qualitative agreement with the 2003 severe acute respiratory syndrome (SARS) outbreak in Beijing, China. We conclude that a conflict between individual and group optimal visitor travel strategies during outbreaks may not generally be a problem, although extreme differences could emerge suddenly under certain changes in economic and epidemiological conditions.
Keywords: game theory, travel, infectious disease, decision making, mathematical modelling
1. Introduction
Visitors can play an important role in the transmission and spread of infectious diseases. They can serve as susceptible hosts and be infected while staying in one place and then act as mobile sources of case imports to other populations [1–3]. On the one hand, more visitors can lead to substantial benefits for the local economy and businesses. On the other hand, some infectious diseases spread aggressively in major tourism destinations (e.g. Hong Kong, New York, Singapore, Toronto, Beijing), and a large number of visitors can have unexpected impacts on public health [3–5]. For example, severe acute respiratory syndrome (SARS) was introduced to Beijing, China by a few infected visitors in early March 2003, resulting in a large epidemic [6–11]. Other examples where visitors have played a role in regional or international spread include pandemic influenza [12–14], Ebola fever [15] and Middle East respiratory syndrome coronavirus (MERS-CoV) [16]. Enforcing restrictions on incoming visitors could be an efficient way to control local disease outbreaks [7,17–19], but the decision to restrict visitors must be weighed carefully due to the economic and social repercussions.
Game theory attempts to analyse situations where individuals must make decisions in a group environment and where each individual's decision influences the pay-off received by the others in the group [20]. Many interventions (such as vaccination and social distancing) create positive externalities, i.e. benefits to those who did not participate in the intervention, because of herd immunity generated by interruption of transmission. Hence, many previous models have illustrated the discrepancy between the optimal individual strategy that maximizes personal interest, and the strategy that serves the group best by minimizing the overall health burden on the population [21–26]. Although several factors may alter this picture and have been explored in successive work—such as the beneficial effects of social norms and prosocial vaccination [27,28]—these models often illustrate a conflict between group and individual optima across a very broad region of parameter space, covering most epidemiologically and economically relevant regimes [21,22,24,25].
However, this previous research has been mostly concerned with individuals making decisions in a closed population where the disease is already established and is spreading [21–25,29–33], and does not consider multipopulation interactions or the strategic considerations faced by a visitor deciding whether to travel to an affected area during an outbreak. In the context of travel decisions, game theory can be used to answer questions such as whether travelling or not travelling to a location is optimal according to a criterion of self-interest, and the answers it provides can be contrasted with optimal control strategy from the health authority perspective, in terms of maximizing overall population utility.
In this work, we incorporate an epidemic model (based on the classic susceptible–infectious–recovered (SIR) model) into a game theoretical framework to investigate the effects of strategic decisions about travel on local disease control. In contrast with many previous game theoretical analyses of decision making in epidemiological systems in a closed population, for this visitor's game, we find perfect agreement between the individual and group optimal strategies for a range of epidemiologically and economically plausible parameter values. This agreement can be observed in two forms: individual and group optimal strategies both completely reject travelling when the real or perceived disease risk level is sufficiently high, or both strategies allow free travel when the real or perceived disease risk level is sufficiently low. However, disagreement (or conflict) between the individual visitor strategy and the group optimal strategy is observed in two forms: an overload or deficit of visitors compared to the group optimum. In regions where disagreement occurs, the disagreement between the individual optimum (corresponding to a ‘voluntary entrance’ scheme) and the group optimum (corresponding to a ‘restricted entrance’ scheme) is significant. During an outbreak, this conflict is likely to occur at any real or perceived disease risk level. More importantly, in this region, the model outcomes are highly sensitive to small changes in infection transmissibility and visitor costs/benefits. For certain parameter regimes, uncontrolled visitor inflow could result in unexpected large-scale outbreaks when the disease risk level suddenly increases by even a small amount, and the local health authority's travel restrictions could effectively control disease outbreaks when visitor inflow is considered to be ‘overloaded’ during epidemics. Interestingly, the faster the disease risk information is updated, the more likely a discrepancy will occur. Moreover, faster updating of the disease risk information could effectively prevent visitor inflow ‘overload’ and therefore stop an outbreak.
The remaining parts of this work are organized as follows. In the next two sections, we establish a game theoretical framework and an epidemic model including both travelling and local populations, to model the individual decision-making process. In the subsequent sections the results are presented along with a detailed discussion.
2. Travelling game
Our game is a population game where players are individuals in a homeland population (the ‘travelling population’) deciding whether or not to travel to an affected destination. These individuals can move through the following states:
| 2.1 |
A certain fraction of individuals in a homeland population are designated as potential visitors, who have the economic means and opportunities for travel. A potential visitor may adopt a strategy of travelling to the destination and leaves their homeland, becoming a ‘visitor outside’. Upon arrival at the destination, they become a ‘visitor inside’, and subsequently they become a ‘removed visitor’ and re-join the homeland population, again as a potential visitor. A potential visitor corresponds to N1 in table 1, a visitor outside corresponds to ρN1 in the term f(ρ) in equation (3.1), a visitor inside corresponds to (S1 + I1 + R1) in electronic supplementary material, S3, and an individual in homeland means that a visitor has been removed from the system and re-joins individuals in the homeland. More details of the steps individuals may take in travelling can be found in electronic supplementary material, S1. Figure 1 presents the process of a ‘travelling’ individual joining the epidemic system (i.e. from ‘potential visitor’ to ‘individual in homeland’).
Table 1.
Summary table of model parameters. The ranges of the parameters are used for the sensitivity analysis. The point values of the disease parameters reflect influenza, and the ranges of the parameters reflect a broad range of other infectious diseases.
The values and ranges of the parameters related to travel (i.e. K1, r, ν−1 and λ−1) reflect Hong Kong as the default destination.
| parameter | notation | value | range/remark | source(s) |
|---|---|---|---|---|
| basic reproduction number |  |
2.5a | [1.0, 10.0] | [34–37] |
| mean duration that visitors are outside border | λ−1 | 3 days | [0.1, 10] | S6.1 |
ratio: 
|
N1 | 7.5% | [5.0%, 15.0%] | assumed, S2.2 and S3 |
ratio: 
|
K1 | 7.0% | [5.0%, 15.0%] | S6.2 |
| mean infectious period | γ−1 | 5 days | [2.0, 10.0] | [38] |
| mean human lifespan | μ−1 | 70 years | fixed | — |
| mean duration that visitors are inside border | ν−1 | 3 days | [0.5, 15.0] | S6.3 |
| relative risk (as in equation (2.5)) |  |
10−3 | [10−4, 10−2] | S6.4 |
| probability of travelling | p | — | [0.0, 1.0] | equation (2.4) |
| optimal probability of travelling | p* | — | [0.0, 1.0] | S2.1 |
| proportion of visitors | ρ | — | [0.0, 1.0] | equation (2.2) |
| optimal proportion of visitors | ρ* | — | [0.0, 1.0] | equation (2.6) and S2.2 |
| cost of all game players | Υ | — | — | S2.2 |
| difference between group and individual optima | Δρ | ρ* − p* | [−1.0, 1.0] | equation (4.1) |
| probability that a disease outbreak occurs | α | 0.01b | [0.001, 0.02] | assumed |


Figure 1.

The epidemic model diagram. Black arrows represent infection status transition paths and red dashed arrows represent transmission paths. The light blue arrows represent natural births and deaths, and green arrows represent visitor entry and exit. Square compartments represent local classes, circular compartments represent visitor classes, and the diamond denotes the ‘decision’ process of potential visitors. Red compartments represent infectious classes. The light grey area (surrounded by a grey dashed line) represents ‘inside border’. The horizontal black dashed line separates the total population into ‘local population’ (or local residents) and ‘travelling population’ (as in Path 2.1). (Online version in colour.)
For simplicity, we suppose that every individual receives the same information and picks strategies in the same way (i.e. with equivalent preferences and equivalent pay-off for the same strategy). An individual can decide whether to travel (i.e. the ‘travelling’ strategy) or not to travel (i.e. the ‘non-travelling’ strategy) to their destination. We use r1 to denote the perceived cost (negative pay-off) of morbidity and/or mortality risk (i.e. the risk of disease, or as a term of ‘health cost’) from infection. Similarly, we use r0 to denote the perceived cost of the risk of utility loss for adopting the ‘non-travelling’ strategy, since those individuals lose economic or social opportunities. Therefore, we write the pay-off for an individual following the travelling strategy as
| 2.2 |
where α represents the probability that an epidemic occurs at the destination during a traveller's visit (or, α = 1 for an ongoing epidemic that the traveller knows about before departure), ϕ(ρ; P) is the probability that a visitor is infected during the trip (to the epidemic destination) given that the pre-existing immunity level in the destination population is P, and ρ is the overall proportion of potential visitors who adopted the ‘travel’ strategy.
To assess the risk of a visitor being infected during the trip, we need to know the basic reproduction number of the disease,  , i.e. the expected number of secondary cases generated by a typical primary case during his/her infectious period in an otherwise susceptible population. In the case of
  , we have ϕ(ρ; P) = 0 if
 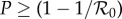 (see electronic supplementary material, S2.1). This is called perfect herd immunity, i.e. an outbreak cannot occur when the population immunity level is greater than
  [40,41]. We denote the pay-off of an individual following the non-travelling strategy as
| 2.3 |
Since this is a population game, we also define a mixed strategy where players follow the travelling strategy with a probability p and follow the non-travelling strategy with a probability (1 − p). The pay-off function is then
| 2.4 |
The game remains unchanged if we scale the pay-off function by a constant; thus, we eliminate one parameter in equation (2.4) by leaving only the relative risk, r = r0/r1. Normally, we have 0 < r0 ≪ r1 since the pay-off of utility loss, r0 in equation (2.3), should be less than that of health loss, r1 in equation (2.2), if the disease is severe or potentially deadly. Hence we assume 0 < r ≪ 1 in general. Furthermore, we have
| 2.5 |
For convenience, we denote ϕ(ρ; P) as ϕ(ρ) and E(p, ρ; P) as E(p, ρ) and fix P in the rest of this work. We can show that the individual equilibrium (p*) of the game exists, is the unique Nash equilibrium, and is stably convergent (see electronic supplementary material, S2.1).
We formulate the (scaled) costs of all potential visitors (game players) as
| 2.6 |
where all terms have the same meaning as in equation (2.5). More details are provided in electronic supplementary material, S2.2. We also define the group (Pareto) optimum ρ* as the value of ρ for which the population average cost function Υ(ρ) of all potential visitors (i.e. all game players) is minimized.
3. Epidemic model
3.1. Formulation of epidemic model
To specify the infection probability ϕ(ρ), we adopt the standard SIR model. Individuals of the destination population (excluding visitors) are categorized as susceptible to the disease (S, those who may be infected), infectious (I, those capable of transmitting disease) or removed (R, those who are either recovered and immunized or died). Similarly, visitors are also categorized as susceptible (S1), infectious (I1) or removed (R1). We use S, I and R (S1, I1 and R1) to denote the proportions of susceptible, infectious and recovered individuals in the destination (visitor) populations, respectively. This patchy population structure was proposed previously in [1,2,42,43]. Before taking the trip, visitors are assumed to be totally susceptible. We illustrate this ‘local-and-travelling population’ interactive epidemic system in figure 1. We further assume that the susceptible visitors follow a logistic growth mechanism.
-
—
The visitor population capacity (e.g. the number of beds in hotels) of one place is finite and assumed to be a constant.
-
—
Low (/high) volume of visitors will increase (/decrease) the recruitment effort of travellers for a business trip and decrease (/increase) the expense for a recreation trip.
Thus, logistic growth is a reasonable choice. After eliminating R′ and R′1 (see electronic supplementary material, S3 for details), we formulate the epidemic model as
 |
3.1 |
where fρ = f(ρ) = ρλN1 represents the rate of incoming visitors, K1 is the maximum visitor capacity that the destination is willing (or able) to accept, N1 is the number of all players (i.e. all potential visitors), and players who adopt the ‘travel’ strategy, travel from the homeland to the destination at a rate  (see electronic supplementary material, S6.1). We express both K1 and N1 in units of proportion of the population threshold (destination population plus the maximum visitor capacity) and we fix N1. We assume that all trips are 3 days long, hence visitors return at rate
  (see electronic supplementary material, S6.3). We summarize all model parameters in table 1.
The contact term β is a function of  . Using the next generation matrix method [44], we derive the basic reproduction number of our epidemic model as
| 3.2 |
thus,  when the values of the other parameters are fixed.
3.2. Model equilibria
We denote the disease-free equilibrium (DFE) as
where I = I1 = 0 and S(1)1 < K1. The DFE ( ) is globally stable when
  , whereas it is unstable when
  . When
  , there is an endemic, i.e. the visitor-absent endemic equilibrium,
where S1 = I1 = 0. Specifically, S(1) = (γ + μ)/β is the reciprocal of  of the standard SIR model [41].
  can be realized when fρ in S′1 (see equation (3.1)) becomes 0 and it is locally stable. When
  , there also exists another endemic equilibrium corresponding to a mixed state of local and visitor infections (i.e. infected visitors), denoted as
 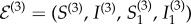 . The solution of
  can be obtained explicitly by taking the non-negative root of [S′, I′, S′1, I′1]T = 0 (0 represents the zero vector) with both I ≠ 0 and I1 ≠ 0.
3.3. Probability of visitors becoming infected
Given the model in equation (3.1) and the assumption that all individuals in a compartment leave it at the same rate regardless of how long they have been there, we may take the probability of a visitor becoming infected during the trip to be equal to the ratio of the rate at which susceptible visitors (S1) are infected to the rate at which susceptible visitors (S1) leave the destination [22],
 |
3.3 |
We present the numerical results of the relationship between ϕ(ρ) and ρ in electronic supplementary material, S2.1. Given the relationship between β and  , one may derive the relationship between
  and ϕ(ρ) explicitly.
4. Results and discussion
4.1. Individual equilibrium and travelling optimum
We first explore how the predicted travel strategies depend on the basic reproduction number ( ) and the relative risk (r). Many factors, including seasonal (climatic) factors and the evolution of viruses, could affect
  . Additionally, media coverage of the risk and relevant educational programmes [45–50] could influence visitors' perception of the risk, thus changing r1 and r (equation (2.5)). During an ongoing epidemic (α = 1), we find that both r and
  significantly influence the individual equilibrium p* and the group optimum ρ* (figure 2). (The values of the other parameters are fixed and listed in table 1, and small variations in their values do not dramatically change the trends of these relationships.) We observe that both the individual and population optima have the same qualitative relationship with
  and r: both optima are monotonically decreasing functions of
  and monotonically increasing functions of r. This behaviour is expected, since an increasing transmissibility should reduce both the individual incentive to travel and the group optimal rate of travelling, while a decline in the relative risk of travelling should encourage travel, both individually and as a group. More surprisingly, the sudden transition of the individual optimum from 0 to 1 (as shown in figure 2a) is steeper than that of the population optimum (as shown in figure 2b).
Figure 2.

Individual and population optima as functions of the basic reproduction number  and the relative risk r during an epidemic (α = 1). (a) The Nash equilibrium proportion of travellers p*; (b) the group optimal proportion of travellers ρ*, with colour codes to indicate magnitude. The range of
  and the values of the other parameters are listed in table 1. (Online version in colour.)
To further explore the relationship between the individual and group optimum, we study their difference:
| 4.1 |
More details are given in electronic supplementary material, S2. A plot of Δρ versus the population optimum ρ* and the individual equilibrium p* during an ongoing epidemic (α = 1) show that they agree perfectly for most of the parameter space (figure 3). For most of the parameter region, ρ* = p* = 0 or 1 (i.e. the white area in figure 3). These two situations can occur when both the disease risk (reflected by  ) and perceived risk are (i) either considerably high, i.e. ρ* = p* = 0, in which case no one intends to travel and complete border entrance restrictions are implemented, or (ii) considerably low, i.e. ρ* = p* = 1, in which case all individuals intend to travel and border entrance is completely unrestricted. Variations in the values of the other parameters do not change the trends of these relationships (table 1).
Figure 3.

Discrepancy between individual and population optima as a function of the basic reproduction number  and relative risk r, during an epidemic (i.e. α = 1). (a) The relationship among r (equation (2.5)),
 and Δρ (equation (4.1)); and (b) the relationship between r and Δρ for
  , 2.5, 5.0, 10.0. In (a), the colour code quantifies Δρ. The white area represents Δρ = 0 under the two cases that ρ* = p* = 0 or 1. In (b), ρ* is in green and p* is in purple. In (a,b), the range of
  and the values of the other parameters are listed in table 1. (Online version in colour.)
However, despite the broad agreement across the parameter plane, the region where ρ* and p* are discrepant reveals interesting findings. During an epidemic, most locations are expected to receive fewer visitors (with limited visitor entrance) than usual when there is no epidemic. But the model predicts parameter regimes where the group optimal solution requires a higher volume of travel than what is individually optimal: in the blue region of the parameter plane, Δρ > 0, meaning p* < ρ* (figure 3a). In this regime, the health authority would wish to encourage more travel than actually occurs. However, if either the disease risk  or the perceived pay-off of disease risk r1 decline even slightly (for instance, due to seasonal factors and/or changing media coverage) the situation is reversed, and the discrepancy in interests Δρ could change from Δρ > 0 to Δρ < 0 (red region in figure 3a). When Δρ < 0, a health authority restriction on visitors is desired and only ρ*/p* of the visitors should be allowed to enter in order to achieve the population optimum ρ*. In summary, figure 3 shows a surprising contrast to many game theoretical models comparing individual and group optimal outcomes: in large parts of the parameter space, there is no discrepancy. However, when a discrepancy does emerge, it can emerge very quickly with small changes in parameter values, and moreover, the individual optimal travel rate could exceed the group optimal rate, or vice versa.
4.2. Example of the 2003 severe acute respiratory syndrome outbreak in Beijing
The epidemic patterns predicted by our model under a manipulation of the group optimal strategy ρ are qualitatively similar to the epidemic curve during the 2003 SARS outbreak in Beijing, China, resulting from the timing of certain travel-related events during the outbreak. Figure 4a (adapted from Pang et al. [11]) shows weekly reported cases in Beijing during the outbreak. Data are available from the electronic supplementary material. The time point when knowledge of the epidemic was first made public, e.g. SARS made reportable (Apr 10) in fig. 1 of Pang et al. [11], refers to the date of news press.1 The time point of the official start of restrictions on travel refers to the events outbreak announced publicly by government (Apr 20) and fever checks at airports begin (Apr 22) in fig. 1 of Pang et al. [11]. We note that these two events resulted in almost no one travelling to Beijing, i.e. ρ = 0, until the end of the SARS epidemic.2
Figure 4.

The 2003 SARS outbreak in Beijing, China. (a) The reported cases during the 2003 SARS outbreak in Beijing, China (adapted from Pang et al. [11]) and (b) the numerical results of the epidemic model (see equations (3.1)). In (a,b) the vertical lines represent the starting points of events, and the vertical dashed lines represent the time points with a lag of 3 days. In (a) the SARS epidemic and government intervention are given on a timeline from 5 March to 29 May 2003. The black dashed line is the time series smoothed by using the LOESS function (R v. 3.4.3 ). In (b) the initial states are set as [S(0), I(0), S1(0), I1(0)] = [(1 − K1), 0, (K1 − 1 × 10⁻⁸), 1 × 10⁻⁸], with  , N1 = 15% and ρ = 0.5 (see grey parts of the bars on the top). The blue and red dashed lines are the simulations under ‘what if’ scenarios in which travel restriction policies were implemented earlier. The black and gold dashed lines are under ‘what if’ scenarios in which travel restriction (or reduction) failed and travel input suddenly increased, respectively. The values of the other parameters are assumed to be the same as those in table 1, and the changes in parameters are marked at the top of the panel. Note that the timelines are the same in (a,b). (Online version in colour.)
We also note that, although the Beijing SARS outbreak was initially sparked by travellers, the proportion of cases in Beijing caused by travellers over the entire outbreak is thought to be small, especially after fever screening began [51]. Also, the United States Centers for Disease Control suggests that travellers to SARS-affected destinations take precautions to avoid infection, suggesting a non-trivial infection risk for travellers.3 The latter two features of the Beijing SARS outbreak are consistent with our model assumptions.
Figure 4b shows a model-simulated epidemic curve that largely matches the observed epidemic curve. To generate this curve we focus on changes in  (disease transmissibility) and ρ (proportion of players adopting the ‘travel’ strategy). We decrease ρ from 0.5 to 0.25 at the time indicated by the blue dashed vertical line in figure 4b. This decrease is associated with the start of public awareness of the SARS risk in Beijing after it was revealed to the public (see endnote 1). Similarly, the decrease in
  from 2.5 to 1.75 as also indicated by the blue dashed vertical line would correspond to an accompanying reduction of the effective contact rate due to the onset of public awareness of SARS. (The effective contact rate is defined as the product of the contact rate and transmission probability per contact. It is believed, and is modelled, to be negatively, or at least non-positively, related to reported disease incidence [42,46–48,52].) The time lag, i.e. the gap between the pairs of vertical solid and dashed lines of the same colour in figure 4, is fixed at 3 days due to the mixed effects of the incubation period (or the latent period) of SARS infection and the delay of human reaction to the outbreak. The model simulation largely captures the observed SARS epidemic between March and May 2003, as shown in figure 4a,b and fig. 8 of [53].
The model-predicted outcome of an earlier implementation of travel restrictions (see blue and red dashed lines in figure 4b) is obtained by fixing the combinations of  and N1, and setting ρ = 0 (i.e. nobody is able or willing to enter due either to travel restrictions or cautious behaviour due to SARS risk). We found that the earlier the travel restrictions are implemented, the more effectively the disease outbreak level is reduced. By contrast, an uncontrolled and sudden increase in the proportion of visitors (e.g. increasing ρ from 0.5 to 0.75) could yield a larger outbreak, as indicated by the gold dashed lines in figure 4b.
We note that our objective in figure 4 is to convey how the model framework applies during an unfolding epidemic where travel restrictions are put in place partway through the epidemic. Hence, although the starting value of  is epidemiologically plausible for SARS [54,55], the parameters were chosen for convenience rather than being fitted systematically. However, slight changes in the parameter values away from this parameter regime do not change the outcomes. Also, additional numerical results for wider parameter variations in electronic supplementary material, S4 show the range of possible dynamics exhibited by the model.
4.3. Additional sensitivity analysis
The sensitivity analysis of the baseline model (electronic supplementary material, S5) shows that the results are most sensitive to the relative risk (r), basic reproduction number ( ) and the rate at which individuals leave the destination (ν). More detailed discussion of the influence of these model parameters on model predictions is given in electronic supplementary material, S7.
In the baseline model, for simplicity, we assume that visitors do not bring infection back to their home country. To amend this shortcoming, we introduce an additional probabilistic case importation risk level into an extended model (see parameters in table 1). Under this extension, our main results are unchanged (see electronic supplementary material, S9 for a detailed discussion). We also included pre-existing immunity among visitors in an extended model, and also found that our main results were unchanged. A detailed discussion can be found in electronic supplementary material, S8.
4.4. Model limitations and future research
In this subsection, we discuss possible model extensions and some limitations. In the baseline model, we assume individuals have accurate knowledge of the real basic reproduction number  . However, an imbalance between the perceived and actual
  could exist [56–58]. We denote
  as the perceived
  . We expect the perceived
  to correlate positively with the actual
  . Thus, we assume
  is a non-decreasing function of
  . Given the perceived disease risk
  , the pay-off of the disease risk
  , i.e. r1 as a function of
  given in equation (2.2), is a non-decreasing function of
  and a non-decreasing function of
  . One of the simplest forms of
  is
is  with a positive scalar. Future research should explore the impact of such a difference between
  and
and  .
.
In addition, travelling players may not always be informed about outbreak events in a timely manner. Thus, a time delay between  and
and  could exist. We denote
  , where τ ≥ 0 is the time lag between the occurrence of infection risk and the perception of infection risk. If we set τ = 0 for all t by assuming humans receive accurate knowledge of a risk when it emerges, we have
  . In this work, we consider a limiting case of τ = 0. In reality, this assumption can be relaxed, and a reasonable estimate can be used. The value of τ depends on the impacts of the risk and the efficiency of the media and relevant programmes (e.g. news press coverage [22,42,46,48], education programmes [22,50,59], communication effectiveness in social networks [49,50,60–63] and pre-existing public health awareness [14,49,61]).
In this work, we assumed the same information availability and the same strategic response for the entire visitor population (see equations (2.2) and (2.3)). However, different groups of people could have different risk perceptions or risk preferences, hence the pay-offs could differ between individuals. This has been demonstrated in previous game theoretical models to lead to different equilibria and optima regarding the human response to epidemics [26,64]. Consider the situation where E1 = E0 (see equations (2.2) and (2.3)). In this case, some individuals may prefer the travelling strategy (i.e. risk-seeking preference), while others may prefer the non-travelling strategy (i.e. risk-averse preference).
Future models including a heterogeneous population could improve the realism of the model and help test the robustness of our predictions. One way this could be done is by allowing the disease natural history and economic parameters to vary between individuals (as noted in the foregoing paragraph), to reflect varying health conditions and socio-economic status. Another way to account for heterogeneity at a larger scale is to allow for a patchy environment [1] where different sub-populations are subject to different conditions. Under such circumstances, we expect that the boundaries in figure 2 would probably become less sharp, although it is not clear a priori how large the effect would be. We expect that most forms of heterogeneity would not change our finding that the individual and group optima tend to agree in this kind of game theoretical framework, although the regime shifts implied by figure 2 would probably be less dramatic if heterogeneity were included.
5. Conclusion
Many game theoretical studies of closed socio-epidemiological systems find a significant discrepancy between individual and group (Pareto) optima in a broad range of economic and epidemiological parameters. In this work, we studied an open socio-ecological system in which visitors decide whether to travel to a location with an ongoing outbreak. Surprisingly, we found perfect agreement between the individual and group optimal strategies for broad ranges of parameter values. When a disagreement between the individual and group optimal strategies occurs, the discrepancy was very large and highly sensitive to small changes in disease transmissibility and visitor costs/benefits. For instance, if disease transmissibility increases by even a small amount, the uncontrolled incoming visitors are capable of causing an unexpected outbreak. This suggests that a discrepancy between the individual and group optima could emerge suddenly in real-world settings, provided that slight changes in economic and epidemiological factors (parameters) occur. However, timely implementation of travel restrictions by health authorities may effectively prevent large-scale outbreaks.
Supplementary Material
Supplementary Material
Acknowledgements
We are grateful to reviewers for valuable comments.
Endnotes
News press of the reveal of the 2003 SARS epidemic in Beijing, China: http://www.lifeweek.com.cn/2003/0729/5582.shtml (in Chinese) and http://news.eastday.com/epublish/gb/paper148/20030530/class014800003/hwz953568.htm.
The news press of National Tourism Administration (see (in Chinese) http://www.people.com.cn/GB/jingji/1038/1970533.html) and WHO travel advice (see http://www.who.int/csr/sars/archive/2003_04_23/en/)
US Centers for Disease Control. Guidance for persons traveling to areas where SARS cases have been reported. See https://www.cdc.gov/sars/travel/advice.html.
Data accessibility
The 2003 SARS cases time series in Beijing are obtained from Pang et al. [11] and are available from the electronic supplementary material.
Authors' contributions
All authors conceived and carried out the study, drafted the manuscript and gave final approval for publication.
Competing interests
We declare we have no competing interests.
Funding
S.Z. and D.H. were supported by an Early Career Scheme grant from the Hong Kong Research Grant Council (PolyU 251001/14M).
References
- 1.Wang W, Zhao XQ. 2004. An epidemic model in a patchy environment. Math. Biosci. 190, 97–112. ( 10.1016/j.mbs.2002.11.001) [DOI] [PubMed] [Google Scholar]
- 2.Brauer F, van den Driessche P. 2001. Models for transmission of disease with immigration of infectives. Math. Biosci. 171, 143–154. ( 10.1016/S0025-5564(01)00057-8) [DOI] [PubMed] [Google Scholar]
- 3.Cui JA, Takeuchi Y, Saito Y. 2006. Spreading disease with transport-related infection. J. Theor. Biol. 239, 376–390. ( 10.1016/j.jtbi.2005.08.005) [DOI] [PubMed] [Google Scholar]
- 4.Epstein JM, Goedecke DM, Yu F, Morris RJ, Wagener DK, Bobashev GV. 2007. Controlling pandemic flu: the value of international air travel restrictions. PLoS ONE 2, e401 ( 10.1371/journal.pone.0000401) [DOI] [PMC free article] [PubMed] [Google Scholar]
- 5.He D, Chiu AP, Lin Q, Cowling BJ. 2015. Differences in the seasonality of MERS-CoV and influenza in the Middle East. Int. J. Infect Dis 40, 15–16. ( 10.1016/j.ijid.2015.09.012) [DOI] [PMC free article] [PubMed] [Google Scholar]
- 6.Ruan S, Wang W, Levin SA. 2006. The effect of global travel on the spread of SARS. Math. Biosci. Eng. 3, 205–218. ( 10.3934/mbe.2006.3.205) [DOI] [PubMed] [Google Scholar]
- 7.Bauch CT, Lloyd-Smith JO, Coffee MP, Galvani AP. 2005. Dynamically modeling SARS and other newly emerging respiratory illnesses: past, present, and future. Epidemiology 16, 791–801. ( 10.1097/01.ede.0000181633.80269.4c) [DOI] [PubMed] [Google Scholar]
- 8.Lipsitch M. et al. 2003. Transmission dynamics and control of severe acute respiratory syndrome. Science 300, 1966–1970. ( 10.1126/science.1086616) [DOI] [PMC free article] [PubMed] [Google Scholar]
- 9.Gumel AB. et al. 2004. Modelling strategies for controlling SARS outbreaks. Proc. R Soc. B 271, 2223–2232. ( 10.1098/rspb.2004.2800) [DOI] [PMC free article] [PubMed] [Google Scholar]
- 10.Chowell G, Fenimore PW, Castillo-Garsow MA, Castillo-Chavez C. 2003. SARS outbreaks in Ontario, Hong Kong and Singapore: the role of diagnosis and isolation as a control mechanism. J. Theor. Biol. 224, 1–8. ( 10.1016/S0022-5193(03)00228-5) [DOI] [PMC free article] [PubMed] [Google Scholar]
- 11.Pang X, Zhu Z, Xu F, Guo J, Gong X, Liu D, Liu Z, Chin DP, Feikin DR. 2003. Evaluation of control measures implemented in the severe acute respiratory syndrome outbreak in Beijing, 2003 JAMA 290, 3215–3221. ( 10.1001/jama.290.24.3215) [DOI] [PubMed] [Google Scholar]
- 12.Grais RF, Ellis JH, Glass GE. 2003. Assessing the impact of airline travel on the geographic spread of pandemic influenza. Eur. J. Epidemiol. 18, 1065–1072. [DOI] [PubMed] [Google Scholar]
- 13.Poletti P, Ajelli M, Merler S. 2011. The effect of risk perception on the 2009 H1N1 pandemic influenza dynamics. PLoS ONE 6, e16460 ( 10.1371/journal.pone.0016460) [DOI] [PMC free article] [PubMed] [Google Scholar]
- 14.Cornforth DM, Reluga TC, Shim E, Bauch CT, Galvani AP, Meyers LA. 2011. Erratic flu vaccination emerges from short-sighted behavior in contact networks. PLoS Comput. Biol. 7, e1001062 ( 10.1371/journal.pcbi.1001062) [DOI] [PMC free article] [PubMed] [Google Scholar]
- 15.Funk S, Knight GM, Jansen VA. 2014. Ebola: the power of behaviour change. Nature 515, 492 ( 10.1038/515492b) [DOI] [PubMed] [Google Scholar]
- 16.Jack A. 2015. Why the panic? South Korea's MERS response questioned. BMJ Br. Med. J. (Online) 350, h3403 ( 10.1136/bmj.h3403) [DOI] [PubMed] [Google Scholar]
- 17.He D, Chiu AP, Lin Q, Yu D. 2017. Spatio-temporal patterns of proportions of influenza B cases. Sci. Rep. 7, 40085 ( 10.1038/srep40085) [DOI] [PMC free article] [PubMed] [Google Scholar]
- 18.Hollingsworth TD, Ferguson NM, Anderson RM. 2006. Will travel restrictions control the international spread of pandemic influenza? Nat. Med. 12, 497–499. ( 10.1038/nm0506-497) [DOI] [PubMed] [Google Scholar]
- 19.Apolloni A, Poletto C, Ramasco JJ, Jensen P, Colizza V. 2014. Metapopulation epidemic models with heterogeneous mixing and travel behaviour. Theor. Biol. Med. Modell. 11, 3 ( 10.1186/1742-4682-11-3) [DOI] [PMC free article] [PubMed] [Google Scholar]
- 20.Von Neumann J, Morgenstern O. 2007. Theory of games and economic behavior. Princeton, NJ: Princeton University Press. [Google Scholar]
- 21.Bauch CT, Galvani AP, Earn DJ. 2003. Group interest versus self-interest in smallpox vaccination policy. Proc. Natl Acad. Sci. USA 100, 10 564–10 567. ( 10.1073/pnas.1731324100) [DOI] [PMC free article] [PubMed] [Google Scholar]
- 22.Bauch CT, Earn DJ. 2004. Vaccination and the theory of games. Proc. Natl Acad. Sci. USA 101, 13 391–13 394. ( 10.1073/pnas.0403823101) [DOI] [PMC free article] [PubMed] [Google Scholar]
- 23.Fine PE, Clarkson JA. 1986. Individual versus public priorities in the determination of optimal vaccination policies. Am. J. Epidemiol. 124, 1012–1020. ( 10.1093/oxfordjournals.aje.a114471) [DOI] [PubMed] [Google Scholar]
- 24.Chen FH. 2006. A susceptible–infected epidemic model with voluntary vaccinations. J. Math. Biol. 53, 253–272. ( 10.1007/s00285-006-0006-1) [DOI] [PubMed] [Google Scholar]
- 25.Codeco CT, Luz PM, Coelho F, Galvani AP, Struchiner C. 2007. Vaccinating in disease-free regions: a vaccine model with application to yellow fever. J. R. Soc. Interface 4, 1119–1125. ( 10.1098/rsif.2007.0234) [DOI] [PMC free article] [PubMed] [Google Scholar]
- 26.Reluga TC, Bauch CT, Galvani AP. 2006. Evolving public perceptions and stability in vaccine uptake. Math. Biosci. 204, 185–198. ( 10.1016/j.mbs.2006.08.015) [DOI] [PubMed] [Google Scholar]
- 27.Shim E, Chapman GB, Townsend JP, Galvani AP. 2012. The influence of altruism on influenza vaccination decisions. J. R. Soc. Interface 9, 2234–2243. ( 10.1098/rsif.2012.0115) [DOI] [PMC free article] [PubMed] [Google Scholar]
- 28.Tamer O, Thampi V, Bauch CT. 2014. The influence of social norms on the dynamics of vaccinating behaviour for paediatric infectious diseases. Proc. R. Soc. B 281, 20133172 ( 10.1098/rspb.2013.3172) [DOI] [PMC free article] [PubMed] [Google Scholar]
- 29.Wang Z, Andrews MA, Wu ZX, Wang L, Bauch CT. 2015. Coupled disease–behavior dynamics on complex networks: a review. Phys. Life. Rev. 15, 1–29. ( 10.1016/j.plrev.2015.07.006) [DOI] [PMC free article] [PubMed] [Google Scholar]
- 30.Bauch C, d'Onofrio A, Manfredi P. 2013. Behavioral epidemiology of infectious diseases: an overview. In Modeling the interplay between human behavior and the spread of infectious diseases (eds Manfredi P, D'Onofrio A), pp. 1–19. New York, NY: Springer. [Google Scholar]
- 31.Molina C, Earn DJD. 2015. Game theory of pre-emptive vaccination before bioterrorism or accidental release of smallpox. J. R. Soc. Interface 12, 20141387 ( 10.1098/rsif.2014.1387) [DOI] [PMC free article] [PubMed] [Google Scholar]
- 32.Funk S, Salathe M, Jansen VA. 2010. Modelling the influence of human behaviour on the spread of infectious diseases: a review. J. R. Soc. Interface 7, 1247–1256. ( 10.1098/rsif.2010.0142) [DOI] [PMC free article] [PubMed] [Google Scholar]
- 33.Wang Z, Bauch CT, Bhattacharyya S, d'Onofrio A, Manfredi P, Perc M, Perra N, Salathe M, Zhao D. 2016. Statistical physics of vaccination. Phys. Rep. 664, 1–113. ( 10.1016/j.physrep.2016.10.006) [DOI] [Google Scholar]
- 34.Germann TC, Kadau K, Longini IM, Macken CA. 2006. Mitigation strategies for pandemic influenza in the United States. Proc. Natl. Acad. Sci. USA 103, 5935–5940. ( 10.1073/pnas.0601266103) [DOI] [PMC free article] [PubMed] [Google Scholar]
- 35.Mills CE, Robins JM, Lipsitch M. 2004. Transmissibility of 1918 pandemic influenza. Nature 432, 904–906. ( 10.1038/nature03063) [DOI] [PMC free article] [PubMed] [Google Scholar]
- 36.White LF, Wallinga J, Finelli L, Reed C, Riley S, Lipsitch M, Pagano M. 2009. Estimation of the reproductive number and the serial interval in early phase of the 2009 influenza A/H1N1 pandemic in the USA. Influenza Other Respir Viruses 3, 267–276. ( 10.1111/j.1750-2659.2009.00106.x) [DOI] [PMC free article] [PubMed] [Google Scholar]
- 37.Lessler J, Reich NG, Cummings DA. 2009. Outbreak of 2009 pandemic influenza A (H1N1) at a New York City school. N. Engl. J. Med. 361, 2628–2636. ( 10.1056/NEJMoa0906089) [DOI] [PubMed] [Google Scholar]
- 38.Centers for Disease Control and Prevention (CDC). 2017. Key Facts About Influenza (Flu). https://www.cdc.gov/flu/keyfacts.htm (accessed November 2017). [Google Scholar]
- 39.Riley S. et al. 2003. Transmission dynamics of the etiological agent of SARS in Hong Kong: impact of public health interventions. Science 300, 1961–1966. ( 10.1126/science.1086478) [DOI] [PubMed] [Google Scholar]
- 40.Allen LJ, Brauer F, van den Driessche P, Wu J. 2008. Mathematical epidemiology. Berlin, Germany: Springer. [Google Scholar]
- 41.Keeling MJ, Rohani P. 2008. Modeling infectious diseases in humans and animals. Princeton, NJ: Princeton University Press. [Google Scholar]
- 42.Gao D, Ruan S. 2011. An SIS patch model with variable transmission coefficients. Math. Biosci. 232, 110–115. ( 10.1016/j.mbs.2011.05.001) [DOI] [PubMed] [Google Scholar]
- 43.Wang W, Mulone G. 2003. Threshold of disease transmission in a patch environment. J. Math. Anal. Appl. 285, 321–335. ( 10.1016/S0022-247X(03)00428-1) [DOI] [Google Scholar]
- 44.van den Driessche P, Watmough J. 2002. Reproduction numbers and sub-threshold endemic equilibria for compartmental models of disease transmission. Math. Biosci. 180, 29–48. ( 10.1016/S0025-5564(02)00108-6) [DOI] [PubMed] [Google Scholar]
- 45.Tchuenche JM, Dube N, Bhunu CP, Smith RJ, Bauch CT. 2011. The impact of media coverage on the transmission dynamics of human influenza. BMC Public Health 11, S5 ( 10.1186/1471-2458-11-S1-S5) [DOI] [PMC free article] [PubMed] [Google Scholar]
- 46.Cui J, Tao X, Zhu H. 2008. An SIS infection model incorporating media coverage. Rocky Mount. J. Math. 38, 1323–1334. ( 10.1216/RMJ-2008-38-5-1323) [DOI] [Google Scholar]
- 47.Liu R, Wu J, Zhu H. 2007. Media/psychological impact on multiple outbreaks of emerging infectious diseases. Comput. Math. Methods Med. 8, 153–164. ( 10.1080/17486700701425870) [DOI] [Google Scholar]
- 48.Cui J, Sun Y, Zhu H. 2008. The impact of media on the control of infectious diseases. J. Dyn. Diff. Equ. 20, 31–53. ( 10.1007/s10884-007-9075-0) [DOI] [PMC free article] [PubMed] [Google Scholar]
- 49.Bauch CT. 2005. Imitation dynamics predict vaccinating behaviour. Proc. R. Soc B 272, 1669–1675. ( 10.1098/rspb.2005.3153) [DOI] [PMC free article] [PubMed] [Google Scholar]
- 50.Bauch CT, Bhattacharyya S. 2012. Evolutionary game theory and social learning can determine how vaccine scares unfold. PLoS Comput. Biol. 8, e1002452 ( 10.1371/journal.pcbi.1002452) [DOI] [PMC free article] [PubMed] [Google Scholar]
- 51.Wu J. et al. 2004. Risk factors for SARS among persons without known contact with SARS patients, Beijing, China. Emerging Infect. Dis. 10, 210–216. ( 10.3201/eid1002.030730) [DOI] [PMC free article] [PubMed] [Google Scholar]
- 52.Yu D, Lin Q, Chiu AP, He D. 2017. Effects of reactive social distancing on the 1918 influenza pandemic. PLoS ONE 12, e0180545 ( 10.1371/journal.pone.0180545) [DOI] [PMC free article] [PubMed] [Google Scholar]
- 53.Wang W, Ruan S. 2004. Simulating the SARS outbreak in Beijing with limited data. J. Theor. Biol. 227, 369–379. ( 10.1016/j.jtbi.2003.11.014) [DOI] [PMC free article] [PubMed] [Google Scholar]
- 54.Wallinga J, Teunis P. 2004. Different epidemic curves for severe acute respiratory syndrome reveal similar impacts of control measures. Am. J. Epidemiol. 160, 509–516. ( 10.1093/aje/kwh255) [DOI] [PMC free article] [PubMed] [Google Scholar]
- 55.Bauch CT, Lloyd-Smith JO, Coffee MP, Galvani AP. 2005. Dynamically modeling SARS and other newly emerging respiratory illnesses: past, present, and future. Epidemiology 16, 791–801. ( 10.1097/01.ede.0000181633.80269.4c) [DOI] [PubMed] [Google Scholar]
- 56.Stratton K, Gable A, Shetty P, McCormick M. Institute of Medicine (US) Immunization Safety Review Committee. 2004. Immunization safety review: measles–mumps–rubella vaccine and autism. Washington, DC: The National Academies Press. [PubMed] [Google Scholar]
- 57.Basu S, Chapman GB, Galvani AP. 2008. Integrating epidemiology, psychology, and economics to achieve HPV vaccination targets. Proc. Natl. Acad. Sci. USA 105, 19 018–19 023. ( 10.1073/pnas.0808114105) [DOI] [PMC free article] [PubMed] [Google Scholar]
- 58.Shim E, Chapman GB, Townsend JP, Galvani AP. 2012. The influence of altruism on influenza vaccination decisions. J. R. Soc. Interface 9, 2234–2243. ( 10.1098/rsif.2012.0115) [DOI] [PMC free article] [PubMed] [Google Scholar]
- 59.Mbah ML, Liu J, Bauch CT, Tekel YI, Medlock J, Meyers LA, Galvani AP. 2012. The impact of imitation on vaccination behavior in social contact networks. PLoS Comput. Biol. 8, e1002469 ( 10.1371/journal.pcbi.1002469) [DOI] [PMC free article] [PubMed] [Google Scholar]
- 60.Perisic A, Bauch CT. 2009. Social contact networks and disease eradicability under voluntary vaccination. PLoS Comput. Biol. 5, e1000280 ( 10.1371/journal.pcbi.1000280) [DOI] [PMC free article] [PubMed] [Google Scholar]
- 61.Funk S, Gilad E, Watkins C, Jansen VA. 2009. The spread of awareness and its impact on epidemic outbreaks. Proc. Natl. Acad. Sci. USA 106, 6872–6877. ( 10.1073/pnas.0810762106) [DOI] [PMC free article] [PubMed] [Google Scholar]
- 62.Gross T, D'Lima CJ, Blasius B. 2006. Epidemic dynamics on an adaptive network. Phys. Rev. Lett. 96, 208701 ( 10.1103/PhysRevLett.96.208701) [DOI] [PubMed] [Google Scholar]
- 63.Shaw LB, Schwartz IB. 2008. Fluctuating epidemics on adaptive networks. Phys. Rev. E 77, 066101 ( 10.1103/PhysRevE.77.066101) [DOI] [PubMed] [Google Scholar]
- 64.Reluga TC. 2009. An SIS epidemiology game with two subpopulations. J. Biol. Dyn. 3, 515–531. ( 10.1080/17513750802638399) [DOI] [PubMed] [Google Scholar]
Associated Data
This section collects any data citations, data availability statements, or supplementary materials included in this article.
Supplementary Materials
Data Availability Statement
The 2003 SARS cases time series in Beijing are obtained from Pang et al. [11] and are available from the electronic supplementary material.