Abstract
Sensing of hypoxia and acidosis in arterial chemoreceptors is thought to be mediated through the inhibition of TASK and possibly other (e.g., BKC a) potassium channels which leads to membrane depolarization, voltage‐gated Ca‐entry, and neurosecretion. Here, we investigate the effects of pharmacological inhibitors on TASK channel activity and [Ca2+]i‐signaling in isolated neonatal rat type‐1 cells. PK‐THPP inhibited TASK channel activity in cell attached patches by up to 90% (at 400 nmol/L). A1899 inhibited TASK channel activity by 35% at 400 nmol/L. PK‐THPP, A1899 and Ml 365 all evoked a rapid increase in type‐1 cell [Ca2+]i. These [Ca2+]i responses were abolished in Ca2+‐free solution and greatly attenuated by Ni2+ (2 mM) suggesting that depolarization and voltage‐gated Ca2+‐entry mediated the rise in [Ca2+]i. Doxapram (50 μmol/L), a respiratory stimulant, also inhibited type‐1 cell TASK channel activity and increased [Ca2+]i.. We also tested the effects of combined inhibition of BKC a and TASK channels. TEA (5 mmol/L) slightly increased [Ca2+]i in the presence of PK‐THPP and A1899. Paxilline (300 nM) and iberiotoxin (50 nmol/L) also slightly increased [Ca2+]i in the presence of A1899 but not in the presence of PK‐THPP. In general [Ca2+]i responses to TASK inhibitors, alone or in combination with BKC a inhibitors, were smaller than the [Ca2+]i responses evoked by hypoxia. These data confirm that TASK channel inhibition is capable of evoking membrane depolarization and robust voltage‐gated Ca2+‐entry but suggest that this, even with concomitant inhibition of BKC a channels, may be insufficient to account fully for the [Ca2+]i‐response to hypoxia.
Keywords: Carotid body, Hypoxia, Kcnk3, Kcnk9, Potassium Channels, TASK
Introduction
Peripheral chemoreceptors provide vital information regarding blood gas and pH levels to both respiratory and cardiovascular control centers (de Burgh Daly 1997). The best understood of these organs is the carotid body. This chemoreceptor is able to sense changes in blood oxygen, CO2, and pH within seconds. The carotid body contains specialized sensory cells called type‐1 or glomus cells which respond to hypoxia, hypercapnia or acidosis by generating a depolarizing receptor potential which initiates electrical activity, voltage‐gated calcium entry, and neurosecretion (Buckler 2007; Nurse 2010). This causes excitation of afferent nerves which project to the respiratory and cardiovascular control centers in the brainstem.
How these electrical events in the type‐1 cell are brought about is one of the most fundamental questions in the field. While many ion channels will undoubtedly be involved in shaping the electrical properties of these cells there is intense interest in the nature and roles of those channels that seem to be directly modulated by hypoxia and acidosis. To date, relatively few ion channels have been identified as being oxygen or acid sensitive in these cells. One of these, a background potassium current, is inhibited by both hypoxia and acidosis. This event directly contributes to the initial depolarization (Buckler and Vaughan‐Jones 1994a; Buckler 1997; Buckler et al. 2000). This background K‐current is thought to be mediated by members of the TASK channel family predominantly TASK‐1/TASK‐3 heterodimers with minor contributions from homodimeric TASK‐1 and TASK‐3 channels (Kim et al. 2009; Turner and Buckler 2013). These channels will henceforth be referred to collectively as TASK channels. Other hypoxia and acid sensitive currents have also been described in type‐1 cells including a delayed rectifier K –channel (Lopez Barneo et al. 1988; Lopez Lopez et al. 1989; Ganfornina and Lopez Barneo 1992) in rabbit type‐1 cells and a large conductance Ca‐activated potassium channel (BKCa) in rat type‐1 cells (Peers 1990a; Wyatt and Peers 1995). The role of these channels is less clear cut with some authors suggesting that inhibition of maxi‐K channels may contribute to initial membrane depolarization whereas others find that inhibitors of these channels often have no effect upon resting membrane potential, or [Ca2+]i (Buckler 1997; Pardal et al. 2000; Dallas et al. 2009; Wang and Kim 2017). An alternative perspective is that these channels may act as a brake on cellular excitability for example by limiting membrane depolarization and/or action potential frequency/duration, which can be released in the presence of chemostimuli (Gomez‐Nino et al. 2009).
Our current basic model of chemotransduction is therefore as follows (1) TASK channel inhibition by hypoxia/acidosis initiates depolarization; (2) depolarization activates voltage‐gated calcium channels; (3) rise in [Ca2+]i activates a calcium‐dependent cation current which reinforces membrane depolarization; (4) depolarization and rise in [Ca2+]i leads to activation of Kv and BKCa channels which oppose depolarization/electrical activity; (5) Kv and/or BKCa channel activity is moderated by hypoxia/acidosis (depending on species)(Buckler 2015). Thus, chemostimuli may be considered to exert control over type‐1 cell excitability and calcium signaling at two points – initiation of excitation and a negative feed‐back loop limiting excitation. This might be considered equivalent to controlling the threshold and gain of this sensor.
The objectives of this study were first to confirm the identity of the background channels using selective inhibitors. Second, to establish whether pharmacological inhibition of TASK can increase [Ca2+]i. The above model of cell excitation in hypoxia predicts that this be true. Third, to determine whether responses to selective TASK channel inhibition can be enhanced by concomitant inhibition of BKCa (and Kv) channels (another prediction of the above model of cell excitation by hypoxia). And finally to determine whether concomitant inhibition of both TASK and BKCa can replicate the effects of hypoxia, that is, is the above model sufficient to explain the excitatory response to chemostimuli.
This study successfully confirmed the identity of the background K‐channels as being TASK channels. We demonstrate that pharmacological inhibition of TASK (A1899, PK‐THPP, ML365, and Doxapram) does indeed lead to voltage‐gated calcium entry and increase in [Ca2+]i. These data confirm the pivotal role that TASK channels play in peripheral chemoreceptor excitation. Concomitant inhibition of BKCa at the same time as TASK inhibition slightly augmented [Ca2+]i supporting the idea that BKCa inhibition can in principle enhance excitatory responses initiated by TASK channel inhibition but suggesting that this effect may be rather minor. We also observed that TASK channel inhibition with or without concomitant inhibition of BKCa cannot fully replicate the effects of hypoxia. Collectively these data support key elements of the model outlined above but suggest that it is as yet incomplete.
Methods
Carotid body type‐1 cell isolation
Carotid artery bifurcations were dissected from neonatal (P11‐21) Sprague‐Dawley rats (Harlan, Blackthorn, Oxfordshire, UK) under terminal isoflurane anesthesia (4% in oxygen) and placed in ice‐cold phosphate‐buffered saline. Animals were then killed by decapitation or exsanguination while still deeply anesthetized. This procedure was performed in accordance with project and personal licence authorities issued under the UK Animals (Scientific Procedures) Act, 1986. Microdissection of the carotid body was then carried out ex vivo. Carotid bodies were transferred to an enzyme media containing trypsin 0.4 mg/mL (Sigma, Dorset, UK) and collagenase 0.6 mg/mL (Worthington) dissolved in Ham's F12. Tissue was incubated in this media for 25–30 min. The carotid bodies were then washed in culture media comprising either Ham's F12, or a 1:1 mixture of Ham's F12 and DMEM, which were supplemented with 10% fetal bovine serum, glutamine (2 mmol/L), insulin (8 μg/mL), penicillin (100 units/mL), and streptomycin (100 μg/mL) (supplied by Sigma or Thermo‐Fischer scientific). The carotid bodies were then transferred to a small volume of the above culture media supplemented with trypsin inhibitor (0.5 mg/mL: Sigma) and triturated for 3–5 min with fire polished glass pipettes. The resultant cell suspension was then plated out on to 6 mm diameter glass coverslips precoated with poly‐d‐lysine. The cells were left in the incubator to adhere to the coverslips, which were contained within a plastic culture dish, for 2 h before further culture media was added to the dish. Cells were maintained in this media for 0–6 h before further use.
HEK cell culture and expression of TASK channels
Rat‐TASK‐1 and Rat‐TASK‐3 were cloned into the pIRES‐EGFP plasmid (Clontech/Takara Bio, CA, USA). Human Embryo Kidney cells (HEK‐293; Sigma (Dorset, UK, European Collection of Cell Culture Lot 13F007 P65) were cultured in MEM supplemented with 10% fetal bovine serum (both Gibco, Paisley, UK), 2 mmol/L l‐glutamine (Sigma, Dorset, UK); 100 U/mL penicillin, and 100 μl/mL streptomycin (Fisher Scientific). Cells were passaged every 3 days. On the day prior to transfection ~6 × 10⁵ HEK cells were plated in a well of a six‐well plate with 3 mL which resulted in 70–90% confluency on the day of transfection. Transfection was performed using 800–2500 ng DNA, opti‐MEM, plus‐reagent and lipofectamine (Life Technologies) in accord with the manufacturer's instructions. 24–48 h post transfection, cells were harvested and plated onto poly‐L‐lysine coated glass coverslips and ~2 h after plating, the cells were used for recordings.
Calcium measurement
Prior to calcium measurements Indo‐1 AM was added to the culture media in the dishes containing isolated type‐1 cells to a final concentration of 2.5 μg/mL. In some instances rhodamine‐conjugated peanut agglutinin 2 μg/mL (Vector laboratories, Burlingame, CA) was also added to this media to facilitate Type‐1 cell identification. Cells were incubated in this media at room temperature and in the presence of 5% CO2 for a further hour before use.
Following Indo‐1 loading, cells were transferred to a rapid perfusion bath mounted on the stage of an inverted microscope (Nikon Diaphot, Kingston, Surrey, UK) and observed through a 40x oil‐immersion objective. For this study, we used either isolated single cells or small clusters of 2–5 Type‐1 cells. Indo1 fluorescence was excited at a wavelength of 340 nm by filtered light from a xenon arc lamp. Emitted fluorescence was then measured at 405 nm and 495 nm using a dichroic mirror (450 nm), bandpass filters with a 20 nm bandwidth and cooled trialkali photomultiplier tubes (Thorn EMI, London, England, UK). The output from the photomultipliers was recorded using a CED 1401 and Spike2 software (Cambridge Electronic Design, Cambridge, UK). Signals were averaged over 0.5 sec intervals to give a sampling rate of 2 Hz. Intracellular calcium concentration ([Ca2+]i) was estimated from the ratio of recorded fluorescence 405/495 and the equation (Grynkiewicz et al. 1985):
Where R is the measured ratio, K d is the dissociation constant for indo‐1 and Ca2+ binding (assumed to be 250 nmol/L), F/B is the ratio of the fluorescence of free and bound forms of indo‐1 at 495 nmol/L, R min is the fluorescence 405/495 ratio at nominally zero Ca2+ and R max the 405/495 ratio of fluorescence at saturating calcium ion concentration. These two latter constants were empirically determined in separate group of cells rendered calcium permeant with 5 μmol/L ionomycin in the presence of 10 mmol/L EGTA in a HEPES‐buffered (pH 7.4) high K+ (140 mmol/L KCl) saline (0 mmol/L Ca2+) to determine Rmin and then transferred to 10 mmol/L CaCl2 (also in a HEPES‐buffered high K+ saline) to determine Rmax.
Unless otherwise stated, calcium measurements are presented either as an absolute mean value of [Ca2+]i measured over a >= 40 sec interval or as the difference between two such measurements as a Δ[Ca2+]i (e.g., the difference between [Ca2+]i measured over a control interval and during the application of a drug).
Electrophysiology: native glomus cells and HEK293 cells
Cell‐attached patch clamp recordings were performed on glomus cells (isolated as described above), or HEK 293 cells (transfected with TASK1 or TASK3), using an Axopatch 200B (Molecular Devices LLC, Sunnyvale, US). Borosilicate pipettes (Harvard Apparatus Ltd, Kent, UK) were sylgard‐coated, fire‐polished and filled with a solution containing (in mM) 140 KCl, 1 MgCl2, 1 EGTA, 10 HEPES, 10 tetraethylammonium (TEA), and 5 4‐aminopyridine. The pH of this solution was adjusted to 7.4 at 37°C using KOH.
Cells were initially placed in the recording chamber and superfused with standard Tyrode. Patching, and seal formation was performed in this solution. Once a satisfactory cell attached patch and gigaohm seal had been formed the standard Tyrode was replaced with a Tyrode solution containing 100 mmol/L K+ (in which the Na+ concentration had been reduced by 95.5 mmol/L to maintain constant osmolality but was otherwise identical to the standard Tyrode). A pipette potential of +80 mV was then applied and recording of channel activity commenced. Membrane current was recorded at 20 kHz and filtered at 2–5 kHz prior to analysis. Voltage clamp control, data acquisition and analysis were performed using Spike2 (Cambridge Electronic Design, Cambridge, UK). The main conductance state for channel activity was established from an all‐points histogram. Most all‐points histograms showed one main peak at approximately 2.1 nA. The threshold for quantifying nPopen was set at 75% of this value (approximately 1.5 nA), so as to best capture TASK‐1/3 heterodimer channel activity. Current levels that exceeded 175% and 275% of the main conductance state were counted as double or triple openings, respectively.
Solutions and cell superfusion
Cells transferred to the experimental chamber/bath were initially superfused with warm (36–37°C) Tyrode of the following composition in mM: 117 NaCl, 4.5 KCl, 1 MgCl2, 23 NaHCO3, 11 glucose, this solution was pre‐equilibrated (by bubbling) with 5% CO2 in air; pH 7.4. Solutions were delivered to this chamber by gravity from stoppered glass bottles maintained in a water bath at 37°C via two stainless steel perfusion lines and a two way tap placed in close proximity to the chamber. This allowed one perfusion line to run into the chamber and the other to be diverted to waste. Switching between lines could then be effected via the tap. Chamber volume was approx. 100 μl and the perfusion rate approx. 4 mL/min. Temperature was maintained at 36–37°C using an additional heating element either between the tap and the bath or immediately upstream of the tap.
At the beginning of most calcium recordings cells were initially exposed to a hypoxic Tyrode for about 1 min. Hypoxic Tyrode had the same composition as the standard Tyrode but was equilibrated/bubbled with 5% CO2/95% N2. During a 1‐min exposure to this solution chamber PO2 typically reaches a nadir of about 2 mmHg (as measured with a 50 μm optical oxygen sensor: PreSens, Regensburg, Germany). Brief exposure to this stimulus evokes a rapid and robust rise in [Ca2+]i (a calcium “transient”) which serves to confirm the identity and oxygen sensitivity of the cell/s about to be studied.
Drugs were added to solution immediately prior to use from concentrated stocks in DMSO or water as appropriate. The drugs used in this study included: A1899 and PK‐THPP (Aberjona Laboratories Boston, MA, USA); ML365 (Tocris); paxilline and iberiotoxin (Cayman Chemicals, Ann Arbor, USA); TEA (Sigma); Doxapram (Abcam, Cambridge, UK).
Statistical analysis
N values refer to independent recordings from a different cell/s on different coverslips. Generally, where paired data were compared, Student's t test was used, unless unequal variance was demonstrated, in which case Wilcoxon Signed‐rank was used. In concentration response curves correlation of concentration and response was analyzed using Spearman's Rho or by a one‐way repeated measures ANOVA. The research materials supporting this publication can be accessed by contacting Dr K. J. Buckler.
Results
Confirming action of PK‐THPP and A1899 on TASK‐3 and TASK‐1 channels, respectively
We first confirmed that PK‐THPP and A1899, reported to be moderately selective inhibitors of TASK‐3 and TASK‐1, respectively (Streit et al. 2011; Coburn et al. 2012; Kiper et al. 2015), did indeed inhibit these channels when expressed in HEK 293 cells and studied using cell attached single‐channel recording techniques, that is, under the same conditions as those to be employed in studying type‐1 cells. Expression of either channel resulted in an abundance of channel activity with multiple channels frequently present in each cell attached patch (see Figs. 1, 2). Upon application of PK‐THPP (400 nmol/L), to TASK‐3 expressing cells, or A1899 (400 nmol/L) to TASK‐1 expressing cells there was a marked reduction in channel activity with residual channel openings becoming more clearly resolved (Figs. 1, 2). PK‐THPP inhibited TASK‐3 channel activity by 85.1 ± 2.6% (n = 3; P < 0.001). A1899 inhibited TASK‐1 channel activity by 63.4 ± 7.7% (n = 4, P = 0.045).
Figure 1.
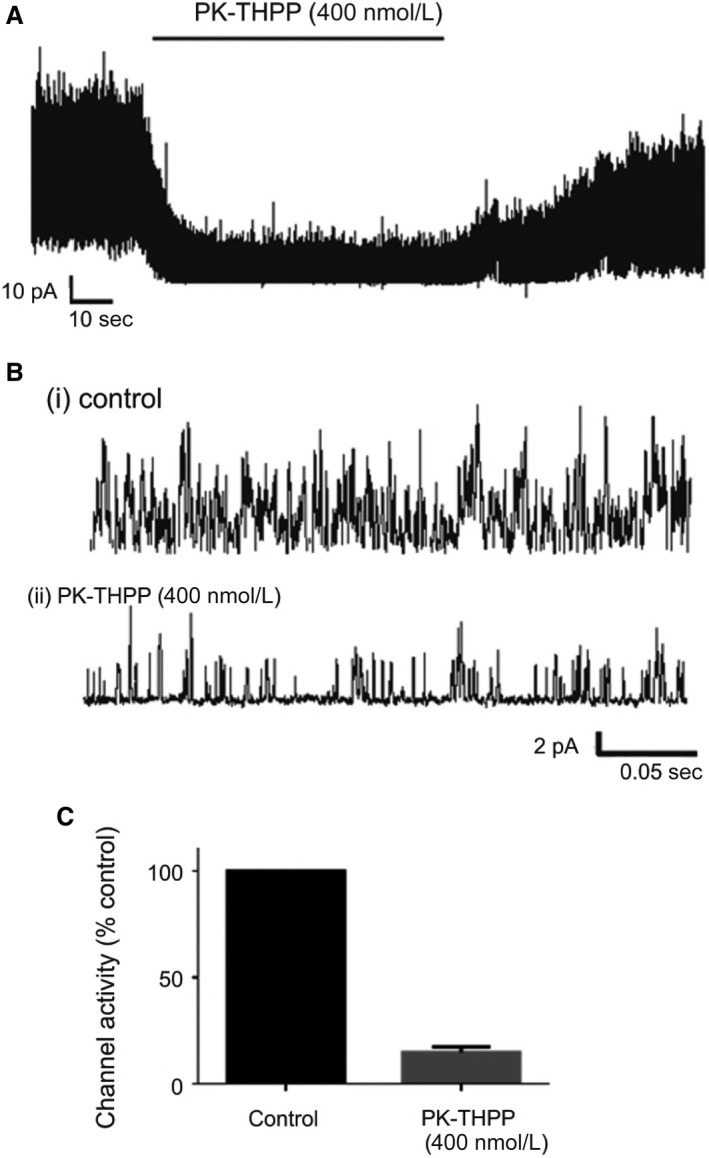
(A) Representative recording of channel activity of TASK‐3, expressed in a HEK 293 cell, over ~2 min in a cell attached patch recording. Note marked inhibition of channel activity by 400 nmol/L PK‐THPP. (B) Data from the same recording over ~0.3 sec under control conditions (i) and in the presence of 400 nmol/L PK‐THPP (ii). (C) Bar chart comparing effects of 400 nmol/L PK‐THPP on single‐channel activity (nPopen) relative to control (n = 3, P < 0.001). Values are means ± SEM.
Figure 2.
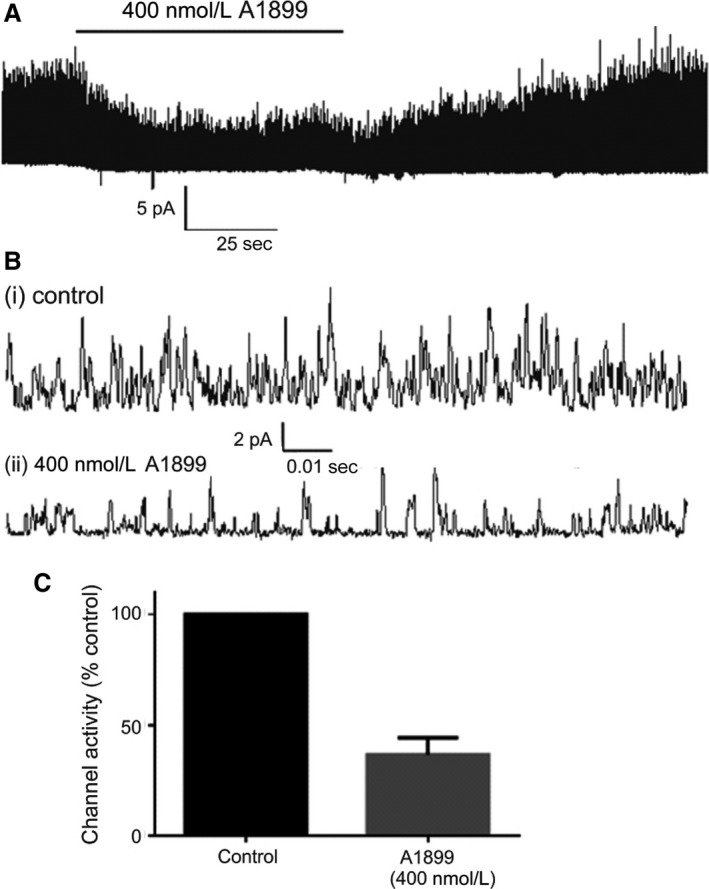
(A) Representative cell‐attached patch recording of channel activity for TASK‐1, expressed in a HEK 293 cell, over a ~3 min period demonstrating inhibition by 400 nmol/L A1899. (B) Data from same recording over ~0.1 sec intervals under control conditions (i) and in the presence of 400 nmol/L A1899 (ii). (C) Bar chart comparing effects of 400 nmol/L A1899 on single‐channel activity (nPopen) relative to control (n = 4, P = 0.045). Values are means ± SEM.
Effect of PK‐THPP and A1899 on TASK channel activity in native glomus cells
PK‐THPP
The effects of PK‐THPP on TASK channel activity in type‐1 cells was studied over a range of concentrations from 40 to 400 nmol/L. Figure 3A and B show representative traces of channel activity in a cell attached patch from a type‐1 cell. Application of 400 nmol/L PK‐THPP caused a rapid and profound inhibition of native TASK channel activity by 89 ± 3% (n = 10; P = 0.034). Figure 3C shows the concentration dependence of PK‐THPP mediated type‐1 cell TASK channel inhibition which indicated a Ki of ~66 nmol/L. All‐points histograms revealed that PK‐THPP caused a reduction in channel activity across all conductance levels (Fig. 3D).
Figure 3.
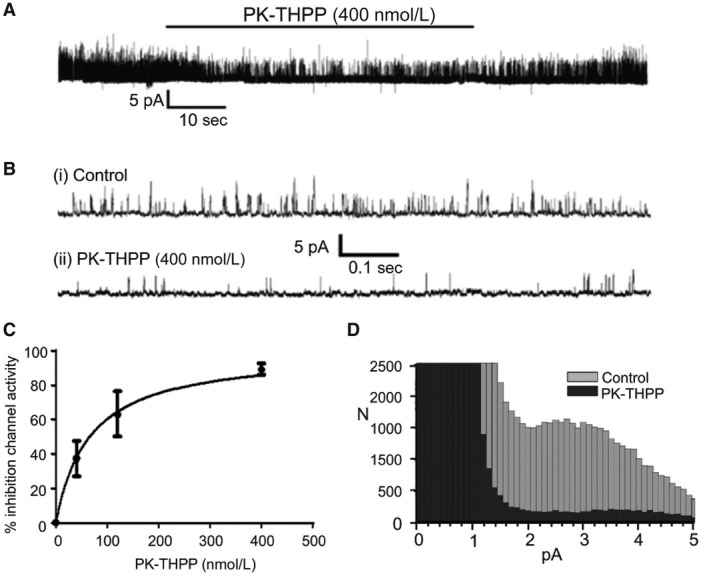
(A) Representative recording of type‐1 cell TASK channel activity over ~1.5 min in a cell‐attached patch showing inhibition of channel activity by 400 nmol/L PK‐THPP. (B) Data from same recording over ~1 sec intervals under control conditions (i) and in the presence of PK‐THPP. (C) Concentration‐response relationship of effects of PK‐THPP on rat type‐1 cell TASK channel activity (nPopen values in the presence of PK‐THPP expressed as % inhibition of control nPopen values). Data are mean ± SEM; n = 5 for 40 nm and 120 nmol/L PK‐THPP and n = 10 for 400 nmol/L PK‐THPP. Data were fit to a single‐site ligand binding model with r 2 0.997, BM ax 100 and Kd 66 ± 10 nmol/L. (D) Representative all‐points frequency histogram showing profound reduction in current at all levels corresponding to channel open states. Each bar represents a 0.1 pA bin width. Data from analysis of 20 sec segments of cell‐attached recordings.
A1899
We studied the effects of A1899 over a range of concentrations from 50 to 4000 nmol/L. In cell attached patches in type‐1 cells 400 nmol/L A1899 caused a rapid and reversible inhibition of TASK channel activity by 34 ± 7% (n = 8; P = 0.028; Fig. 4A and B). A similar level of inhibition was also seen at a lower concentration of 50 nmol/L and a substantive further increase in inhibition at 4000 nmol/L to over 60% (see Fig. 4C). We did not observe saturation of the response to A1899 with the range of concentrations tested so have not attempted to define a Ki. Figure 4D presents a representative all‐points histogram which shows that at 400 nmol/L A1899 causes an inhibition of TASK channel activity across all conductance levels.
Figure 4.
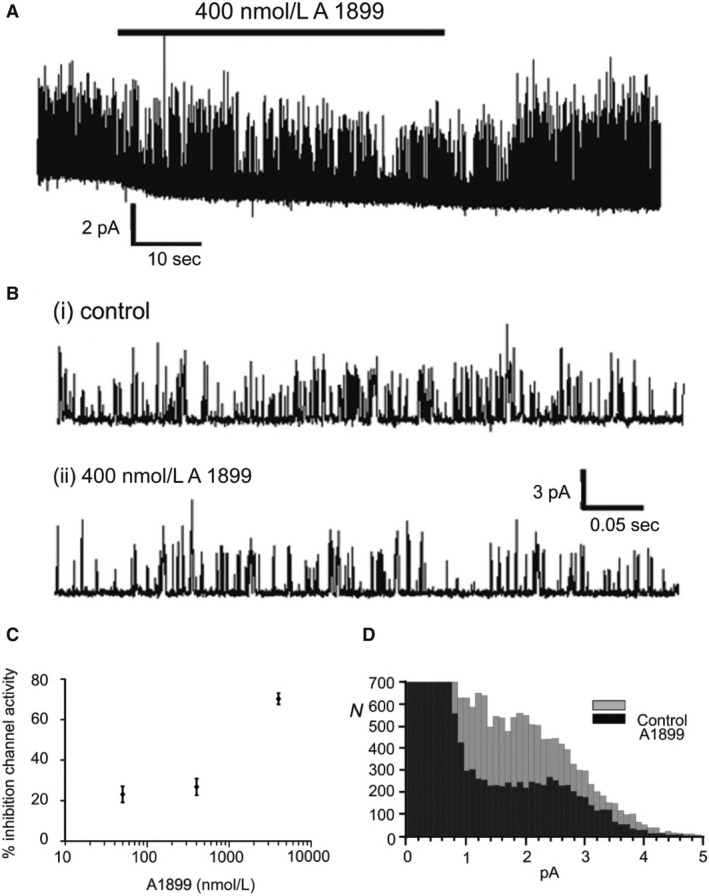
(A) Representative recording of type‐1 cell TASK channel activity over ~1.5 min of a cell‐attached patch recording demonstrating inhibition of channel activity by 400 nmol/L A1899. (B) Data from same recording over ~0.5 sec intervals under control conditions (i) and in the presence of A1899 (ii). (C) Concentration‐response relationship of effects of A1899 on type‐1 cell TASK channel activity (expressed as % inhibition in the presence of A1899 compared to control). Data are mean ± SEM (n = 4, 8 and 6 for 40, 400 and 4000 nmol/L concentrations of A1899, respectively). (D) Representative all‐points frequency histogram showing reduction of current at all levels corresponding to channel open states. Each bar represents a 0.1 pA bin width. Data were generated from analysis of 20 sec segments from cell‐attached recordings.
Effects of TASK channel inhibitors on Type‐1 cell [Ca2+]i signalling
Having established that inhibitors of heterologously expressed homomeric TASK1 and TASK3 were also effective inhibitors of the endogenous TASK channels in type‐1 cells, which are predominantly TASK1‐TASK3 heterodimers, we next sought to determine whether they were effective stimulants of the carotid body as would be predicted. To study type‐1 cell excitation we employed measurements of calcium signaling which have been widely applied in the past to study both oxygen and acid sensing.
PK‐THPP
Figure 5A shows that application of PK‐THPP evoked a rapid increase in glomus cell [Ca2+]i in a manner similar to that of hypoxia. Hypoxia alone causes a rapid rise in [Ca2+]i to a peak value followed by a modest decline. Some spontaneous spikes in the [Ca2+]i trace were also evident in some type‐1 cells. PK‐THPP also elicited a rapid initial increase in [Ca2+]i often followed by repetitive [Ca2+]i “spiking,” the spikes almost returning to baseline in some cells. [Ca2+]i responses to PK‐THPP were often slow to reverse following PK‐THPP removal taking minutes for [Ca2+]i to return to baseline (see e.g., Fig. 5C). In assessing the concentration dependence of the effects of PK‐THPP on [Ca2+]i we used the magnitude of the largest (which was always the first) spike in calculating the “response” to each level of PK‐THPP applied across a range of concentrations from 12 to 1200 nmol/L. The concentration – [Ca2+]i response relationship was nonlinear (Fig. 5B) and appeared to show saturation at higher levels of PK‐THPP with an estimated EC50 of 45 nmol/L. There was a significant correlation between the concentration of PK‐THPP and [Ca2+]i (Spearman's Rho = 0.359, P = 0.034).
Figure 5.
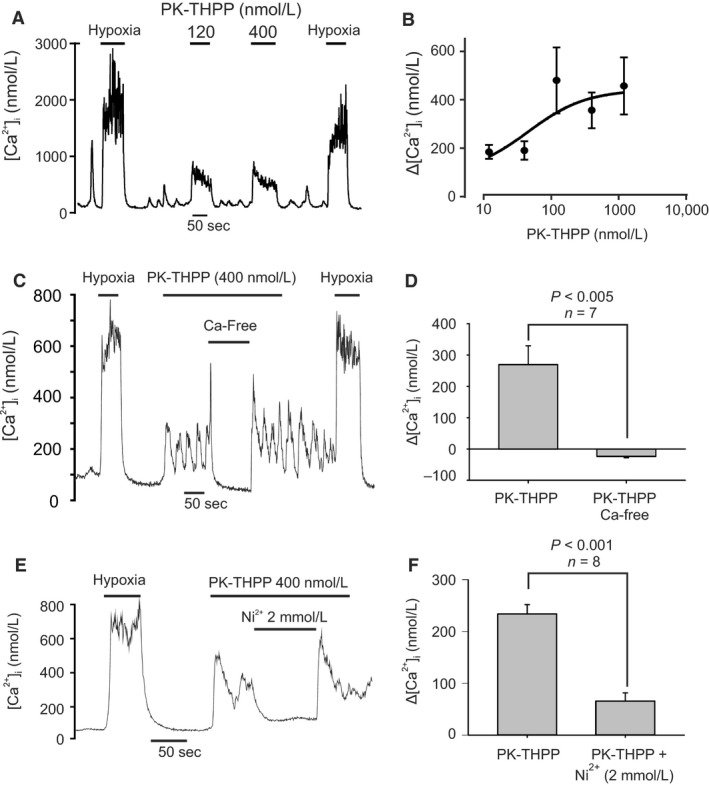
Effects of PK‐THPP on type‐1 cell [Ca2+]i. (A) Recording showing effects of application of two different concentrations (120 and 400 nmol/L) of PK‐THPP causing an abrupt rise in [Ca2+]i. (B) Concentration‐response graph of effects of PK‐THPP on [Ca2+]i. Each point represents mean ± SEM (n = 5–7) and the curve is fit by non‐linear least squares regression to the equation Δ[Ca2+]i = a + b. [PK‐THPP]/(EC50 + [PK‐THPP]). The estimated EC50 is 45.2 nmol/L and the r 2 for correlation is 0.19. (C) Effect of Ca2+ free Tyrode on [Ca2+]i responses evoked by 400 nmol/L PK‐THPP. Note rapid reduction in [Ca2+]i in the absence of external Ca2+. (D) Summary data showing effects of PK‐THPP on Δ[Ca2+]i ([Ca2+]i in the presence of PK‐THPP minus baseline [Ca2+]i) under normal conditions and in the absence of extracellular Ca2+. Data are mean ± SEM. Statistical comparison is a paired t test. (E) Effect of 2 mmol/L Ni2+, a voltage‐gated Ca2+‐channel inhibitor, on [Ca2+]i responses evoked by 400 nmol/L PK‐THPP. Note rapid reduction in [Ca2+]i upon application of Ni2+. (F) Summary data showing effects of PK‐THPP on Δ[Ca2+]i under normal conditions and in the presence of Ni2+. Data are mean ± SEM. Statistical comparison is a paired t test.
PK‐THPP evoked changes in [Ca2+]i were abolished in Ca2+‐free solution containing 100 μmol/L EGTA (Fig. 1C and D), confirming that the effects of PK‐THPP were due to influx of external Ca2+. The PK‐THPP induced rise in [Ca2+]i was also reversed by the voltage‐gated Ca2+‐channel inhibitor Ni2+ (2 mmol/L, see Fig. 5E and F) indicating that membrane depolarization and voltage‐gated Ca2+‐entry was the most likely cause of the PK‐THPP induced rise in [Ca2+]i.
A1899
Figure 6A shows the effects of A1899 to be very similar to that of PK‐THPP, that is, application of A1899 led to a rapid rise in [Ca2+]i which often returned towards base line followed by a succession of similar [Ca2+]i spikes which continued until the drug was withdrawn. Unlike PK‐THPP [Ca2+]i responses to A1899 were almost always rapidly reversed/ablated upon drug withdrawal. There was a positive correlation between A1899 concentration and [Ca2+]i response (Spearman's Rho = 0.651, P < 0.001) which was also nonlinear such that at the lower doses (<24 nmol/L) there was minimal rise in [Ca2+]i evoked by A1899 but a concentration‐dependent increase in [Ca2+]i at higher concentrations with the response appearing to saturate at concentrations of 400 nmol/L and above).
Figure 6.
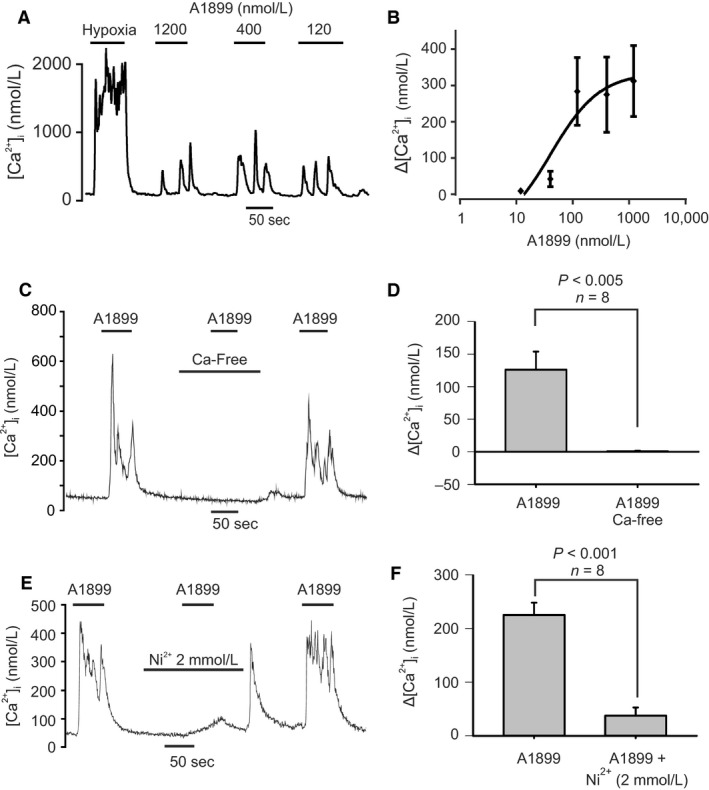
Effects of A1899 on type‐1 cell [Ca2+]i. (A) Effects of application of three different concentrations (120, 400 and 1200 nmol/L) of A1899 demonstrating an abrupt, spiking, rise in [Ca2+]i. (B) Concentration‐response graph of effects of A1899 on [Ca2+]i. Each point represents mean ± SEM. The curve is fit by non‐linear least squares regression to the equation Δ[Ca2+]i = a + b. [A1899]/(EC50 + [A1899]). The estimated EC50 is 40.8 nmol/L and the r 2 for correlation is 0.23. (C) Effect of Ca2+ free Tyrode on [Ca2+]i responses evoked by 400 nmol/L A1899. Note absence of any [Ca2+]i response to A1899 when applied in Ca2+ free Tyrode. (D) Summary data showing effects of A1899 on Δ[Ca2+]i ([Ca2+]i in the presence of A1899 minus baseline [Ca2+]i) under normal conditions and in the absence of extracellular Ca2+.Statistical comparison is a paired t test. (E) Effect of 2 mmol/L Ni2+, a voltage‐gated Ca2+‐channel inhibitor, on [Ca2+]i responses evoked by 400 nmol/L A1899. Note much smaller and slower rise in [Ca2+]i when A1899 is applied in the presence of Ni2+. (F) Summary data showing effects of A1899 on Δ[Ca2+]i under normal conditions and in the presence of Ni2+. Data are mean ± SEM. Statistical comparison is a paired t test.
As with PK‐THPP, the increase in [Ca2+]i evoked by A1899 was abolished when cells were superfused in a Ca2+‐free EGTA solution (Fig. 6C and D) and inhibited substantially in the presence of 2 mmol/L Ni2+ (Fig. 6E and F). These observations again indicating that membrane depolarization and voltage‐gated Ca2+‐entry was the most likely cause of the A1899 induced rise in [Ca2+]i.
ML365
Recently another compound, ML365, has been described as an inhibitor of TASK‐1 and TASK‐3 with 60‐fold selectivity for TASK‐1 over TASK‐3 (EC50's 16 nmol/L and 1 μmol/L, respectively, (Flaherty et al. 2014)). Although we have not yet tested this compound on channel activity in the type‐1 cell it seems reasonable to assume that as the identity of these channels is now confirmed other inhibitors of TASK‐1 and TASK‐3 should also function as stimulants of the type‐1 cell. Consequently, we tested the effects of ML365 over a range of concentrations (from 4 nmol/L to 4000 nmol/L). For these experiments the [Ca2+]i response was averaged over approx. 40–50 sec of exposure to the drug. ML365 caused a significant and dose‐dependent increase in [Ca2+]i (P < 0.001 Friedman repeated measures ANOVA on ranks) see Figure 7. The [Ca2+]i response to ML365 did not appear to saturate over the range of concentrations tested. Varying degrees of spiking in the [Ca2+]i trace were observed at different concentrations of ML365. Responses to ML365, where present, were rapid in onset and rapidly reversible upon drug removal.
Figure 7.
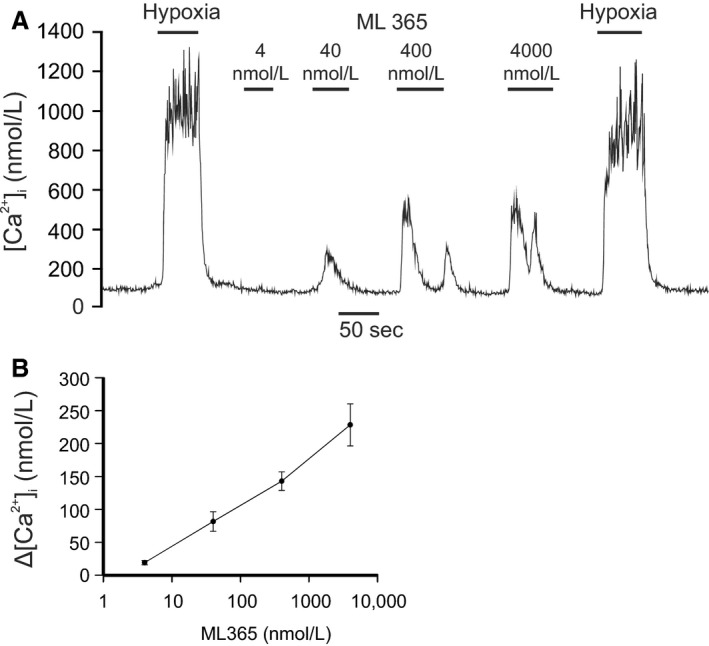
Effects of ML365 on type‐1 cell [Ca2+]i. (A) Representative trace showing effects of application of four different concentrations (4, 40, 400, and 4000 nmol/L) of ML365 demonstrating an abrupt rise in [Ca2+]I in response to this TASK‐1 channel inhibitor. (B) Concentration‐response graph of effects of A1899 on [Ca2+]i. Each point represents mean ± SEM (n = 8).
Doxapram, an established respiratory stimulant, also inhibits type‐1 cell TASK channels and evokes increase in cytosolic calcium
Doxapram is a widely used respiratory stimulant that is also reported to inhibit cloned TASK channels (Cotten et al. 2006). It is consequently thought likely that doxapram exerts some of its effects by inhibiting native TASK channels in the type‐1 cell and thus exciting the type‐1 cell. In view of the results obtained above with other TASK channel inhibitors we next sought to investigate the effects of doxapram on type‐1 cells. Figure 8 demonstrates that at high (50 μmol/L) levels doxapram does indeed inhibit type‐1 cell TASK channel activity rapidly and reversibly by 42.3 ± 4.6% (n = 7, P = 0.018, Fig. 8C). This effect was observed across all conductance levels (Fig. 8D). 50 μmol/L doxapram also caused a rapid and reversible increase in [Ca2+]i (Fig. 9).
Figure 8.
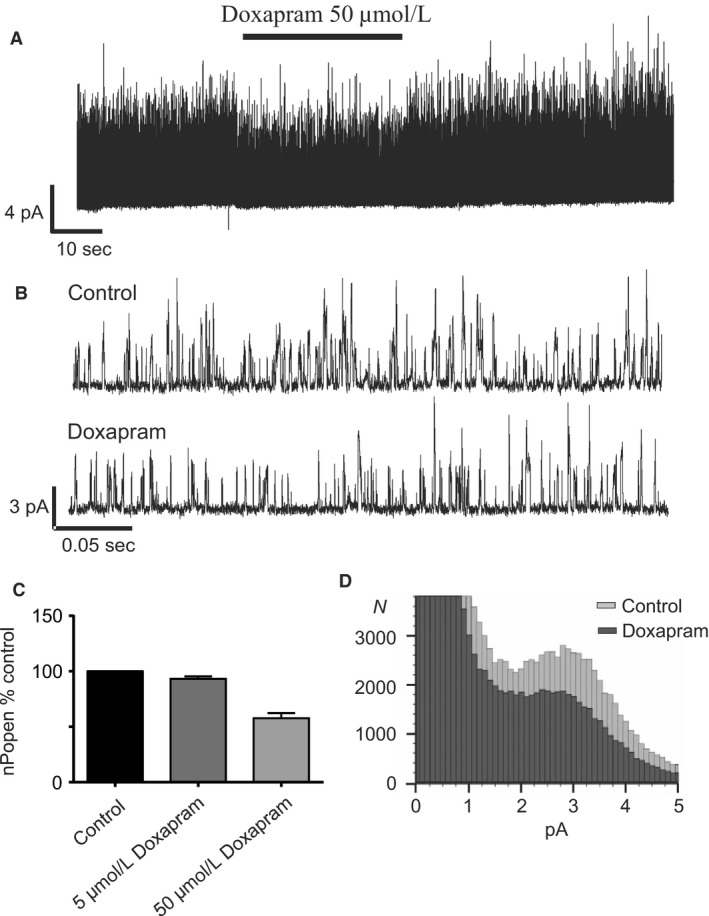
(A) Representative trace of Type‐1 cell TASK channel activity in a cell attached patch over ~1.5 min of recording, demonstrating reduction in activity by Doxapram. (B) Data from same recording over ~0.4 sec intervals under control conditions (i) and in the presence of doxapram (ii). (C) Concentration‐response relationship of doxapram on Type‐1 cell TASK channel activity. nPopen is plotted as % of that observed under control conditions. Doxapram was applied at 5 μmol/L (n = 3) and 50 μmol/L (n = 7). (D) Representative all‐points frequency histogram showing doxapram decreased all current levels corresponding to open channel activity (each bar represents a 0.1 pA bin width, data generated from 20 sec segments of cell‐attached recordings).
Figure 9.
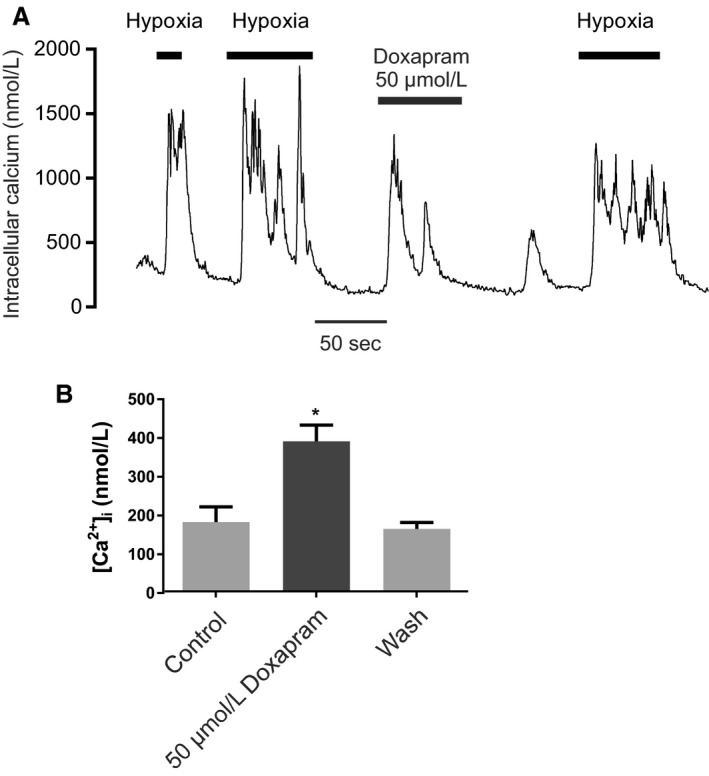
(A) Representative trace of the effect doxapram on glomus cell [Ca2+]i. (B) Summary of quantitative effect of doxapram on glomus cell [Ca2+]i. data are mean ± SEM n = 8, P < 0.001 (doxapram vs. control, paired t test).
Interaction of TASK channel inhibitors with BKCa and delayed rectifier K‐channel inhibitors
Although TASK channels appear to contribute to the majority of background K‐channel activity around the resting potential they may not be the only channels directly involved in mediating the cellular response to hypoxia. A number of other potassium channels have been reported to also be oxygen sensitive in type‐1 cells, and although not particularly active at resting membrane potentials it is thought that they become active as the cell depolarizes and/or as intracellular calcium rises (Wang and Kim 2017). Thus, the hypoxic modulation of these channels may contribute to the overall [Ca2+]i ‐response to hypoxia even though they cannot initiate that response (see discussion). In the rat type‐1 cell the only other oxygen‐sensitive K‐channel thus far reported is the large conductance calcium activated K channel (BKCa) (Peers 1990a). We noted in our study of TASK channel inhibitors that whilst all were capable raising [Ca2+]i in type‐1 cells rarely did that effect match or exceed the [Ca2+]i response to hypoxia. This suggests that hypoxic modulation of other channels might also be needed in order to generate a full response (see discussion). We therefore thought to test the hypothesis that inhibition of BKCa and/or delayed rectifier K+ channels could augment [Ca2+]i response to TASK inhibition. In this study, we used both A1899, a relatively mild inhibitor of type‐1 cell TASK channel activity (at 400 nmol/L, see Fig. 4C), as well as PK‐THPP a stronger inhibitor of type‐1 cell TASK (also at 400 nmol/L see Fig. 3C). As A1899 is rapidly reversible, BKCa channel inhibitors were added coincidently with the application of A1899. For PK‐THPP we allowed the response to PK‐THPP to stabilize first before adding the BKCa inhibitor in the continued presence of PK‐THPP (see Figs. 10, 11, 12). The drugs tested were TEA (5 mmol/L) a nonselective inhibitor of delayed rectifier K‐channels and BKCa in type‐1 cells, paxilline a selective BKCa inhibitor (Knaus et al. 1994; Sanchez and McManus 1996) and iberiotoxin also a selective inhibitor of BKCa (Candia et al. 1992). To quantify the effects of these drugs we measured average [Ca2+]i responses which were defined as the increase in [Ca2+]i during periods in which the cell was exposed to K‐channel inhibitors relative to base line [Ca2+]i prior to the application of potassium channel inhibitors. For studies using PK‐THPP this was applied first for at least 50 sec followed by co‐application of a BKCa‐channel inhibitor for >= 50 sec and then removal of BKCa channel inhibitor (see e.g., Fig. 10A). In this protocol, the control response to PK‐THPP alone was determined over a 50 sec period during application of PK‐THPP but before application of BKCa inhibitor. The response to PK‐THPP plus BKCa inhibitor was then determined over a 50 sec time period in which both drugs were present. For studies using A1899 this drug was applied on its own first and then in combination with a BKCa channel inhibitor (test). Each application of drug lasted >= 50 sec and was followed by a return to baseline conditions (see e.g., Fig. 10B).
Figure 10.
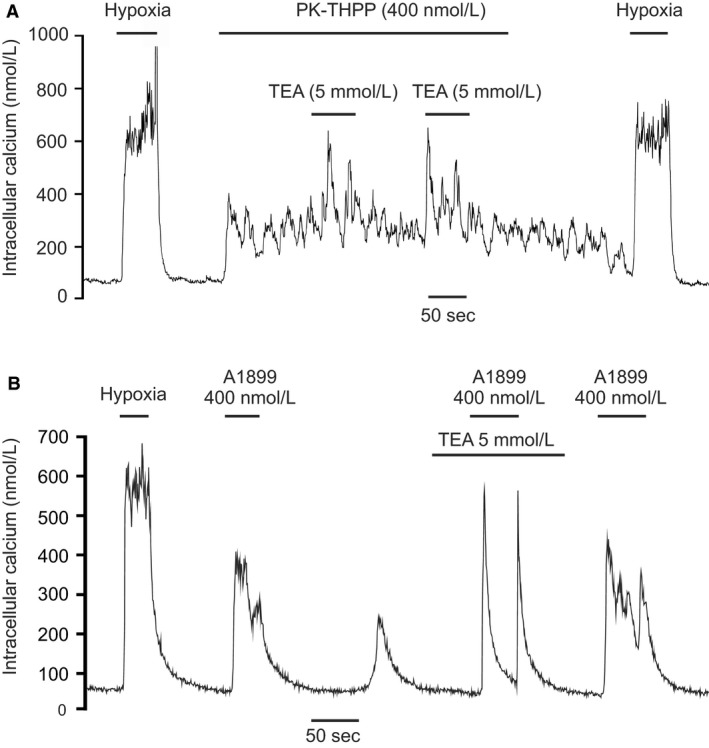
Effects of 5 mmol/L TEA on the [Ca2+]i response to TASK channel inhibitors. (A) TEA + 400 nmol/L PK‐THPP. (B) TEA + 400 nmol/L A1899. Note increase in size of [Ca2+]i spikes in the presence of TEA.
Figure 11.
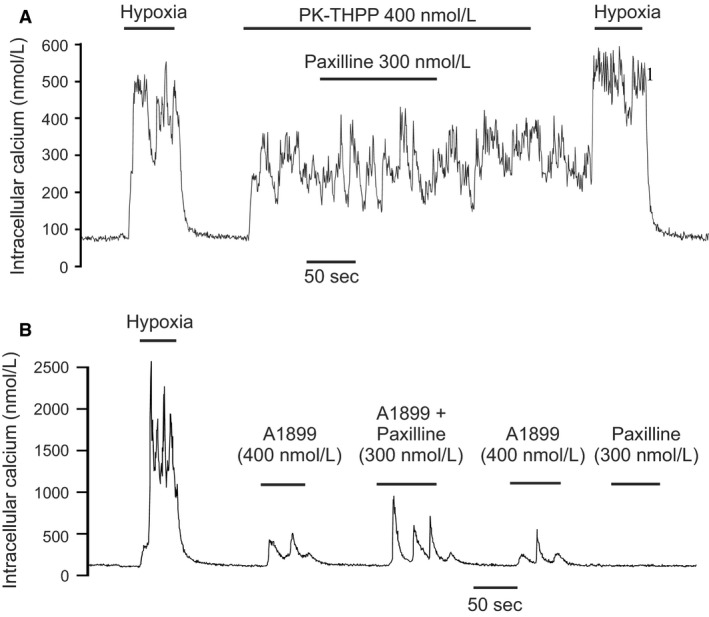
Effects of 300 nmol/L paxilline on the [Ca2+]i response to TASK channel inhibitors. (A) Paxilline + 400 nmol/L PK‐THPP. (B) Paxilline + 400 nmol/L A1899. Note increase in [Ca2+]i response to A1899 during application of paxilline but that paxilline has no appreciable effects on the response to PK‐THPP.
Figure 12.
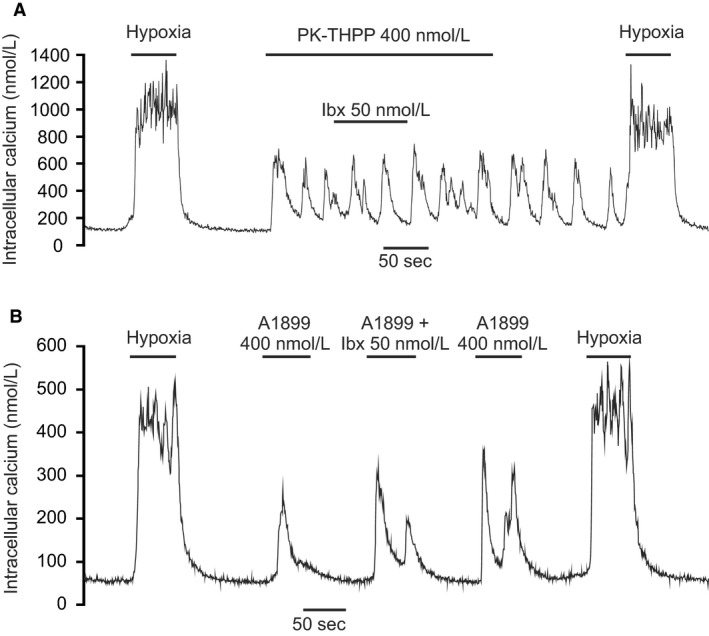
Effects of 50 nmol/L Iberiotoxin on the [Ca2+]i response to TASK channel inhibitors. (A) Iberiotoxin + 400 nmol/L PK‐THPP. (B) Iberiotoxin + 400 nmol/L A1899. Note apparent lack of effect of iberiotoxin in presence of PK‐THPP.
TEA
At 5 mmol/L TEA increased the amplitude of [Ca2+]i spiking activity in the presence of 400 nmol/L PK‐THPP and increased the average [Ca2+]i measured over an approximate 50‐sec time period before and during TEA application (see Figs. 10A and 13A). This response to TEA was modest in amplitude and rapidly reversible. Addition of TEA (5 mmol/L) and A1899 (400 nmol/L) together did not significantly increase the average [Ca2+]i response compared to the actions of A1899 alone. It was however noted that the peak level of [Ca2+]i observed in the presence of TEA + A1899 was invariably greater than that observed in the presence of A1899 alone (666 ± 128 nmol/L vs. 871 ± 166; n = 11, P < 0.02) see Figures 10B and 13B.
Figure 13.
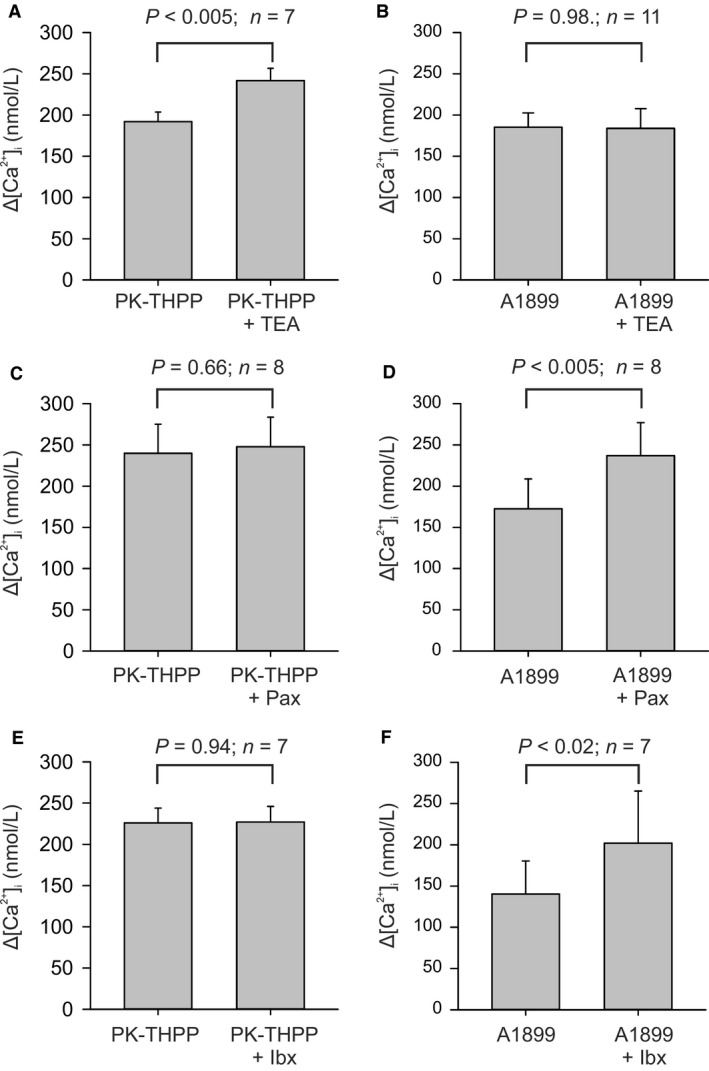
Summary of effects of combinations of K‐channel inhibitors on intracellular calcium. Y axis values represent the increase in [Ca2+]i (over base line [Ca2+]i) in the presence of K+‐channel inhibitor/s. [Ca2+]i was averaged over the duration of exposure to the inhibitors (approx. 40–50 s). Experimental protocols are shown in Figures 8,9 and 10. Inhibitor concentrations were PK‐THPP 400 nmol/L, A1899 400 nmol/L, TEA 5 mmol/L, Paxilline (Pax) 300 nmol/L, and Iberiotoxin (Ibx) 50 nmol/L. Values are mean ± SEM, P values were calculated using a paired t test in all panels except (F) which uses a Wilcoxon signed‐rank test.
Paxilline
At 300 nmol/L paxilline had no significant effect on the [Ca2+]i response to 400 nmol/L PK‐THPP (Figs. 11A and 13C) but did increase the average [Ca2+]i‐response to 400 nmol/L A1899 (Figs. 11B and 13D).
Iberiotoxin
At 50 nmol/L iberiotoxin had no discernible, or statistically significant, effect on the average [Ca2+]i response to PK‐THPP (400 nmol/L) but did cause a small increase in the response to A1899 (400 nmol/L) see Figures 12, 13E and F.
Comparison of the effects of K‐channel inhibitors with those of hypoxia
In each of the experiments conducted using K‐channel inhibitors type‐1 cells were first exposed to a strong hypoxic stimulus to confirm their identity and oxygen sensitivity. This has allowed us to make direct comparisons between the [Ca2+]i response to hypoxia and the [Ca2+]i response to potassium channel inhibitor (or combination of inhibitors). Figure 14A presents the inhibitor response as a percentage of the hypoxic response. The size of the response to K+‐channel inhibitor/s was also compared to the response to hypoxia by paired t‐test (data presented in Fig. 14A). It is clear that for all inhibitors/combinations of inhibitor bar one the [Ca2+]i response to inhibitors is significantly less than that to hypoxia. In the one exception, A1899 + paxilline, which only narrowly failed to reach significance, the data set contained three cells with very low responses to hypoxia which fell within the group of outliers depicted in Figure 14B. This suggests that none of the inhibitor combinations were truly able to match the effects of hypoxia.
Figure 14.
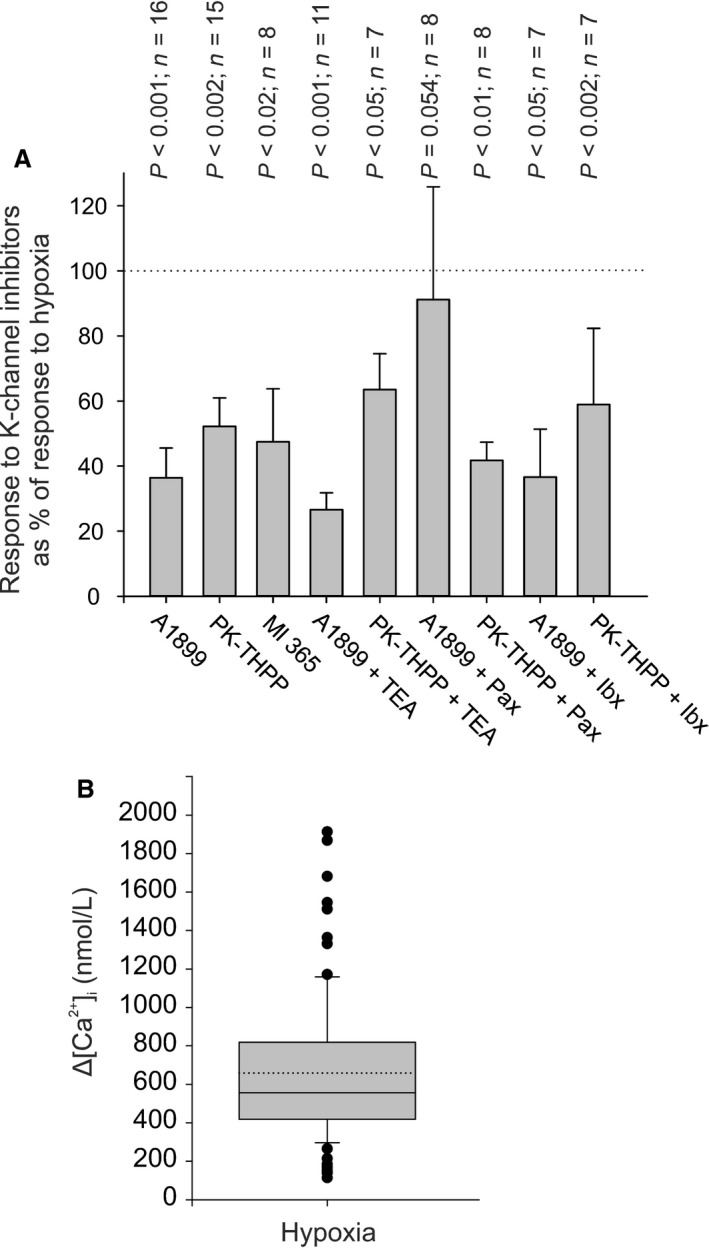
(A) Comparison of effects of K‐channel inhibitors with those of hypoxia (N2 –equilibrated Tyrode see methods). Data (y axis) represents the average [Ca2+]i response recorded in the presence of K+ channel inhibitor/s expressed as a percentage of the response to a hypoxic stimulus recorded in the same cell/s. The [Ca2+]i response to inhibitor/hypoxia was determined from the average [Ca2+]i recorded over an approx. 50 sec interval in the presence of inhibitor/hypoxia minus baseline [Ca2+]i (recorded over 50 sec period under control conditions). Data are mean ± SEM. P values represent a comparison of response to inhibitor versus hypoxia using a paired t‐test. Note in all conditions bar one (which only narrowly failed to reach significance) the reponse to hypoxia was always greater than that to any single TASK‐channel inhibitor or combination of TASK and BKC a channel inhibitor. Drug concentrations were PK‐THPP 400 nmol/L, A1899 400 nmol/L, Ml365 4 μmol/L, TEA 5 mmol/L, paxilline (Pax) 300 nmol/L, and iberiotoxin (Ibx) 50 nmol/L. (B) Box and whisker plot of all responses to hypoxia recorded in this study (n = 87). Box 25th‐75th percentiles, whisker 10th and 90th percentiles, broken line = mean, solid line = median. Individual outlying values only are plotted.
In view of the above observation, we also tested the effects of A1899 and PK‐THPP on voltage‐gated Ca2+ entry in type‐1 cells in response to depolarization with high (30 mmol/L) K+ in order to exclude the possibility that these drugs might have previously unknown effects on voltage gated Ca‐channels. Neither A1899 nor PK‐THPP reduced the [Ca2+]i response to 30 mmol/L K+ (Fig. 15). These drugs do not therefore appear to interfere with voltage gated Ca2+ entry/signaling per se. We further tested the effects of PK‐THPP on the response to hypoxia to see if it might interfere with any other aspect of signaling involved in mediating the [Ca2+]i‐response to hypoxia/TASK inhibition. We found that 400 nmol/L PK‐THPP had no discernible effect on [Ca2+]i signaling in response to hypoxia (figure 15A). The failure of PK‐THPP and A1899 to fully match the effects of hypoxia cannot therefore be ascribed to some unknown, nonspecific, inhibitory effect upon Ca‐signaling.
Figure 15.
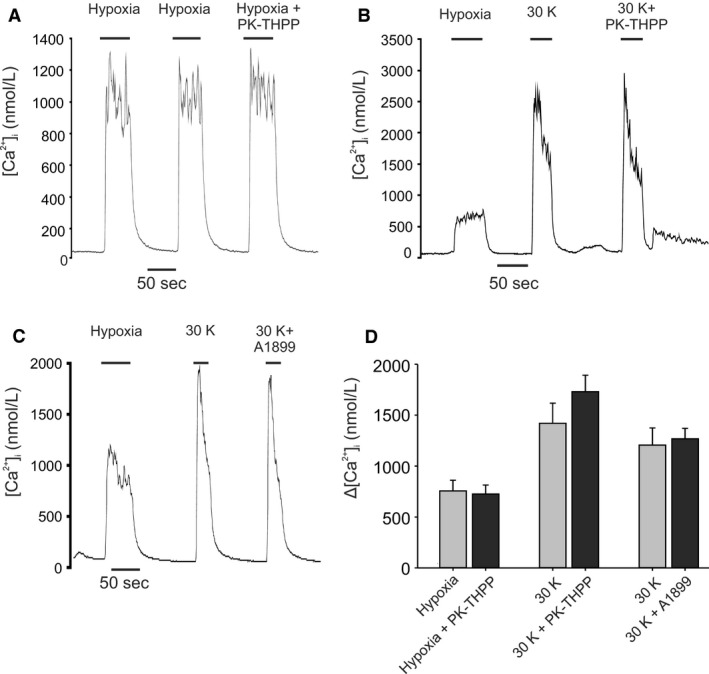
Effects of TASK channel inhibitors on calcium responses to high potassium and to hypoxia. (A) Representative trace of cellular calcium response to hypoxia alone, and in the presence of 400 nmol/L PK‐THPP. (B) Calcium response to depolarization by 30 mmol/L K+ alone, and in the presence of 400 nmol/L PK‐THPP. Increase in K+ was osmotically compensated for by reduction in Na+. (C) Calcium response to depolarization by 30 mmol/L K+ alone, and in the presence of 400 nmol/L A1899. (D) Summary of effects of TASK channel inhibitors on the calcium response to depolarization with 30 mmol/L K+ and the effects of PK‐THPP on the [Ca2+]i response to hypoxia. Comparisons are i) Hypoxia versus Hypoxia + 400 nmol/L PK‐THPP, n = 6, P = 0.36, ii) 30 mmol/L K+ versus 30 mmol/L K+ + 400 nmol/L PK‐THPP, n = 7, P = 0.07, iii) 30 mmol/L K+ versus 30 mmol/L K+ + 400 nmol/L A1899, n = 6, P = 0.63.
Discussion
We and others have previously described abundant potassium channel activity in the membranes of carotid body type‐1 cells at resting membrane potentials (Buckler et al. 2000; Kim et al. 2009). These channels are characterized by very flickery kinetics with short and variable amplitude open states (Williams and Buckler 2004). They are thought to mediate the background, or leak, potassium conductance/current in type‐1 cells which plays a major role in setting the cells resting membrane potential and in bringing about membrane depolarization in response to a number of chemostimuli including hypoxia, acidosis, and metabolic poisons (Buckler 2015). These channels are widely believed to belong to the TASK channel subgroup of the tandem‐p‐domain potassium channel family. Specifically they are thought to be a mixed population comprising primarily of TASK‐1‐TASK‐3 heterodimers together with a lesser number of TASK‐1 and TASK‐3 homodimers. This attribution has been based on the biophysical properties of both whole cell currents and single channel recordings as well as studies using mice in which Task‐1 and/or Task‐3 genes have been disrupted (Kim et al. 2009; Turner and Buckler 2013). Compelling pharmacological confirmation of the identity of these channels has, however, been lacking due to the poor specificity of agents that were originally used to characterize these types of potassium channel. The lack of selective inhibitors for these endogenous channels has also hindered research into their functional relevance. Here, we demonstrate that selective inhibitors of TASK‐1 and TASK‐3 also inhibit endogenous TASK channels in the type‐1 cell and are effective stimulants of type‐1 cell [Ca2+]i signaling.
A1899 is reported to be a selective inhibitor of TASK‐1 showing modest, approx. 10 fold, selectivity over TASK‐3 (IC50 35 nmol/L vs. 318 nmol/L) and much greater selectivity over other tandem‐p‐domain K‐channels (Streit et al. 2011; Kiper et al. 2015). A1899 is an open pore blocker and in consequence its apparent IC50 may depend on potassium ion concentration. In our studies, we used high potassium in the pipette filling solution whilst recording in the cell attached patch configuration and achieved 63% inhibition of heterologously expressed TASK‐1 channel activity in HEK 293 cells with 400 nmol/L A1899. This compares favorably with the level of inhibition for 400 nmol/L A1899 reported in high extracellular K+ in oocytes (59.7%; (Streit et al. 2011)). PK‐THPP is a potent inhibitor of TASK‐3 channels (compound 23 in (Coburn et al. 2012)) with modest (10‐fold) selectivity for TASK‐3 over TASK‐1 (reported IC50 values of 35 nmol/L for TASK‐3 and 300 nmol/L for TASK‐1). It does however show good selectivity over TREK and some other tandem‐p‐domain K‐channels (Coburn et al. 2012). Effects of high K on the inhibitory potency of PK‐THPP have not been reported. In our hands, however, we obtained strong (85%) inhibition of heterologously expressed TASK‐3 in HEK cells with 400 nmol/L PK‐THPP. Both inhibitors are therefore effective under the recording conditions used in this study (cell attached patch configuration).
In studies conducted on type‐1 cells we found that both A1899 and PK‐THPP inhibited TASK channel activity in a dose‐dependent manner. With A1899 there was only a modest inhibition up to 400 nmol/L but with a greater degree of inhibition at much higher concentrations. This may suggest multiple sites of action. In principle we would expect three potential targets homomeric TASK‐1, homomeric TASK‐3 and heteromeric TASK‐1/TASK‐3. The effect of A1899 on TASK‐1/TASK‐3 heterodimers has thus far only been studied in Xenopus Oocytes. Here, A1899 was shown to be much less effective at blocking TASK‐1/TASK‐3 heterodimers compared to TASK ‐1 homodimers (Rinné et al. 2015). The relatively weak effects of A1899 at concentrations up to 400 nmol/L is therefore consistent with the expected preponderance of TASK‐1/TASK‐3 heterodimers in the type‐1 cell (Kim et al. 2009; Turner and Buckler 2013).
In contrast PK‐THPP produced a robust, dose‐dependent, saturating, inhibition of TASK channel activity of up to 90% at 400 nmol/L. This matches the level of inhibition seen in heterologously expressed TASK‐3 channels and, given that the majority of TASK channels in the type‐1 cell membrane are thought to be heterodimers, indicates that this compound is at least as effective at inhibiting TASK‐1/TASK‐3 heterodimers as it is at inhibiting TASK‐3. Our estimated IC50 for inhibition of the type‐1 cell channels was approx. 66 nmol/L.
The observation that both A1899 and PK‐THPP block background channels in the type‐1 cell provides further confirmation that these channels are indeed TASK channels. Moreover, these agents provide new opportunities to explore the functional significance of TASK channels in controlling type‐1 cell excitability. A key element of the signaling mechanisms responsible for mediating a depolarizing response to natural chemostimuli (acidosis and hypoxia) is the inhibition of potassium channels. Selective inhibitors of potassium channels give us an opportunity to unpick the specific roles of individual channel types. Our current model is that calcium entry is promoted by depolarization through the inhibition of the background K‐current (of which TASK is presumed to be the main contributor) but may then be sustained and or enhanced via the concurrent inhibition of calcium activated potassium currents. The obvious prediction that derives from this model is that inhibition of TASK/background K‐current should be sufficient to at least evoke an initial rise in intracellular calcium via voltage‐gated Ca‐entry.
We found that A1899 and PK‐THPP both increased intracellular calcium in isolated type‐1 cells in a concentration‐dependent manner. This rise in calcium was prevented, or reversed in calcium‐free medium and was inhibited by the voltage‐gated Ca2+‐channel inhibitor Nickel (2 mmol/L). These data support the hypothesis that inhibition of TASK channel activity in type‐1 cells is capable of initiating voltage gated calcium entry. We further confirmed this with another more recent TASK inhibitor ML365. ML365 is a selective TASK‐1 inhibitor, but also inhibits TASK3 (IC50's = 16 nmol/L TASK‐1 and 990 nmol/L TASK‐3) (Flaherty et al. 2014). ML365 also evoked a dose dependent increase in intracellular calcium in the type‐1 cell. We noted however that although A1899, PK‐THPP, and ML365 could evoke a robust increase in [Ca2+]i this was, in almost all cases, lower that that seen in response to hypoxia in the same cells/recordings (see Fig. 14). Thus, although 400 nmol/L PK‐THPP caused 90% inhibition of type‐1 cell TASK channel activity it did not produce as robust a calcium response as did hypoxia which inhibits TASK channel activity by around 40–80% (Buckler et al. 2000; Kim et al. 2009).
As discussed above TASK channels are not the only potassium channels reported to be oxygen sensitive in type‐1 cells. In the rat type‐1 cell a large conductance calcium activated potassium channel has been repeatedly reported to be oxygen sensitive (Peers 1990a; Wyatt and Peers 1995; Riesco Fagundo et al. 2001), although this has recently been disputed (Wang and Kim 2017). This channel is no longer thought to be particularly active at the resting membrane potential in normoxia but may become active as the cell is depolarized (Wang and Kim 2017). Consequently, BKCa channel inhibitors alone seem to have little effect on basal [Ca2+]i in freshly isolated rat type‐1 cells (Buckler 1997) unless they are partially depolarized (Wang and Kim 2017). BKCa and Kv channels may, however, become active as the cell depolarizes and [Ca2+]i rises thus acting as a brake on cell excitation. The inhibition of such channels by hypoxia (or acidosis) could therefore be argued to play a role in mediating the calcium response to chemostimuli by reducing the extent to which these channels oppose cell depolarization and elevation of [Ca2+]i. This idea is supported by the observation that some BKCa and KV channel inhibitors can augment the [Ca2+]i response to hypoxia (Buckler 1997; Wang and Kim 2017). We therefore questioned whether the smaller [Ca2+]i response to direct TASK channel inhibition (when compared to hypoxia) might be due to the lack of concurrent inhibition of BKCa channel activity. In order to test this hypothesis we studied the effects of inhibiting both BKCa channels and TASK channels at the same time. In our studies we found that 5 mmol/L TEA did indeed modestly augment the [Ca2+]i response to PK‐THPP and also altered the response to A1899 (in so far as peak [Ca2+]i was increased but not mean [Ca2+]i). This is consistent with the expectation that as inhibition of TASK channels leads to depolarization so other types of voltage, and or calcium activated K‐channels may become active limiting the extent of depolarization and thus curb the rise in [Ca2+]i. TEA is not, however, selective for BKCa as it also inhibits much of the delayed rectifier K‐current in type‐1 cells. Iberiotoxin (a selective BKCa‐inhibitor with an estimated IC 50 of 250 pmol/L (Galvez et al. 1990)) did not appear to have any effect upon the [Ca2+]i response to PK‐THPP but did seem to slightly augment the response to A1899. The same pattern was seen with paxilline another BKCa‐channel inhibitor which slightly augmented the [Ca2+]i ‐response to A1899 but not that to PK‐THPP. The relatively small effect of these BKCa channel inhibitors was surprising given the proposed role for BKCa but is not inconsistent with recent studies on the effects of K‐channel inhibitors on the response to hypoxia in which TEA and 4AP enhanced [Ca2+]i but iberiotoxin did not(Wang and Kim 2017). It is difficult to speculate on why the effects of BKCa inhibitors are so variable. It may depend on the precise nature of the electrical signals being produced. Freshly isolated rat type‐1 cells have a resting membrane potential of around −60 mV (in perforated patch recordings) and a low resting [Ca2+]i. This situation is mostly stable although occasional spontaneous depolarizations and [Ca2+]i spikes are seen. In response to hypoxia, hypercapnia, metabolic acidosis, and mitochondrial inhibitors type‐1 cells undergo a rapid depolarization producing a receptor potential which promotes action potential generation. These action potentials may be tonic or bursting. With powerful stimuli, for example, anoxia and mitochondrial inhibitors the receptor potential may be large and action potentials reduced to small (10–20 mV) spikes (Buckler and Vaughan‐Jones 1994a; Buckler and Vaughan‐Jones 1994b; Buckler 1997; Buckler and Vaughan‐Jones 1998; Buckler et al. 2000; Wyatt and Buckler 2004; Buckler 2012). The pattern of electrical activity may therefore vary with stimulus type and severity. This could affect the involvement, and influence, of BKCa channels. In addition, cell‐cell and animal‐animal variability may be present (see e.g.. Fig. 14 regarding variability of [Ca2+]i response to hypoxia).
Irrespective of the reasons for the seemingly small influence of BKCa inhibitors, what is clear from these studies is that concomitant inhibition of the only two known oxygen‐sensitive channels in rat type‐1 cells fails to match the response to hypoxia itself. Thus, our current model of oxygen sensing is presumably incomplete. There may be other, as yet unidentified, oxygen‐sensitive currents/channels which contribute to membrane depolarization and the elevation of cytosolic calcium besides TASK and BKCa. This is consistent with the observation that in Task‐1:Task‐3 double knockout mice it is possible to identify type‐1 cells that retain the capability to produce robust [Ca2+]i response to hypoxia (Turner and Buckler 2013). There is a limit to how far we can speculate as to the nature of such channels/currents except that they are probably not strongly inhibited by TEA and that they could be very small (a few pA) since the inhibition of TASK channels substantially reduces membrane conductance. An alternative possibility is that hypoxia enhances [Ca2+]i signaling by interfering with mitochondrial Ca2+‐buffering. In many cells voltage‐gated Ca2+‐entry can result in large amounts of Ca2+ being taken up into the mitochondria thus buffering the rise in cytosolic [Ca2+]i (Rizzuto et al. 2012). Mitochondrial Ca‐uptake depends upon the mitochondrial membrane potential. In type‐1 cells mitochondria depolarize in response to hypoxia (Buckler and Turner 2013). Thus, diminished mitochondrial Ca2+‐buffering could explain the greater rise in [Ca2+]i seen in hypoxia compared to that seen with just K‐channel inhibition. Further investigation of oxygen sensitive currents and Ca2+‐signaling/buffering in the type‐1 cell would now seem warranted and feasible given the availability of selective and highly effective TASK channel inhibitors to help isolate other membrane currents.
We have not sought to compare the effects of acidosis on [Ca2+]i with those of TASK‐channel inhibitors in this study. [Ca2+]i – responses to moderate acidosis are generally weaker than the response to intense hypoxia (e.g., see (Dasso et al. 2000)) so there is no obvious reason to presuppose that excitation of type‐1 cells by acidosis needs the involvement of anything other than TASK channel inhibition. It is however of interest to note that BKCa‐channels are also acid sensitive (Peers 1990b) and appear to be involved, alongside TASK, in acid sensing in mouse chromaffin cells. Indeed in chromaffin cells the combination of A1899 and paxilline most closely simulates the effects of acidosis in depolarizing the chromaffin cell and promoting burst firing (Guarina et al. 2017). This is similar to our observation that paxilline enhanced the spiking [Ca2+]i response to A1899. It should be noted that TASK‐1 is more sensitive to fall in pH than is TASK‐3 and A1899 is a better inhibitor of TASK1 than TASK3 so it may provide a closer approximation to the effects of acidosis on a mixed population of TASK channels.
In addition to the recently developed TASK channel inhibitors, we also investigated the effects of doxapram. Doxapram is the only respiratory stimulant currently in clinical use. Its effects on ventilation are thought to be primarily due to stimulation of the carotid body (Mitchell and Herbert 1975). It is known to promote neurosecretion from isolated carotid bodies (Anderson Beck et al. 1995) and inhibits heterologously expressed TASK‐1 and TASK‐3 (Cotten et al. 2006). It has also been reported to inhibit BKCa and Kv channels (Peers 1991) but, as discussed above, this alone frequently does not lead to excitation of type‐1 cells. It is therefore hypothesized that the ability of doxapram to act as a respiratory stimulant is due to inhibition of TASK channels (Cotten et al. 2006). The effect of doxapram on native type‐1 cell TASK channels (i.e., heterodimeric TASK 1/3) has not however previously been reported, nor has its effect on [Ca2+]i signaling. Our results are therefore the first to confirm that doxapram can indeed inhibit type‐1 cell TASK channels and excite [Ca2+]i‐signaling. This supports the hypothesis that TASK channel inhibition is key to respiratory stimulation by doxapram. Whilst we cannot at this stage exclude contributory roles for BKCa and KV inhibition in the context of doxapram, it is clear from the studies discussed above that TASK channel inhibition alone is sufficient to excite type‐1 cells. Moreover selective TASK channel inhibitors (A1899 and PK‐THPP) also act as respiratory stimulants (Cotten 2013). In this respect it is worth noting that the relative potency of these compounds to inhibit TASK channel activity in the type 1 cells (PK‐THPP > A1899 > doxapram) is the same as that reported for stimulation of ventilation in anesthetized rats (Cotten 2013).
In summary, this study consolidates the hypothesis that the highly expressed background K+ channels in type‐1 cells are TASK channels by adding robust pharmacological evidence to existing biophysical and gene knockout evidence. In addition, we confirm that selective inhibition of type‐1 cell TASK channels using these agents was capable of eliciting voltage‐gated Ca2+ entry thus supporting the proposed role of these channels in chemosensing. We were further able to confirm a modest role for BKCa in opposing calcium influx following depolarization induced by TASK inhibition such that the inhibition of these channels by chemostimuli could plausibly also contribute to the calcium response to hypoxia/acidosis. The fact that the [Ca2+]i response to hypoxia exceeded that seen to any combination of TASK + BKCa channel inhibitor, however, suggests that hypoxia probably modulates other channels in addition to TASK and BKCa and/or modulates [Ca2+]i signaling in other ways. Finally our data support the concept that selective TASK channel inhibitors may be of clinical use as respiratory stimulants perhaps to offset the respiratory depression that accompanies the use of a number of general anesthetics and analgesics (Pandit and Buckler 2009; Cotten 2013).
Conflicts of Interest
The authors have no conflicts of interests to declare.
O'Donohoe P. B., Huskens N., Turner P. J., Pandit J. J., Buckler K. J.. A1899, PK‐THPP, ML365, and Doxapram inhibit endogenous TASK channels and excite calcium signaling in carotid body type‐1 cells. Physiol Rep, 6 (18), 2018, e13876, https://doi.org/10.14814/phy2.13876
Funding Information
This work was funded by grants from the Medical Research Council (MR/J011452/1 ‐ O'Donohoe), British Journal of Anaesthesia & National Institute of Academic Anaesthesia (ID WKR0‐2011‐0070), Difficult Airway Society (UK) and a personal Higher Education Funding Council (England) New Blood Clinical Senior Lectureship award to JJP.
References
- Anderson Beck, R. , Wilson L., Brazier S., Hughes I. E., and Peers C.. 1995. Doxapram stimulates dopamine release from the intact rat carotid body in vitro. Neurosci. Lett. 187:25–8 [DOI] [PubMed] [Google Scholar]
- Buckler, K. J. 1997. A novel oxygen‐sensitive potassium current in rat carotid body type I cells. J. Physiol. 498:649–662. [DOI] [PMC free article] [PubMed] [Google Scholar]
- Buckler, K. J. 2007. TASK‐like potassium channels and oxygen sensing in the carotid body. Respir. Physiol. Neurobiol. 157:55–64. [DOI] [PubMed] [Google Scholar]
- Buckler, K. J. 2012. Effects of exogenous hydrogen sulphide on calcium signalling, background (TASK) K channel activity and mitochondrial function in chemoreceptor cells. Pflugers Arch. 463:743–754. [DOI] [PMC free article] [PubMed] [Google Scholar]
- Buckler, K. J. 2015. TASK channels in arterial chemoreceptors and their role in oxygen and acid sensing. Pflugers Arch. 467:1013–1025. [DOI] [PMC free article] [PubMed] [Google Scholar]
- Buckler, K. J. , and Turner P. J.. 2013. Oxygen sensitivity of mitochondrial function in rat arterial chemoreceptor cells. J. Physiol. 591:3549–3563 [DOI] [PMC free article] [PubMed] [Google Scholar]
- Buckler, K. J. , and Vaughan‐Jones R. D.. 1994a. Effects of hypercapnia on membrane potential and intracellular calcium in rat carotid body type I cells. J. Physiol. 478:157–171. [DOI] [PMC free article] [PubMed] [Google Scholar]
- Buckler, K. J. , and Vaughan‐Jones R. D.. 1994b. Effects of hypoxia on membrane potential and intracellular calcium in rat neonatal carotid body type I cells. J. Physiol. 476:423–428. [DOI] [PMC free article] [PubMed] [Google Scholar]
- Buckler, K. J. , and Vaughan‐Jones R. D.. 1998. Effects of mitochondrial uncouplers on intracellular calcium, pH and membrane potential in rat carotid body type I cells. J. Physiol. 513(Pt 3):819–833. [DOI] [PMC free article] [PubMed] [Google Scholar]
- Buckler, K. J. , Williams B. A., and Honore E.. 2000. An oxygen‐, acid‐ and anaesthetic‐sensitive TASK‐like background potassium channel in rat arterial chemoreceptor cells. J. Physiol. 525(Pt 1):135–142. [DOI] [PMC free article] [PubMed] [Google Scholar]
- de Burgh Daly, M . 1997. Peripheral arterial chemoreceptors and respiratory‐cardiovascular integration Monographs of the physiological society vol. 46. Clarendon Press, Oxford. [Google Scholar]
- Candia, S. , Garcia M. L., and Latorre R.. 1992. Mode of action of iberiotoxin, a potent blocker of the large conductance Ca(2 + )‐activated K+ channel. Biophys. J. 63:583–590. [DOI] [PMC free article] [PubMed] [Google Scholar]
- Coburn, C. A. , Luo Y., Cui M., Wang J., Soll R., Dong J., et al. 2012. Discovery of a pharmacologically active antagonist of the two‐pore‐domain potassium channel K2P9.1 (TASK‐3). ChemMedChem 7:123–133. [DOI] [PubMed] [Google Scholar]
- Cotten, J. F. 2013. TASK‐1 (KCNK3) and TASK‐3 (KCNK9) tandem pore potassium channel antagonists stimulate breathing in isoflurane‐anesthetized rats. Anesth. Analg. 116:810–816. [DOI] [PMC free article] [PubMed] [Google Scholar]
- Cotten, J. F. , Keshavaprasad B., Laster M. J., Eger E. I. 2nd, and Yost C. S.. 2006. The ventilatory stimulant doxapram inhibits TASK tandem pore (K2P) potassium channel function but does not affect minimum alveolar anesthetic concentration. Anesth. Analg. 102:779–785. [DOI] [PubMed] [Google Scholar]
- Dallas, M. L. , Scragg J. L., Wyatt C. N., Ross F., Hardie D. G., Evans A. M., et al. 2009. Modulation of O(2) sensitive K (+) channels by AMP‐activated protein kinase. Adv. Exp. Med. Biol. 648:57–63. [DOI] [PubMed] [Google Scholar]
- Dasso, L. L. , Buckler K. J., and Vaughan‐Jones R. D.. 2000. Interactions between hypoxia and hypercapnic acidosis on calcium signaling in carotid body type I cells. Am. J. Physiol. Lung Cell. Mol. Physiol. 279:L36–42. [DOI] [PubMed] [Google Scholar]
- Flaherty, D. P. , Simpson D. S., Miller M., Maki B. E., Zou B., Shi J., et al. 2014. Potent and selective inhibitors of the TASK‐1 potassium channel through chemical optimization of a bis‐amide scaffold. Bioorg. Med. Chem. Lett. 24:3968–3973. [DOI] [PMC free article] [PubMed] [Google Scholar]
- Galvez, A. , Gimenez‐Gallego G., Reuben J. P., Roy‐Contancin L., Feigenbaum P., Kaczorowski G. J., et al. 1990. Purification and characterization of a unique, potent, peptidyl probe for the high conductance calcium‐activated potassium channel from venom of the scorpion Buthus tamulus. J. Biol. Chem. 265:11083–11090. [PubMed] [Google Scholar]
- Ganfornina, M. D. , and Lopez Barneo J.. 1992. Potassium channel types in arterial chemoreceptor cells and their selective modulation by oxygen. J. Gen. Physiol. 100:401–426. [DOI] [PMC free article] [PubMed] [Google Scholar]
- Gomez‐Nino, A. , Obeso A., Baranda J. A., Santo‐Domingo J., Lopez‐Lopez J. R., and Gonzalez C.. 2009. MaxiK potassium channels in the function of chemoreceptor cells of the rat carotid body. Am. J. Physiol. Cell Physiol. 297:C715. [DOI] [PubMed] [Google Scholar]
- Grynkiewicz, G. , Poenie M., and Tsien R. Y.. 1985. A new generation of Ca2 + indicators with greatly improved fluorescence properties. J. Biol. Chem. 260:3440–3450. [PubMed] [Google Scholar]
- Guarina, L. , Vandael D. H., Carabelli V., and Carbone E.. 2017. Low pHo boosts burst firing and catecholamine release by blocking TASK‐1 and BK channels while preserving Cav1 channels in mouse chromaffin cells. J. Physiol. 595:2587–2609. [DOI] [PMC free article] [PubMed] [Google Scholar]
- Kim, D. , Cavanaugh E. J., Kim I., and Carroll J. L.. 2009. Heteromeric TASK‐1/TASK‐3 is the major oxygen‐sensitive background K+ channel in rat carotid body glomus cells. J. Physiol. 587:2963–2975. [DOI] [PMC free article] [PubMed] [Google Scholar]
- Kiper, A. K. , Rinné S., Rolfes C., Ramírez D., Seebohm G., Netter M. F., et al. 2015. Kv1.5 blockers preferentially inhibit TASK‐1 channels: TASK‐1 as a target against atrial fibrillation and obstructive sleep apnea? Pflugers Arch. 467:1081–1090. [DOI] [PubMed] [Google Scholar]
- Knaus, H. G. , McManus O. B., Lee S. H., Schmalhofer W. A., Garcia‐Calvo M., Helms L. M., et al. 1994. Tremorgenic indole alkaloids potently inhibit smooth muscle high‐conductance calcium‐activated potassium channels. Biochemistry 33:5819–5828. [DOI] [PubMed] [Google Scholar]
- Lopez Barneo, J. , Lopez Lopez J. R., Urena J., and Gonzalez C.. 1988. Chemotransduction in the carotid body: K+ current modulated by PO2 in type I chemoreceptor cells. Science 241:580–582. [DOI] [PubMed] [Google Scholar]
- Lopez Lopez, J. , Gonzalez C., Urena J., and Lopez Barneo J.. 1989. Low pO2 selectively inhibits K channel activity in chemoreceptor cells of the mammalian carotid body. J. Gen. Physiol. 93:1001–1015. [DOI] [PMC free article] [PubMed] [Google Scholar]
- Mitchell, R. A. , and Herbert D. A.. 1975. Potencies of doxapram and hypoxia in stimulating carotid‐body chemoreceptors and ventilation in anesthetized cats. Anesthesiology 42:559–566. [DOI] [PubMed] [Google Scholar]
- Nurse, C. A. 2010. Neurotransmitter and neuromodulatory mechanisms at peripheral arterial chemoreceptors. Exp. Physiol. 95:657–667. [DOI] [PubMed] [Google Scholar]
- Pandit, J. J. , and Buckler K. J.. 2009. Differential effects of halothane and sevoflurane on hypoxia‐induced intracellular calcium transients of neonatal rat carotid body type I cells. Br. J. Anaesth. 103:701–710. [DOI] [PubMed] [Google Scholar]
- Pardal, R. , Ludewig U., García‐Hirschfeld J., Lopez Barneo J.. 2000. Secretory responses of intact glomus cells in thin slices of rat carotid body to hypoxia and tetraethylammonium. Proc. Natl. Acad. Sci. USA 97:2361–2366 [DOI] [PMC free article] [PubMed] [Google Scholar]
- Peers, C. 1990a. Hypoxic suppression of K+ currents in type I carotid body cells: selective effect on the Ca2(+)‐activated K+ current. Neurosci. Lett. 119:253–256. [DOI] [PubMed] [Google Scholar]
- Peers, C. 1990b. Effect of lowered extracellular pH on Ca2(+)‐dependent K+ currents in type I cells from the neonatal rat carotid body. J. Physiol. 422:381–395. [DOI] [PMC free article] [PubMed] [Google Scholar]
- Peers, C. 1991. Effects of doxapram on ionic currents recorded in isolated type I cells of the neonatal rat carotid body. Brain Res. 568:116–122. [DOI] [PubMed] [Google Scholar]
- Riesco Fagundo, A. M. , Perez Garcia M. T., Gonzalez C., and Lopez Lopez J. R.. 2001. O(2) modulates large‐conductance Ca(2 + )‐dependent K(+) channels of rat chemoreceptor cells by a membrane‐restricted and CO‐sensitive mechanism. Circ. Res. 89:430–436. [DOI] [PubMed] [Google Scholar]
- Rinné, S. , Kiper A. K., Schlichthörl G., Dittmann S., Netter M. F., Limberg S. H., et al. 2015. TASK‐1 and TASK‐3 may form heterodimers in human atrial cardiomyocytes. J. Mol. Cell. Cardiol. 81:71–80. [DOI] [PubMed] [Google Scholar]
- Rizzuto, R. , De Stefani D., Raffaello A., and Mammucari C.. 2012. Mitochondria as sensors and regulators of calcium signalling. Nat. Rev. Mol. Cell Biol. 13:566–578. [DOI] [PubMed] [Google Scholar]
- Sanchez, M. , and McManus O. B.. 1996. Paxilline inhibition of the alpha‐subunit of the high‐conductance calcium‐activated potassium channel. Neuropharmacology 35:963–968. [DOI] [PubMed] [Google Scholar]
- Streit, A. K. , Netter M. F., Kempf F., Walecki M., Rinné S., Bollepalli M. K., et al. 2011. A specific two‐pore domain potassium channel blocker defines the structure of the task‐1 open pore. J. Biol. Chem. 286:13977–13984. [DOI] [PMC free article] [PubMed] [Google Scholar]
- Turner, P. J. , and Buckler K. J.. 2013. Oxygen and mitochondrial inhibitors modulate both monomeric and heteromeric TASK‐1 and TASK‐3 channels in mouse carotid body type‐1 cells. J. Physiol. 591:5977–5998. [DOI] [PMC free article] [PubMed] [Google Scholar]
- Wang, J. , and Kim D.. 2017. Activation of voltage‐dependent K(+) channels strongly limits hypoxia‐induced elevation of [Ca(2 + )]i in rat carotid body glomus cells. J. Physiol. 596:3119–3136. [DOI] [PMC free article] [PubMed] [Google Scholar]
- Williams, B. A. , and Buckler K. J.. 2004. Biophysical properties and metabolic regulation of a TASK‐like potassium channel in rat carotid body type 1 cells. Am. J. Physiol. Lung Cell. Mol. Physiol. 286:L221. [DOI] [PubMed] [Google Scholar]
- Wyatt, C. N. , and Buckler K. J.. 2004. The effect of mitochondrial inhibitors on membrane currents in isolated neonatal rat carotid body type I cells. J. Physiol. 556:175–191. [DOI] [PMC free article] [PubMed] [Google Scholar]
- Wyatt, C. N. , and Peers C.. 1995. Ca(2 + )‐activated K+ channels in isolated type I cells of the neonatal rat carotid body. J. Physiol. 483:559–565. [DOI] [PMC free article] [PubMed] [Google Scholar]


