Abstract
Resident adipose tissue macrophages (ATMs) play multiple roles to maintain tissue homeostasis, such as removing excess free fatty acids and regulation of the extracellular matrix. The phagocytic nature and oxidative resiliency of macrophages not only allows them to function as innate immune cells but also to respond to specific tissue needs, such as iron homeostasis. MFehi ATMs are a subtype of resident ATMs that we recently identified to have twice the intracellular iron content as other ATMs and elevated expression of iron-handling genes. Although studies have demonstrated that iron homeostasis is important for adipocyte health, little is known about how MFehi ATMs may respond to and influence adipose tissue iron availability. Two methodologies were used to address this question: dietary iron supplementation and intraperitoneal iron injection. Upon exposure to high dietary iron, MFehi ATMs accumulated excess iron, whereas the iron content of MFelo ATMs and adipocytes remained unchanged. In this model of chronic iron excess, MFehi ATMs exhibited increased expression of genes involved in iron storage. In the injection model, MFehi ATMs incorporated high levels of iron, and adipocytes were spared iron overload. This acute model of iron overload was associated with increased numbers of MFehi ATMs; 17% could be attributed to monocyte recruitment and 83% to MFelo ATM incorporation into the MFehi pool. The MFehi ATM population maintained its low inflammatory profile and iron-cycling expression profile. These studies expand the field’s understanding of ATMs and confirm that they can respond as a tissue iron sink in models of iron overload.
Keywords: adipose, homeostasis, iron, macrophage, polarization
INTRODUCTION
Adipose tissue (AT) has many different functions, primary among which is the inert storage of fatty acids as a caloric reservoir. To respond to metabolic demand appropriately, adipocytes are in reciprocal communication with other tissues via systemic hormones (e.g., insulin, leptin, adiponectin). Under normal conditions, adipocytes are able to metabolize, store, and synthesize lipids without lipotoxicity (20). Within the last decade, interest in AT has expanded as it becomes clear that local adipocyte physiology, such as oxidative stress or inflammation levels, can have beneficial or detrimental effects systemically.
Immune cells play an important supportive role for adipocytes in the AT microenvironment. The most prominent AT-associated immune cells, AT macrophages (ATMs), are intercalated throughout the tissue matrix in close contact with individual adipocytes. ATMs were first identified in the context of obese AT, in which metabolically inflamed ATMs [Mme, described by Kratz (13)] accumulate and induce chronic inflammation (15, 30, 31). However, resident ATMs are also present in lean AT and fall on the anti-inflammatory (M2-like) end of the polarization spectrum. Understanding the homeostatic functions of resident M2-like ATMs in lean AT may provide a mechanism by which to influence the adipocyte microenvironment, supporting healthy AT expansion.
Macrophages are the primary cells responsible for handling iron in the body. Because of its scarcity, iron is recycled, primarily through the erythrocyte hemoglobin cycle (5). Senescent erythrocytes are phagocytosed, and their heme-associated iron is released as transferrin-bound iron. In fact, the transferrin-iron pool turns over several times daily in humans. Kupffer cells and splenic macrophages are primarily responsible for this turnover, which is regulated by hepcidin (5). M1-like inflammatory macrophages have an important iron sequestration role during infection. However, the field has expanded its understanding of macrophages in iron homeostasis beyond just M1-like macrophages in blood to include resident M2-like macrophages in tissues. Iron is now thought to be spatially regulated on a microenvironmental scale in muscle, spinal cord, and vasculature and even regulated in a time-dependent manner during wound repair (1, 7, 14). In these studies, resident M2-like macrophages are responsible for fine-tuned iron uptake and release. Similar to these tissues, regulated control of iron homeostasis is important in AT for two reasons: 1) AT requires iron availability for healthy adipogenesis (9), and 2) unique to AT, excess fatty acids prevalent in the tissue can react with free iron to facilitate a lipid peroxidation chain reaction (28). Studies have shown that iron overload, specifically in adipocytes, can reduce systemic insulin sensitivity through a reduction in adiponectin (9, 33). This emphasizes the importance of tight regulation of iron in AT, providing the impetus to assess the role of macrophages in this process.
“MFehi” ATMs were discovered by our laboratory as resident macrophages of the AT that have innate ferromagnetism due to high intracellular iron content (23). Like all macrophages in lean AT (19), their cell-surface protein profile is representative of an M2-like, alternatively activated macrophage (23). This is in contrast to M1 classically activated inflammatory macrophages, or Mme, the metabolically activated macrophages, that infiltrate AT in obesity. Macrophage polarization is useful for generic classification, but, in vivo, macrophages span a spectrum of activation states (21). Studies have shown that macrophage polarization strongly influences their iron handling: broadly, M2 macrophages have an iron-cycling phenotype, preferring iron uptake and release over inert storage (6, 17, 25, 26). Although all ATMs in lean AT are M2-like, when they are sorted out by ferromagnetic qualities, MFehi ATMs were found to have an even stronger M2 expression pattern relative to other resident M2 “MFelo” ATMs. Reflecting this iron-cycling phenotype, MFehi have increased expression of iron uptake-associated genes, like the hemoglobin-haptoglobin receptor (CD163) and the transferrin receptor (Tfrc); iron-storage genes, like ferritin (Fth1 and Ftl1); and the primary iron-export gene, ferroportin (Slc40a1). However, unlike M2 macrophages polarized in vitro, MFehi ATMs have higher cellular iron content. Therefore, even though MFehi ATMs have an M2-like iron-cycling phenotype based on their gene expression, their increased iron content is more reflective of M1-like ATMs. This contrast presents an opportunity to better understand the specific functional role for MFehi ATMs in regulating adipose tissue iron (11). We hypothesized that MFehi cells respond to iron perturbations in AT by regulating their intracellular iron pool in response to iron in the microenvironment and that this function is necessary to prevent adipocyte iron loading when excess iron is present.
To test this hypothesis, we looked at the response of MFehi ATMs, MFelo ATMs, and adipocytes in the context of two conditions of high iron: dietary iron and iron injection. Our studies demonstrate that MFehi ATMs increase their intracellular iron content, upregulate iron-handling genes, and recruit macrophages, both from the MFelo population and from the circulation, as a compensatory response to excess iron.
MATERIALS AND METHODS
Mice, diets, and iron injections.
All animal care procedures received approval from and followed the guidelines of the Vanderbilt University Institutional Animal Care and Use Committee. Experiments used male C57BL/6J mice from The Jackson Laboratory (Bar Harbor, ME). Animals were fed normal chow diet (NCD) except for the groups on the special iron diets, in which case they were fed macronutrient-matched iron diets that contained low iron levels (35 ppm iron; cat. no. TD-10211, Envigo), average iron (500 ppm; cat. no. TD-10212, Envigo), or high iron (2,000 ppm; cat. no. TD-10324, Envigo) for 8 wk starting at 8 wk of age. These dietary iron levels were selected because dietary iron as low as 25 ppm supports hematopoiesis in C57BL/6J mice, whereas around ~250 ppm is commonly found in chow diet (12, 27). Body weight and dietary intake were tracked, and mice were provided water and food ad libitum for the course of the study. For iron injection studies, mice were injected intraperitoneally (IP) with iron dextran-100 (Durvet), 5 mg iron/kg body weight, 1 wk before euthanization of the mice. The control group was injected with an equivalent volume of saline.
PKH26 cell stain.
The PKH26 Red Fluorescent Cell Linker (Sigma) is selectively phagocytized by macrophages and neutrophils when they ingest the dye aggregate. The dye is resistant to metabolism and sustained in vivo for multiple months. This method can be used to stain all cells at a given time point, followed by a washout period, and any non-PKH cells are considered to be recruited after the time of injection. Twelve-week-old mice were injected intraperitoneally with 1 ml of 5 μM PKH26. Control groups were injected with an equal volume of the diluent. Following a 2-day washout period, mice were injected with either saline or iron, as described.
Glucose tolerance.
Lean mass was quantified using a body composition values from the Minispec Model mq7.5 (Bruker). Glucose tolerance was determined by IP injection of dextrose at 2 mg/kg lean mass and subsequent tail vein blood glucose quantification over a 2-h time course.
SVF and adipocyte isolation.
Mice were euthanized by isoflurane overdose and cervical dislocation, then perfused with 20 ml PBS through the left ventricle. Unless otherwise specified, ATMs were collected from epididymal adipose tissue (eAT). The fat pads were collected, minced, and digested in 6 ml of 2-mg/L type II collagenase (cat. no. C6885, Sigma) for 40 min at 37°C. The stromal vascular fraction (SVF) was separated from adipocytes by centrifugation followed by erythrocyte lysis with ACK buffer, as previously described (23). The top adipocyte layer was transferred to a new vial and washed, then pelleted for either iron quantification or gene expression analysis.
Adipocyte size quantification.
Paraffin-embedded tissues from the iron diet studies were sectioned and stained with toluidine blue, then digitally imaged at the Vanderbilt Digital Histology Core. Adipocyte area was quantified in four sections per mouse (n = 4 per group) using a segmentation program with the MorphoLibJ plug-in of FIJI (http://imagej.net/MorphoLibJ).
Magnetic sorting and fluorescence-activated cell sorting.
The SVF was treated with Fc block (BD Biosciences) for 10 min and then stained with an appropriate combination of fluorophore-conjugated antibodies against cell-surface markers for 30 min at 4°C; F4/80-APC (eBioscience), F4/80-BV785 (BioLegend), CD11b-FITC (eBioscience), CD11b-APC/Cy7 (BD Biosciences), CD45-BV605 (BioLegend), CD45-PE (eBioscience), CD163-CF594 (antibody kindly provided by Dr. Soren Moestrup, Aarhus University, Aarhus, Denmark, conjugated using the Mix-n-Stain CF594 kit, Biotium). Cells were washed in fluorescence-activated cell sorter (FACS) buffer to make a single-cell suspension. Cells were then sorted by their ferromagnetic qualities through the sensitive positive selection (possel_s) program on the AutoMACS magnetic activated cells-sorting system (Miltenyi Biotec). After separation, the magnetic and nonmagnetic fractions were centrifuged at 500 g for 10 min at 4°C, resuspended with a live/dead marker (DAPI or prodidium iodide) and spiked with 50 μL of CountBright counting beads (Thermo Fisher Life Science). The samples were then analyzed with either the LSRFortessa flow cytometer (BD Biosciences) or sorted with the FACSAria III cell sorter (BD Biosciences) with appropriate fluorescence minus one controls.
Iron visualization and quantification.
Iron was visualized in paraffin-embedded eAT using the Perls’ Prussian blue staining method. Adipose tissue was sectioned to 10 μm, cleared, hydrated, and stained with Prussian blue staining solution (10% hydrochloric acid, 10% Prussian blue) for 20 min, then counterstained with nuclear fast red for 5 min. Iron was quantified in MFehi and MFelo macrophages with double-focusing sector field high-resolution inductively-coupled mass spectrometry (ICP-MS; ELEMENT II, Thermo Fisher Scientific, Bremen, Germany) equipped with ESI auto sampler. To quantify iron in adipocytes, the adipocyte fraction of the eAT fat pad was collected and pelleted, as described above. For atomic absorption spectrometry (AAS), samples were homogenized in 100 μl radioimmunoprecipitation assay buffer for bicinchoninic assay protein analysis, digested in 1:2 (vol/vol) ultrapure HNO3, and further diluted in 2% nitric acid. Internal standardization was performed with bovine liver (184 μg Fe/g; National Bureau of Standards, Standard Reference Material, United States Department of Commerce, Washington, DC). To perform ICP-MS, samples were homogenized in 2% SDS RIPA buffer, and an aliquot was collected to quantify protein concentration by bicinchoninic acid assay. The remaining sample was digested in ultra-pure HNO3 [1:3 (vol/vol) dilution] for 12 h at 60°F, then diluted with milliQ water for ICP-MS quantification at the Vanderbilt Mass Spectrometry Core Laboratory. Quantification of adipocyte iron was compared between ICP-MS and AAS, with no significant difference found between the two methods (data not shown).
RNA isolation and real-time RT-PCR.
Macrophages were collected via FACS as described above, pelleted, and resuspended in RLT buffer to allow for RNA extraction with the RNeasy Micro RNA kit (Qiagen), according to the manufacturers instructions. Adipocytes were collected as described above, but the final pellet was collected in TRIzol reagent (Invitrogen) and isolated with the Direct-zol RNA MiniPrep kit (Genesee). For both macrophage and adipocytes, cDNA was synthesized with the iScript cDNA synthesis kit (BioRad) and real-time RT-PCR was performed with the Taqman assay system (Applied Biosystems) on a CFX96 cycler (BioRad). Gene expression was normalized to glyceraldehyde-3-phosphate dehydrogenase using the 2−∆∆Ct method.
Serum iron and hormone parameters.
Iron, transferrin, ferritin, and total iron-binding capacity were quantified from serum using the ACE Alera clinical chemistry system (Alfa Wasserman).
Statistics.
Data are given as means ± SE. Statistical tests were performed using GraphPad Prism (La Jolla, CA) by two-tailed unpaired t tests and one-way ANOVA with the Tukey correction for multiple comparisons, when appropriate.
RESULTS
MFehi ATMs accumulate iron with high-iron diet.
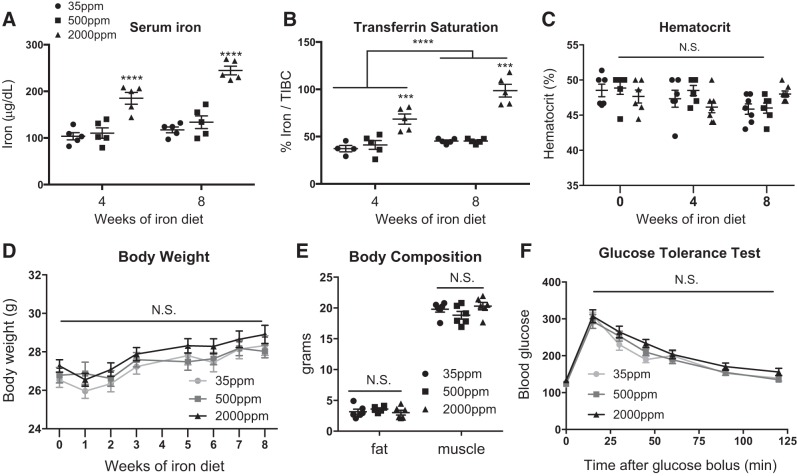
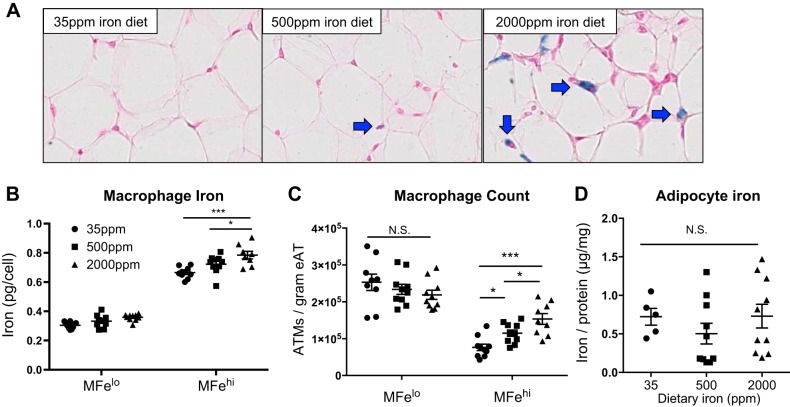
On the basis of our previous description of the MFehi ATM iron-cycling phenotype, we hypothesized that MFehi ATMs would respond to changes in iron concentrations in the adipose environment. We sought to determine if MFehi ATMs would respond to systemic changes in iron provided through a high-iron diet. After 8 wk on low-, average-, or high-iron diet, we noted systemic iron overload with increased serum iron and transferrin saturation (Fig. 1, A and B; P < 0.0001) but no change in hematocrit (Fig. 1C). Varying concentrations of dietary iron caused no changes in weight gain, body composition, or glucose tolerance (Fig. 1, D–F). Dietary iron concentrations positively correlated with the number of iron-laden cells in the SVF of eAT, as seen by Prussian blue staining (Fig. 2A). Using ICP-MS quantification, iron content per cell positively correlated with dietary iron (Fig. 2B; P < 0.05, 35 ppm vs. 2,000 ppm; P < 0.05, 500 ppm vs. 2,000 ppm). There was also a significant increase in the total count of MFehi ATMs from low to average to high iron, with 7.6 × 10⁴, 1.1 × 10⁵, and 1.5 × 10⁵ per gram tissue, respectively (Fig. 2C; P < 0.05, 35 ppm vs. 500 ppm; P < 0.05, 500 ppm vs. 2,000 ppm; P < 0.001, 35 ppm vs. 2,000 ppm). Neither MFelo ATMs nor adipocytes had an increase in iron content (Fig. 2, C and D). Adipocyte iron was quantified using both AAS and ICP-MS methods in two separate experiments to ensure rigor and reproducibility of this finding, with no significant differences between the two methods (data not shown). The size of the adipocytes was 1,017 ± 103, 1,004 ± 22, and 946 ± 97 μm2, low to high iron respectively, with no significant difference between the groups.
Fig. 1.
Physiological and serum iron parameters from mice fed diets with varying levels of iron. C57BL/6J mice were given 8 wk of low (35 ppm), average (500 ppm), and high (2,000 ppm) iron diets. A–C: serum iron parameters such as serum iron (A) (n = 5), transferrin saturation calculated as % iron/total iron-binding capacity (B) (TIBC; n = 4–6), and hematocrit (C) (n = 6) were quantified. D: body weight was recorded over the study course (n = 18–22). E and F: body composition (E) (n = 6) and glucose tolerance (F) tests were performed after 8 wk on diet (n = 6). For all studies, significant differences were identified using ANOVA and t-test, with the following P-value indicators: ***P < 0.001, ****P < 0.0001. NS, not significant.
Fig. 2.
Effect of 8 wk of iron diet feeding on adipose tissue macrophage (ATM; MFehi and MFelo) and adipocyte iron content. C57BL/6J mice were on 8 wk of low (35 ppm), average (500 ppm), and high (2,000 ppm) iron diet. A: whole adipose tissue (AT) was fixed and sectioned, then stained with Prussian blue to visualize iron and counterstained with nuclear fast red. B–D: cells were sorted to quantify iron content per ATM (B) (n = 8–10), ATMs per gram of tissue (C), and adipocyte iron content (D) (n = 8–10). For all studies, significant differences were identified using ANOVA and t-test, with the following P-value indicators: *P < 0.05, ***P < 0.001. eAT, epididymal adipose tissue. NS, not significant.
MFehi respond to high dietary iron by upregulating iron-storage genes.
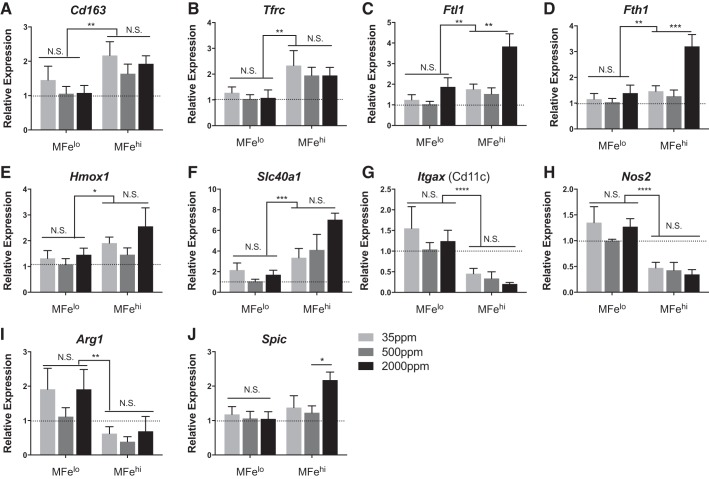
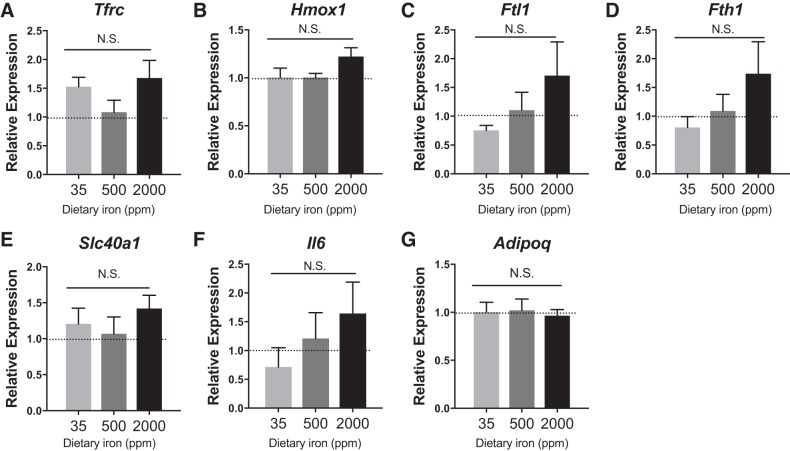
To assess the transcriptional response to iron availability, MFehi, MFelo, and adipocytes were collected for gene expression from mice fed varying levels of dietary iron. Expression of iron-uptake genes Cd163 and Tfrc, iron processing Hmox1, and iron export Slc40a1 were greater in MFehi ATMs compared with MFelo ATMs across all concentrations of dietary iron (Fig. 3). Furthermore, MFehi were generally more M2 polarized, with lower expression of Itgax and Nos2 compared with MFelo. In response to excess dietary iron, the MFehi population had an increase in expression of iron-storage-associated genes Ftl1 and Fth1, significant by two-way ANOVA with a P < 0.01 between cell types and P < 0.01 between diets (Fig. 3). Lastly, in response to high dietary iron, the MFehi population expressed higher levels of Spic, a transcription factor required for development of iron-handling macrophages in the spleen and bone marrow (10). In contrast, MFelo ATMs had no change in iron-handling-gene expression levels due to increased iron (Fig. 3). Similarly, there was no difference in adipocyte iron-handling genes upon dietary iron challenge, although a trend for an increase in Ftl1, Fth1, and Il6 was noted (Fig. 4). Importantly, Adipoq expression was not different between groups.
Fig. 3.
Effect of 8 wk of iron diet feeding on adipose tissue macrophage (ATM; MFehi and MFelo) gene expression. C57BL/6 mice were on 8 wk of low (35 ppm), average (500 ppm), and high (2,000 ppm) iron diet. A–J: iron-handling genes were quantified by RT-PCR for MFelo and MFehi ATMs (n = 4–5). Results were normalized to MFelo expression in the average (500 ppm) iron diet. For all studies, significant differences were identified using ANOVA and t-test, with the following P-value indicators: *P < 0.05, **P < 0.01, ***P < 0.001, ****P < 0.0001. NS, not significant.
Fig. 4.
Adipocyte gene expression after 8 wk on iron diets. C57BL/6J mice were on 8 wk of low (35 ppm), average (500 ppm), and high (2,000 ppm) iron diet. A–G: iron-handling genes were quantified by RT-PCR (n = 4–5). For all studies, significant differences were identified using ANOVA and t-test. NS, not significant.
Excess peritoneal iron is taken up by ATMs, not by adipocytes.
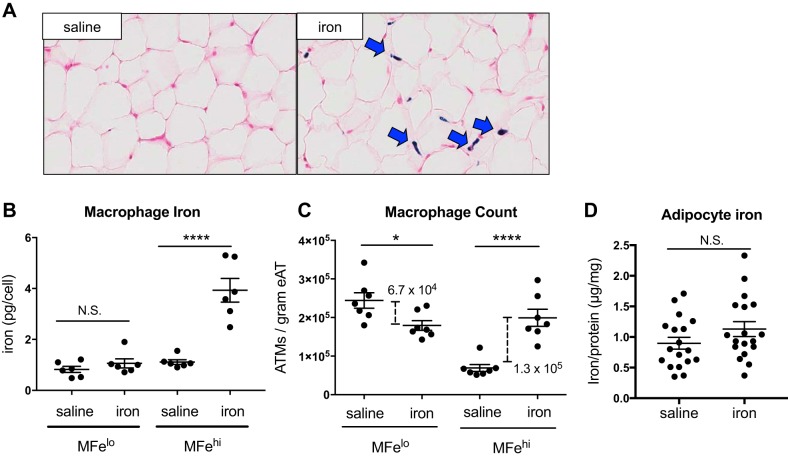
Iron absorption is regulated through the intestinal tract, limiting dietary iron administration by the absorptive capacity. IP iron administration provides a direct way to provide higher iron levels to the peritoneum in a more controllable manner. This method was used to demonstrate our proof-of-concept that ATMs compensate for excess iron as IP iron administration circumvents some of the systemic and absorptive factors present with iron diet models. In iron-injected mice, there was a visible increase in SVF iron content by Prussian blue staining (Fig. 5A). MFehi had a significant increase in intracellular iron content (P < 0.0001), whereas MFelo ATM iron content did not change (Fig. 5B). Interestingly, the number of MFelo cells per gram eAT was decreased (by 6.7 × 10⁴; P < 0.05); whereas conversely, the number of MFehi cells/gram eAT was increased (by 1.3 × 10⁵; P < 0.0001; Fig. 5C). Most importantly, quantified by both AAS and ICP-MS, adipocyte intracellular iron was not altered by the acute high-dose injection of iron (Fig. 5D).
Fig. 5.
Effect of iron injection on adipose tissue macrophage (ATM; MFehi and MFelo) and adipocyte iron content. C57BL/6J mice were given an IP injection of 5 mg/kg iron-dextran 1 wk prior to euthanization. A: whole adipose tissue (AT) was fixed and sectioned, then stained with Prussian blue to visualize iron and counterstained with nuclear red. B–D: cells were sorted to quantify iron content per ATM (B) (n = 6), ATMs per gram of tissue (C) (n = 7), and adipocyte iron content (D) (n = 18). For all studies, significant differences were identified using ANOVA and t-test, with the following P-value indicators: *P < 0.05, ****P < 0.0001. NS, not significant.
MFehi ATMs respond to an acute high dose of iron with alterations in iron-handling genes.
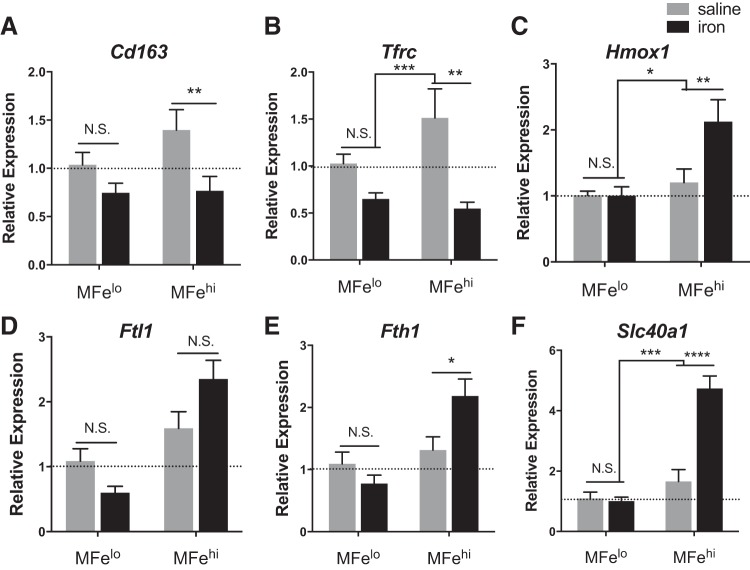
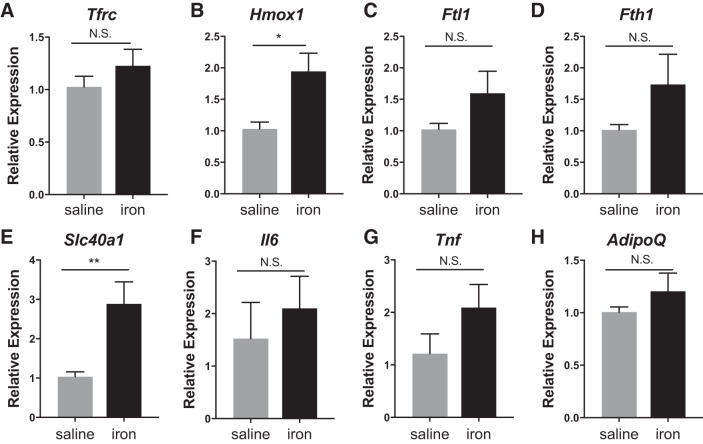
The MFehi ATMs respond to iron injections by altering their iron-handling genes. Iron-import genes Cd163 (P < 0.01) and Tfrc (P < 0.01) decreased, whereas the iron-storage gene Fth1 (P < 0.05), iron-metabolism gene Hmox1 (P < 0.01), and the iron-export gene Slc40a1 (P < 0.0001) were all increased (Fig. 6). Interestingly, in ANOVA analysis comparing the effect or the iron injection to the cell type, the iron effect drove the significant difference for all genes except Fth1. This is in contrast to MFelo, which showed no significant difference in any of the iron-handling genes in response to IP iron (Fig. 6). Reflecting their unaltered iron content, adipocytes did not have significant changes in the iron-handling genes Fth1 or Ftl1 (although there was a trend toward an increase), but they did have an elevation of Hmox1 (P < 0.05) and Slc40a1 (P < 0.01) (Fig. 7). Importantly, Adipoq and Il6, indicators of inflammation and dysfunction in adipocytes, were unchanged.
Fig. 6.
Effect of iron injection on adipose tissue macrophage (ATM; MFehi and MFelo) gene expression. C57BL/6J mice were given an IP injection of 5 mg/kg iron-dextran 1 wk before they were euthanized. A–F: iron-handling genes were quantified by RT-PCR for MFelo and MFehi ATMs (n = 6). For all studies, significant differences were identified using ANOVA and t-test, with the following P-value indicators: *P < 0.05, **P < 0.01, ***P < 0.001, ****P < 0.0001. NS, not significant.
Fig. 7.
Effect of iron injection on adipocyte gene expression. C57BL/6J mice were given an IP injection of 5 mg/kg iron 1 wk before they were euthanized. A–H: adipocytes were isolated, RNA prepared, and iron-handling genes quantified by RT-PCR (n = 6). For all studies, significant differences were identified using ANOVA and t-test, with the following P-value indicators: *P < 0.05, **P < 0.01. NS, not significant.
ATM cell counts respond to iron injection.
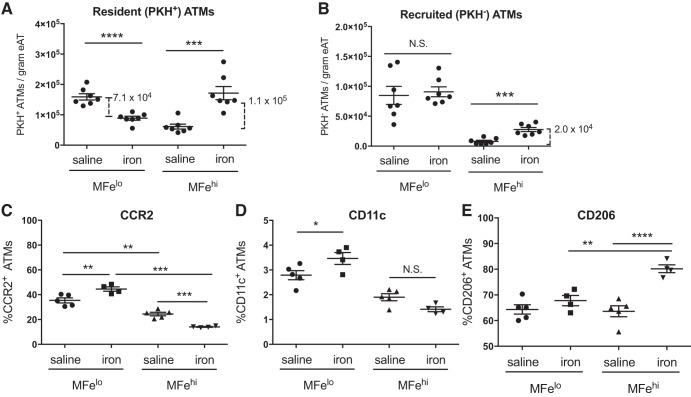
The increase in count of MFehi ATMs may be explained by three primary mechanisms: 1) Monocytes are recruited and become MFehi ATMs, 2) MFelo ATMs take up enough excess iron to essentially convert into MFehi cells, and 3) MFehi ATMs undergo cellular proliferation. We used the cell tracer PKH26 to address the first two possibilities. PKH26 is readily taken up by phagocytic cells and can be used to mark resident macrophages in peritoneal tissues by IP injection. Therefore, any PKH26-stained (PKH+) cell detected at the end of the study must have been present at the time of PKH26 injection. In contrast, an increase in PKH26-negative (PKH−) represents monocyte-derived macrophages recruited after the time of PKH26 injection. Reciprocal changes in counts of PKH+ MFehi or MFelo ATMs could indicate a shift between the two populations. We combined PKH26-mediated cell tracing with the 1-wk iron injection model to understand whether changes in the ATM cell counts were due to shifts in iron-containing populations or due to monocyte recruitment. At 1 wk after iron injection, 78% of all macrophages were PKH positive. The count of resident PKH+ MFelo ATMs decreased by 7.1 × 10⁴ cells/gram tissue, and PKH+ MFehi ATMs increased by 1.1 × 10⁵ cells/gram tissue (Fig. 8A). This shift accounted for 83% of the total difference in MFehi (Fig. 5C). Of the recruited PKH− ATMs, there was no difference in MFelo ATMs. Interestingly, almost no MFehi macrophages were recruited in the absence of iron injection; however, 2.0 × 10⁴ PKH− MFehi ATMs/gram tissue were recruited upon iron injection (Fig. 8B; P < 0.001). On the basis of these results, monocyte recruitment accounts for 17% of the increase in MFehi in response to iron injections. Thus, our PKH studies reveal that shifts in ATM populations from MFelo to MFehi ATMs and monocyte recruitment fully account for the increase in MFehi following iron injection.
Fig. 8.
Effect of iron injection on adipose MFehi and MFelo inflammatory markers and recruitment. Adipose tissue macrophages (ATMs) were marked with PKH26 before iron injection to assess for population shifts as quantified by the resident PKH+ ATMs (A) and monocyte recruitment as quantified by PKH− ATMs (B) (n = 7). MFehi and MFelo polarization response to iron injection was quantified by cell-surface inflammatory markers, including M1-associated CCR2 (C) and CD11c (D), as well as M2-associated CD206 (E) (n = 4–6). For all studies, significant differences were identified using ANOVA and t-test, with the following P-value indicators: *P < 0.05, **P < 0.01, ***P < 0.001, ****P < 0.0001. eAT, epididymal adipose tissue. NS, not significant.
Iron uptake by ATMs is associated with M2 polarization.
MFelo incorporation into the ferromagnetic fraction accounts for the majority of the increase in MFehi population following iron injection. Because the MFelo have reduced M2-like phenotype compared with MFehi, we hypothesized that their incorporation into the MFehi pool would shift the overall polarization state of the MFehi population to lower expression of M2-associated proteins. However, the opposite was true; in iron-injected mice, the MFehi ATMs had a decrease in cells positive for inflammation-associated surface markers (CCR2, CD11c) and an increased in cells with M2-associated marker CD206 (Fig. 8, C–E). In contrast, there was a decrease in the count of MFelo ATMs positive for CCR2 and CD11c and no change in CD206 (Fig. 8, C–E). The findings indicate that iron uptake does not drive an inflammatory profile in macrophages MFehi cells, whereas it does in MFelo. Thus, even with MFelo incorporation into the MFehi population, the MFehi profile is even more M2-like post iron injection.
DISCUSSION
Reflecting the field’s current interest in macrophage polarization and iron handling by tissue-associated macrophages, we challenged MFehi ATMs with excess iron to investigate their functional role in maintaining AT iron levels. We approached this by supplying iron through a dietary route as well as direct IP injection. Dietary iron provision has commonly been used in other studies, often over a course of 8 wk, and with nonheme sources of iron because mice cannot absorb heme iron (8). Although systemic iron loading does occur consistently in dietary iron studies, the metabolic impact has been variable. McClain and colleagues provided high-, normal- and low-iron diets (20,000 mg/kg, 330 mg/kg, and 7 mg/kg carbonyl iron, respectively) to C57BL/6 mice for 8 wk and observed a 40% decrease in Tfrc in adipocytes, 30% decrease in Adipoq, and an overall decrease in fat mass and increase in lean mass (9). These changes were associated with increased oxygen consumption by high-iron-diet mice and were adiponectin dependent. However, in our studies, we saw no impact of dietary iron on body weight or fat mass. We also noted no impact on glucose tolerance or difference in adipocyte gene expression. The most likely explanation for this difference is that our high-iron-diet model had 10-fold lower iron than the McClain study. To confirm iron loading, we quantified serum iron and transferrin saturation, and the increased iron levels were further confirmed by the increased iron content we saw in MFehi ATMs themselves. We recognized that the adipocyte iron content had high variability. This may be due to the need to standardize the iron quantification to cellular protein. Furthermore, variability in adipocyte iron content appears to be a common finding in this type of study (3). A second concern with this technique is the possibility that high-iron adipocytes are lost during the adipocyte collection process, selecting for adipocytes that are not iron loaded. However, at this time, there are no alternative methodologies for collecting adipocytes. Even given these limitations, our studies highlight the fact that MFehi macrophages in AT appear to take on the role of dealing with changes in local iron content.
We were interested in the proof-of-concept that MFehi ATMs accommodate for excess iron. Therefore, we gave iron-dextran at supraphysiological doses. Even as a model of excess iron, iron-dextran injection is medically relevant, as both iron-dextran and superparamagnetic iron oxide nanoparticles have been commonly used in humans to treat anemia and interestingly, accumulate in AT (16, 24). Iron-dextran is processed in a similar manner to hemoglobin iron, and has not been associated with cardiac dysfunction in C57BL/6 mice, presumably because they are able to excrete some of the excess iron in the feces (22). The type of iron processed by macrophages also influences their phenotype and could explain some of the contradictions between studies describing “iron-cycling” macrophages in vitro and different tissues. In tissues closely associated with the reticular system, such as spleen, vasculature, and muscle, heme-associated iron is abundantly recycled by macrophages. Heme uptake liberates ferrous iron, and M2 macrophages respond by enhancing their oxidative stress pathways, Hmox1, and Fpn (4). In fact, CD163hi macrophages (Mhem) have been described as being protected from oxidative stress and less prone to lipid accumulation (2). In these systems, the recycling of iron from heme can be provisional to red blood cell production or wound healing, and the degradation process is inherently anti-inflammatory. However, most in vitro studies of macrophage iron handling have been performed with sources of ferric iron or transferrin-bound iron. AT is known to have very low levels of hemolysis. Therefore, we postulated that transferrin-bound iron is the primary source of iron for macrophages, whether from serum or adjacent cells, but this area warrants further analysis.
Macrophages have been co-opted by many tissues to perform homeostatic functions outside of their typical immunological role. What is especially unique about these functions is that they allow for fine-tuned hemostatic regulation in tissues, often uncoupled from systemic physiology. For example, Corna et al. (7) used a macrophage-specific Fpn knockdown model in muscle damage. Even though the macrophages became iron loaded, they still accumulated at the site of damage and did not become oxidatively stressed. Importantly, in this model in which export of iron was impaired, myofiber regeneration was limited. In these studies, changes in expression levels of iron-associated genes in the muscle were not associated with changes in systemic iron homeostasis, indicating that there was an independent microenvironmental homeostasis between the tissue and resident macrophages. Similarly, in human atherosclerotic plaques, M2 macrophages process the iron released from hemolysis (1). Our results indicate that ATMs respond to excess iron, preventing iron overload in adipocytes. Even though adipocytes had increased expression of Slc40a1, the gene for the iron exporter ferroportin, and trends in Fth/Ftl, they had no increase in intracellular iron or inflammatory markers. So, even if the adipocytes did uptake iron, they were able to release this iron, and it was primarily taken up by MFehi. Interestingly, with acute iron injection, the MFehi had an M2-like iron-cycling phenotype (i.e., increased Tfrc, Slc40a1) (Fig. 6), whereas, in the chronic iron diet studies, MFehi mainly had increased expression of M1-like iron-storage genes Fth1/Ftl1 (Fig. 3). However, in both contexts, MFehi ATMs accrued higher levels of iron. This may indicate a temporality to the response of these ATMs to take up and store iron effectively.
The functional adaptability of macrophages has been linked to their phenotypic flexibility. Generally, the polarization state of macrophages is associated with different responses to iron: M1 macrophages dogmatically sequester iron as a bacteriostatic mechanism, and M2 macrophages take up and release iron quickly. Studies have demonstrated that iron handling by macrophages can be impacted simply by altering their polarization stimuli (6, 25). However, there is a complex and reciprocal relationship between the phenotype of macrophages and their response to iron. For example, when macrophages are iron loaded because of Fpn deficiency, they respond to inflammatory stimulation with increased inflammatory cytokine expression (32). This effect is iron dependent, as it can be ameliorated in the presence of an iron chelator (32). In contrast, iron-loaded M2-polarized macrophages have high expression of iron-uptake and iron-export genes, even in the presence of excess iron (6). The shift in iron-handling-gene expression can be tied back to a change in the binding of iron regulatory proteins in response to iron levels (31). In human M2-polarized macrophages, simply chelating intracellular iron can shift M2 macrophages from an iron-cycling phenotype (higher import/export genes) to an iron-storage phenotype (higher Ft) (17). Some of these differences are also seen in vivo. For example, the M2-polarized macrophages seen in atherosclerotic plaques have an iron-cycling profile, and they are quick to release iron rather than accrue it (1). The “iron-cycling” phenotype has been shown to play an important role in certain tissues because the macrophages can take up and release iron as needed and seemingly without an inflammatory response. Considering these findings, it is surprising that the iron-storing MFehi ATM population is not only very strongly M2-polarized but also maintains this polarization even while accumulating iron. We noted that MFehi ATMs were able to take up and sequester the excess iron provided through diet or injection and are in line with the macrophage response in muscle damage, in which Fpn knockout macrophages load iron, even without oxidative stress (7). In fact, the M2 macrophage phenotype in tissues may be more complex than the stereotypical iron-handling dichotomy described for M1 and M2. We observed an increase in Fth in response to iron injection, reflecting a protective response by MFehi ATMs. Furthermore, even with iron loading, MFehi ATMs did not take on a more inflammatory profile. This contrasts studies in liver and alveolar macrophages, in which iron loading of macrophages is associated with increased inflammation (29). Indeed, comparing resident macrophages from different tissues highlights the adaptability and specification of macrophages. Our understanding of the iron-cycling phenotype of the MFehi ATMs is limited by our inability to assess iron-related proteins specifically in these cells because of their low numbers. This restricts us to the use of flow cytometry and gene expression to assess the phenotype of the cells rather than Western blot. In future studies, it would be ideal to develop a method for assessing iron-response protein levels because a cell’s iron response is primarily driven through the iron-response protein system, such that level of these proteins is the most sensitive and accurate way of determining the iron status of a cell. Despite this limitation, the observation that MFehi take up excess iron and yet remain M2 polarized suggests a specialized function for this unique cell population.
Following iron injection, there was an increase in MFehi per gram of tissue, with a reciprocal decrease in MFelo. Increased MFehi were also observed with iron diets, but the effect was more subtle. In fact, PKH26 staining of resident macrophages allowed us to deduce that the enlarged MFehi population was likely because of MFelo cell “conversion” to MFehi. The MFehi population is defined by positive magnetic sorting, but relative to MFelo, MFehi were also found to have extreme M2 polarization by gene expression and flow cytometry (23). With more cells adhering to the magnet, we cannot conclude if the uptake of iron by MFelo represents a conversion in ATM subtypes or simply paramagnetic qualities of MFelo because of iron uptake. There are no known methods that would allow us to trace MFehi versus MFelo. However, we would predict that if the MFehi population became enriched with MFelo, the average polarization profile would shift away from the extreme M2 polarization. What we found was that overall polarization markers indicate the MFehi are on average more M2 polarized with iron uptake, even with newly incorporated MFelo cells. This suggests that the MFelo cells incorporated into the MFehi pool are not simply paramagnetic but may be changing their actual phenotype and function. This contradicts other studies that show inflammatory polarization of macrophages with iron treatment. Therefore, we hypothesize that a unique conversion of macrophages may be occurring with excess iron in adipose tissue. Interestingly, we noted an increase in the expression of Spic in MFehi in our iron diet studies. This protein is developmentally required for the development of two types of iron-handling macrophages: splenic red pulp macrophages and bone marrow macrophages. This may demonstrate a mechanism by which either MFelo ATMs or recruited monocytes are converting to the MFehi phenotype.
Our studies further explore a role for a subtype of ATMs in taking up and processing iron to protect adipocytes from iron overload. Using dietary and IP iron overload we demonstrated that MFehi ATMs are able to fully compensate for excess iron in the AT. As part of this response, the MFehi pool expands to include iron-loaded MFelo that have shifted to a stronger M2 phenotype. Furthermore, circulating monocytes are also recruited to the MFehi pool. These findings expand our understanding of iron handling by macrophages beyond the classic M1/M2 paradigm. In conjunction with other studies in the field, this further demonstrates the importance of fine-tuned iron regulation for adipocytes and the intimate homeostatic relationship between macrophages and adipocytes. It is thought that iron release by M2 macrophages allows for cellular proliferation. For example, in coculture studies, media from human M2-polarized cells supported cancerous growth, and this effect was reversible with iron chelation (25). Similarly, studies have shown that iron is necessary for adipogenesis (18). Therefore, future studies in this area will look at the interaction of resident macrophages in AT and their role in iron homeostasis in the context of adipogenesis.
GRANTS
A. H. Hasty is supported by Veterans Affairs Merit Award 5I01BX002195 and American Diabetes Association Innovative Basic Science Award 1-17-IBS-140. M. J. Hubler is supported by NIH National Institute of Diabetes and Digestive and Kidney Diseases (NIDDK) Grant F30 DK103438. Research reported in this publication was supported by NIH National Institute of General Medical Science Award T32 GM007347. A. J. Kennedy is supported by NIH National Heart, Lung, and Blood Institute Award K01 HL121010. The Vanderbilt Medical Center Flow Cytometry Shared Resource is supported by the Vanderbilt Ingram Cancer Center (National Cancer Institute Grant P30 CA68485) and the Vanderbilt Digestive Disease Research Center (NIDDK Grant DK058404).
DISCLOSURES
No conflicts of interest, financial or otherwise, are declared by the authors.
AUTHOR CONTRIBUTIONS
M.J.H. and A.H.H. conceived and designed research; M.J.H., K.M.E., and A.J.K. performed experiments; M.J.H. and A.H.H. analyzed data; M.J.H., A.J.K., and A.H.H. interpreted results of experiments; M.J.H. prepared figures; M.J.H. and A.H.H. drafted manuscript; M.J.H., K.M.E., A.J.K., and A.H.H. edited and revised manuscript; M.J.H., K.M.E., A.J.K., and A.H.H. approved final version of manuscript.
ACKNOWLEDGMENTS
We thank Melissa Totten in the laboratory of Dr. Keith Erikson for assistance in quantifying adipocyte iron content by atomic absorption spectrometry. Inductively coupled mass spectrometry was performed by Dr. Y. Zhang at the Vanderbilt Mass Spectrometry Core Laboratory. Flow cytometry experiments were performed in the Vanderbilt Medical Center Flow Cytometry Shared Resource.
REFERENCES
- 1.Bories G, Colin S, Vanhoutte J, Derudas B, Copin C, Fanchon M, Daoudi M, Belloy L, Haulon S, Zawadzki C, Jude B, Staels B, Chinetti-Gbaguidi G. Liver X receptor activation stimulates iron export in human alternative macrophages. Circ Res 113: 1196–1205, 2013. doi: 10.1161/CIRCRESAHA.113.301656. [DOI] [PMC free article] [PubMed] [Google Scholar]
- 2.Boyle JJ, Johns M, Kampfer T, Nguyen AT, Game L, Schaer DJ, Mason JC, Haskard DO. Activating transcription factor 1 directs Mhem atheroprotective macrophages through coordinated iron handling and foam cell protection. Circ Res 110: 20–33, 2012. doi: 10.1161/CIRCRESAHA.111.247577. [DOI] [PubMed] [Google Scholar]
- 3.Britton L, Jaskowski LA, Bridle K, Secondes E, Wallace D, Santrampurwala N, Reiling J, Miller G, Mangiafico S, Andrikopoulos S, Subramaniam VN, Crawford D. Ferroportin expression in adipocytes does not contribute to iron homeostasis or metabolic responses to a high calorie diet. Cell Mol Gastroenterol Hepatol 5: 319–331, 2018. doi: 10.1016/j.jcmgh.2018.01.005. [DOI] [PMC free article] [PubMed] [Google Scholar]
- 4.Cairo G, Recalcati S, Mantovani A, Locati M. Iron trafficking and metabolism in macrophages: contribution to the polarized phenotype. Trends Immunol 32: 241–247, 2011. doi: 10.1016/j.it.2011.03.007. [DOI] [PubMed] [Google Scholar]
- 5.Coffey R, Ganz T. Iron homeostasis: an anthropocentric perspective. J Biol Chem 292: 12727–12734, 2017. doi: 10.1074/jbc.R117.781823. [DOI] [PMC free article] [PubMed] [Google Scholar]
- 6.Corna G, Campana L, Pignatti E, Castiglioni A, Tagliafico E, Bosurgi L, Campanella A, Brunelli S, Manfredi AA, Apostoli P, Silvestri L, Camaschella C, Rovere-Querini P. Polarization dictates iron handling by inflammatory and alternatively activated macrophages. Haematologica 95: 1814–1822, 2010. doi: 10.3324/haematol.2010.023879. [DOI] [PMC free article] [PubMed] [Google Scholar]
- 7.Corna G, Caserta I, Monno A, Apostoli P, Manfredi AA, Camaschella C, Rovere-Querini P. The repair of skeletal muscle requires iron recycling through macrophage ferroportin. J Immunol 197: 1914–1925, 2016. doi: 10.4049/jimmunol.1501417. [DOI] [PubMed] [Google Scholar]
- 8.Fillebeen C, Gkouvatsos K, Fragoso G, Calvé A, Garcia-Santos D, Buffler M, Becker C, Schümann K, Ponka P, Santos MM, Pantopoulos K. Mice are poor heme absorbers and do not require intestinal Hmox1 for dietary heme iron assimilation. Haematologica 100: e334–e337, 2015. doi: 10.3324/haematol.2015.126870. [DOI] [PMC free article] [PubMed] [Google Scholar]
- 9.Gabrielsen JS, Gao Y, Simcox JA, Huang J, Thorup D, Jones D, Cooksey RC, Gabrielsen D, Adams TD, Hunt SC, Hopkins PN, Cefalu WT, McClain DA. Adipocyte iron regulates adiponectin and insulin sensitivity. J Clin Invest 122: 3529–3540, 2012. doi: 10.1172/JCI44421. [DOI] [PMC free article] [PubMed] [Google Scholar]
- 10.Haldar M, Kohyama M, So AY, Kc W, Wu X, Briseño CG, Satpathy AT, Kretzer NM, Arase H, Rajasekaran NS, Wang L, Egawa T, Igarashi K, Baltimore D, Murphy TL, Murphy KM. Heme-mediated SPI-C induction promotes monocyte differentiation into iron-recycling macrophages. Cell 156: 1223–1234, 2014. doi: 10.1016/j.cell.2014.01.069. [DOI] [PMC free article] [PubMed] [Google Scholar]
- 11.Hubler MJ, Peterson KR, Hasty AH. Iron homeostasis: a new job for macrophages in adipose tissue? Trends Endocrinol Metab 26: 101–109, 2015. doi: 10.1016/j.tem.2014.12.005. [DOI] [PMC free article] [PubMed] [Google Scholar]
- 12.Knapka JJ, Smith KP, Judge FJ. Effect of open and closed formula rations on the performance of three strains of laboratory mice. Lab Anim Sci 24: 480–487, 1974. [PubMed] [Google Scholar]
- 13.Kratz M, Coats BR, Hisert KB, Hagman D, Mutskov V, Peris E, Schoenfelt KQ, Kuzma JN, Larson I, Billing PS, Landerholm RW, Crouthamel M, Gozal D, Hwang S, Singh PK, Becker L. Metabolic dysfunction drives a mechanistically distinct proinflammatory phenotype in adipose tissue macrophages. Cell Metab 20: 614–625, 2014. doi: 10.1016/j.cmet.2014.08.010. [DOI] [PMC free article] [PubMed] [Google Scholar]
- 14.Kroner A, Greenhalgh AD, Zarruk JG, Passos Dos Santos R, Gaestel M, David S. TNF and increased intracellular iron alter macrophage polarization to a detrimental M1 phenotype in the injured spinal cord. Neuron 83: 1098–1116, 2014. doi: 10.1016/j.neuron.2014.07.027. [DOI] [PubMed] [Google Scholar]
- 15.Lumeng CN, Bodzin JL, Saltiel AR. Obesity induces a phenotypic switch in adipose tissue macrophage polarization. J Clin Invest 117: 175–184, 2007. doi: 10.1172/JCI29881. [DOI] [PMC free article] [PubMed] [Google Scholar]
- 16.Mamula P, Piccoli DA, Peck SN, Markowitz JE, Baldassano RN. Total dose intravenous infusion of iron dextran for iron-deficiency anemia in children with inflammatory bowel disease. J Pediatr Gastroenterol Nutr 34: 286–290, 2002. doi: 10.1097/00005176-200203000-00011. [DOI] [PubMed] [Google Scholar]
- 17.Mertens C, Akam EA, Rehwald C, Brüne B, Tomat E, Jung M. Intracellular iron chelation modulates the macrophage iron phenotype with consequences on tumor progression. PLoS One 11: e0166164, 2016. doi: 10.1371/journal.pone.0166164. [DOI] [PMC free article] [PubMed] [Google Scholar]
- 18.Moreno-Navarrete JM, Ortega F, Moreno M, Ricart W, Fernández-Real JM. Fine-tuned iron availability is essential to achieve optimal adipocyte differentiation and mitochondrial biogenesis. Diabetologia 57: 1957–1967, 2014. doi: 10.1007/s00125-014-3298-5. [DOI] [PubMed] [Google Scholar]
- 19.Morris DL, Singer K, Lumeng CN. Adipose tissue macrophages: phenotypic plasticity and diversity in lean and obese states. Curr Opin Clin Nutr Metab Care 14: 341–346, 2011. doi: 10.1097/MCO.0b013e328347970b. [DOI] [PMC free article] [PubMed] [Google Scholar]
- 20.Murdolo G, Piroddi M, Luchetti F, Tortoioli C, Canonico B, Zerbinati C, Galli F, Iuliano L. Oxidative stress and lipid peroxidation by-products at the crossroad between adipose organ dysregulation and obesity-linked insulin resistance. Biochimie 95: 585–594, 2013. doi: 10.1016/j.biochi.2012.12.014. [DOI] [PubMed] [Google Scholar]
- 21.Murray PJ. Macrophage polarization. Annu Rev Physiol 79: 541–566, 2017. doi: 10.1146/annurev-physiol-022516-034339. [DOI] [PubMed] [Google Scholar]
- 22.Musumeci M, Maccari S, Massimi A, Stati T, Sestili P, Corritore E, Pastorelli A, Stacchini P, Marano G, Catalano L. Iron excretion in iron dextran-overloaded mice. Blood Transfus 12: 485–490, 2014. doi: 10.2450/2014.0288-13. [DOI] [PMC free article] [PubMed] [Google Scholar]
- 23.Orr JS, Kennedy A, Anderson-Baucum EK, Webb CD, Fordahl SC, Erikson KM, Zhang Y, Etzerodt A, Moestrup SK, Hasty AH. Obesity alters adipose tissue macrophage iron content and tissue iron distribution. Diabetes 63: 421–432, 2014. doi: 10.2337/db13-0213. [DOI] [PMC free article] [PubMed] [Google Scholar]
- 24.Pham BTT, Colvin EK, Pham NTH, Kim BJ, Fuller ES, Moon EA, Barbey R, Yuen S, Rickman BH, Bryce NS, Bickley S, Tanudji M, Jones SK, Howell VM, Hawkett BS. Biodistribution and clearance of stable superparamagnetic maghemite iron oxide nanoparticles in mice following intraperitoneal administration. Int J Mol Sci 19: 205, 2018. doi: 10.3390/ijms19010205. [DOI] [PMC free article] [PubMed] [Google Scholar]
- 25.Recalcati S, Locati M, Marini A, Santambrogio P, Zaninotto F, De Pizzol M, Zammataro L, Girelli D, Cairo G. Differential regulation of iron homeostasis during human macrophage polarized activation. Eur J Immunol 40: 824–835, 2010. doi: 10.1002/eji.200939889. [DOI] [PubMed] [Google Scholar]
- 26.Sierra-Filardi E, Vega MA, Sánchez-Mateos P, Corbí AL, Puig-Kröger A. Heme oxygenase-1 expression in M-CSF-polarized M2 macrophages contributes to LPS-induced IL-10 release. Immunobiology 215: 788–795, 2010. doi: 10.1016/j.imbio.2010.05.020. [DOI] [PubMed] [Google Scholar]
- 27.Sorbie J, Valberg LS. Iron balance in the mouse. Lab Anim Sci 24: 900–904, 1974. [PubMed] [Google Scholar]
- 28.Syrovatka P, Kraml P, Potockova J, Fialova L, Vejrazka M, Crkovska J, Andel M. Relationship between increased body iron stores, oxidative stress and insulin resistance in healthy men. Ann Nutr Metab 54: 268–274, 2009. doi: 10.1159/000229507. [DOI] [PubMed] [Google Scholar]
- 29.Tsukamoto H. Iron regulation of hepatic macrophage TNFalpha expression. Free Radic Biol Med 32: 309–313, 2002. doi: 10.1016/S0891-5849(01)00772-9. [DOI] [PubMed] [Google Scholar]
- 30.Weisberg SP, McCann D, Desai M, Rosenbaum M, Leibel RL, Ferrante AW Jr. Obesity is associated with macrophage accumulation in adipose tissue. J Clin Invest 112: 1796–1808, 2003. doi: 10.1172/JCI200319246. [DOI] [PMC free article] [PubMed] [Google Scholar]
- 31.Xu H, Barnes GT, Yang Q, Tan G, Yang D, Chou CJ, Sole J, Nichols A, Ross JS, Tartaglia LA, Chen H. Chronic inflammation in fat plays a crucial role in the development of obesity-related insulin resistance. J Clin Invest 112: 1821–1830, 2003. doi: 10.1172/JCI200319451. [DOI] [PMC free article] [PubMed] [Google Scholar]
- 32.Zhang Z, Zhang F, An P, Guo X, Shen Y, Tao Y, Wu Q, Zhang Y, Yu Y, Ning B, Nie G, Knutson MD, Anderson GJ, Wang F. Ferroportin1 deficiency in mouse macrophages impairs iron homeostasis and inflammatory responses. Blood 118: 1912–1922, 2011. doi: 10.1182/blood-2011-01-330324. [DOI] [PubMed] [Google Scholar]
- 33.Zheng J, Chen M, Liu G, Xu E, Chen H. Ablation of hephaestin and ceruloplasmin results in iron accumulation in adipocytes and type 2 diabetes. FEBS Lett 592: 394–401, 2018. doi: 10.1002/1873-3468.12978. [DOI] [PubMed] [Google Scholar]


