Abstract
Use of imaging fiber bundles for coherence-domain imaging has remained limited to date. In this work, we provide characterization of commercially available imaging bundles for coherence-domain imaging, by evaluating their modal structure for applicability to interferometric imaging. We further examine custom fabricated bundles developed in collaboration with a corporate partner for their ability to reduce interelement optical path length variability and cross talk between elements. The results presented here will serve as a useful guide for comparing fiber bundles for coherence imaging while also offering an improved understanding of the functionality and limitations of ismaging bundles for advancing coherent imaging technologies.
Keywords: (060.2310) Fiber optics, (060.2350) Fiber optics imaging, (110.1650) Coherence imaging, (110.4500) Optical coherence tomography
1. INTRODUCTION
Coherence-based imaging and detection schemes have become widely used in recent years for biomedical imaging. Techniques such as optical coherence tomography (OCT) [1–3] and angle-resolved low-coherence interferometry (a/LCI) [4–6] rely on the precise delivery and collection of single-mode illumination to image biological tissues, providing information on epithelial substructure [7,8] and nuclear morphology [9]. Typically, single-mode fibers are used to transmit coherent light, with high throughput and rejection of all but the fundamental mode. Unfortunately, single-mode fiber presents limitations to optical design. By its nature, light is delivered to a single spatial point, preventing whole-image acquisition without multiplexing in time using galvanometric scanning mirrors [10,11] or in space with multifiber arrays [12,13]. Galvanometric scanning schemes are well-established in OCT, but not easily implemented in the compact form factor required for endoscopic imaging. Pullback and radial scanning systems present an attractive alternative for endoscopic scanning [14] but require highly specialized components to function. Multifiber arrays have been suggested as an alternative, although the large cladding diameter (125 μm standard) of single-mode fibers prevents adequate spatial sampling. Each individual fiber must also be precisely matched in optical path length (OPL), which is time consuming and difficult to implement.
Imaging fiber bundles present a compelling format for coherence-domain imaging. Imaging bundles (also referred to as coherent bundles) are complex structures consisting of hundreds to thousands of cylindrical waveguides within a small (~1 mm) form factor. Originally developed to relay intensity-based images while maintaining spatial orientation, an imaging bundle is made by stacking fiber optic preforms together in an array and drawing the structure as a single unit [15]. Each bundle is composed of small “core” elements that are surrounded by a cladding glass of lower refractive index to enable wave guidance. Critically, each core element maps light to a corresponding location on the opposite bundle face, making imaging bundles attractive as a flexible image conduit.
Crucial optical characteristics of imaging fiber bundles are generally unavailable for several reasons. First, because bundles were not designed for interferometric imaging, most manufacturers do not provide specifications that address modal propagation. Furthermore, many bundles allow multiple modes to propagate, which may result in “ghost” images if the additional modes are within range of the detector, or incoherent noise if they are not. Individual elements may also be mismatched in OPL, an aspect also not typically characterized by manufacturers, but which could degrade the axial resolution and image quality. Coherent cross talk between elements presents an additional concern for coherence imaging, but likewise is not a characteristic typically disclosed by manufacturers.
In this work, we evaluated commercially available fiber bundles for coherence-domain sensing and imaging applications. Comprehensive characterization of physical properties, including numerical aperture (NA), core diameter, open-area ratio (OAR), and core-to-core spacing (CCS) was performed. We further examined modal properties of the bundles, characterizing the performance of each in a single-pass, parallel Mach-Zehnder interferometer that is like a/LCI, and a double-pass Michelson interferometer using a low-cost OCT system. Finally, we characterized custom-drawn bundles that minimize interelement OPL variability observed in the commercially available options while also reducing cross talk. It is our hope that this work leads to an improved understanding of the current state of imaging bundle technology for coherent imaging applications.
2. METHODS
A. Bundle Description
Six imaging bundles were investigated to characterize their optical performance, and included three commercially available bundles and three custom-drawn bundles. For commercially available components, we investigated bundles from Fujikura (FIGH-10-500N, FIGH-10-350S) and Sumitomo (IGN-05/10). Bundles from Fujikura are composed of high-NA, germanium-doped silica cores with a fluorine-doped common cladding. While both Fujikura bundles are comprised of approximately 10,000 elements, they are drawn to different active area diameters of 460 μm and 325 μm, respectively. The Sumitomo bundle is similar geometrically to the FIGH-10-500N, with 10,000 elements and an image area diameter of 450 μm, but slightly lower in NA. Fujikura bundles are surrounded by a plastic coating material, while the Sumitomo bundle is jacketed in silicone.
To further explore developing bundle technology, we worked with a corporate partner (Collimated Holes Inc., Campbell, California) to develop custom imaging bundles. Bundles from Collimated Holes were constructed using K5 core and N16B cladding borosilicate glasses (Schott), with approximate refractive indices of 1.515 and 1.503, respectively, at 840 nm. To reduce cross talk, an extramural absorbing (EMA) glass was also inserted between elements in the preform. Each Collimated Holes bundle was composed of ~3400 elements, drawn to different sizes to modify the modal properties of the waveguide. Bundles were drawn so that the diameter of the K5 core elements was 4.5 μm, 4.7 μm, and 5.0 μm, respectively. This allowed us to observe variation in modal properties due to variation in the core diameter at sizes near the single-mode cutoff.
B. Parameter Acquisition
The optical performance of an imaging fiber bundle is determined by a finite number of physical and optical properties. Perhaps the most important property is the V-parameter, or normalized frequency parameter, given by the expression [16]
| (1) |
where a is the core radius of each cylindrical waveguide, λ is the wavelength of light in air, and is the NA of each fiber element. The most common use of the V-parameter is the determination of modal propagation in which an individual fiber element is considered single-mode for V < 2.405. The V-parameter can also be used to approximate the number of allowed modes in a few-mode fiber. For example, as V becomes large, the number of allowed modes in a cylindrical waveguide approaches V2/2. In addition to optical parameters such as NA and V-parameter, physical parameters such as OAR and CCS are critical for imaging performance. OAR defines the percentage of the bundle end face that is capable of transmitting light (i.e., core material), while CCS defines the physical distance between adjacent core elements. Together, OAR and CCS define the spatial sampling within the fiber bundle, which governs the spatial resolution of a transmitted image.
Geometric parameters were acquired from each imaging bundle using conventional microscopy. An inverted microscope (Zeiss Axiovert 200) was used to acquire high-resolution images of the end face of each imaging bundle using a 40× objective (NA = 0.65). Prior to imaging, the face of each bundle was cleaned to remove debris and placed into a 3D-printed well with a coverslip glued to one end to hold the bundle in place. The back end of the bundle-segment was illuminated with bright white light using the microscope’s halogen lamp, and images were acquired using a Flea3 camera (PointGrey, 4.8 μm pixels) attached to the microscope’s camera port.
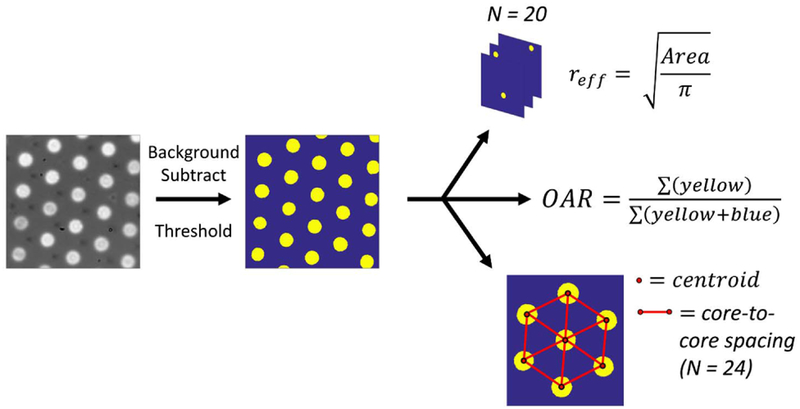
Each high-resolution end face image was processed in MATLAB to obtain physical parameters related to the core size and spacing, as shown in Fig. 1. Each image was background-subtracted and thresholded to obtain a binary image of the illuminated core-glass elements. From the binary mask, effective core radii were calculated for each core within the field of view as the radius of a circle with equivalent area to the element. This method allows for a more precise characterization of bundles with noncircular core profiles, such as the Sumitomo and Fujikura bundles. The OAR was computed using a large (50 μm by 50 μm) field of view with a uniform illumination and determining the fraction of the end face surface that transmits light. Finally, centroid coordinates of each illuminated core element were computed, and the distance between adjacent elements was used to determine the CCS (N = 24). A schematic depicting the image processing steps is shown in Fig. 1.
Fig. 1.
Schematic showing parameter acquisition, using the Collimated Holes 4.5 μm bundle as an example. A standard brightfield image is converted to a binary image displaying core/clad glass types. The effective core diameter, OAR, and CCS are calculated from the binary masks.
C. Modal Characterization
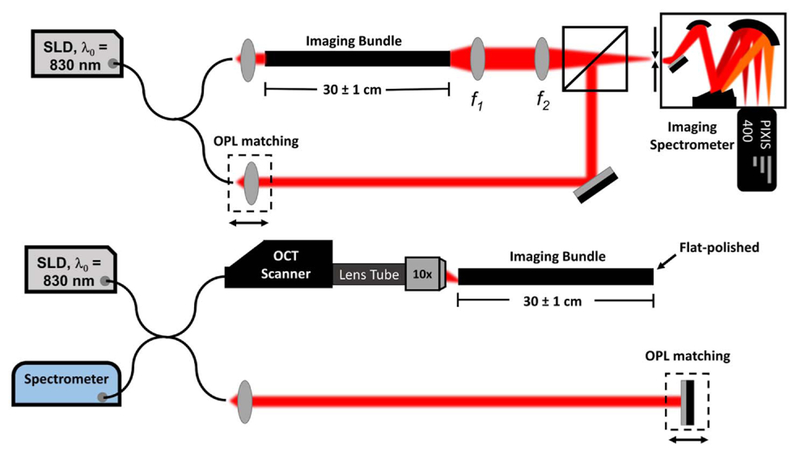
To characterize the modal structure of each bundle, two interferometers were constructed. First, a commercially available OCT system (OQ Labscope, Lumedica, Durham, North Carolina) was modified using a near-infrared (NIR) objective lens (ZEISS EC Plan-NEOFLUAR, NA = 0.3, 10×) to achieve a diffraction-limited spot of 2.1 μm, measured using the full width at half-maximum (FWHM) of images of subdiffraction microspheres (diameter = 560 nm), N = 10. This objective was chosen to prevent common-path interference in the 840 nm band, and because its diffraction-limited resolution is on the order of the core size of these bundles. The system divides light from a superluminescent diode (SLD) (λ0 = 840 nm, Δλ = 40 nm, coherence length ~ 7.8 μm) into sample and reference arms using a 2×2 fiber coupler. Light from the sample arm was coupled into the scan head of the device, after which the light was collimated using a standard 1/2 “ diameter achromatic lens (f = 30 mm). Collimated light from the OCT scanner was then used to fill the back aperture of an objective lens, which formed a tight spot on the proximal end of each fiber bundle. This spot was then scanned along the bundle face, using the microelectromechanical system scanning device in the OCT sample arm. Light from each core element then propagated to the distal end of the bundle, which was flat-polished to provide a reliably even surface for backreflection. Collected light was coupled back into the interferometer, where it was combined with the path-length-matched reference field before detection by a spectrometer. Each data acquisition by the spectrometer produced an A-scan of the bundle’s distal surface. Ideally, this would be a single peak in the A-scan, where the width of the peak is given by the coherence properties of the light source. A-scans were accumulated to produce a 512 × 512 B-scan image of the distal bundle face. The OCT system included real-time variable dispersion correction and intensity thresholding, which were manually adjusted to improve the image quality and interference peak sharpness.
To characterize interelement OPL variability, a single-pass parallel Mach-Zehnder interferometer was constructed. This device is similar in principle to a/LCI [17] and uses an imaging spectrometer to detect parallel interferograms from a line of core elements. An SLD (Superlum, λ0 = 840 nm, Δλ ~ 50 nm, power ~15 mW) with a coherence length of approximately 6.2 μm was coupled by a 1 × 2 fiber splitter into sample and reference arms. Light from the sample arm was weakly focused onto the bundle face using an achromatic doublet, f = 20 mm, with the object placed halfway between the lens and its focal plane. This provided flood-illumination of the entire face of the bundle for acquisition of parallel interfero-grams from adjacent core elements. Light from the proximal face was then relayed to the distal end of the bundle and imaged using a 4f lens pair (f1 = 35 mm, f2 = 75 mm, magnification ~2.14) onto the slit of the spectrometer (Acton SpectroPro 2150i). The spectrometer slit was narrowed to approximately 20 μm, and a grating (1200 lp/mm) was chosen to provide dispersion as a function of wavelength. Spectrally dispersed light was then imaged onto the detector plane of a scientific-grade C C D (PIXIS 400, Princeton Instruments, 20 μm pixels).
Image processing for the Mach-Zehnder interferometer was performed in a similar manner to a/LCI image acquisition [18]. Briefly, four exposures were taken (total, sample, reference, and dark) to isolate the interferometric component of the acquisition. Spectral data along each line was converted to wave-numbers and interpolated to be linear in k. To correct for material dispersion, a phase polynomial of the form
| (2) |
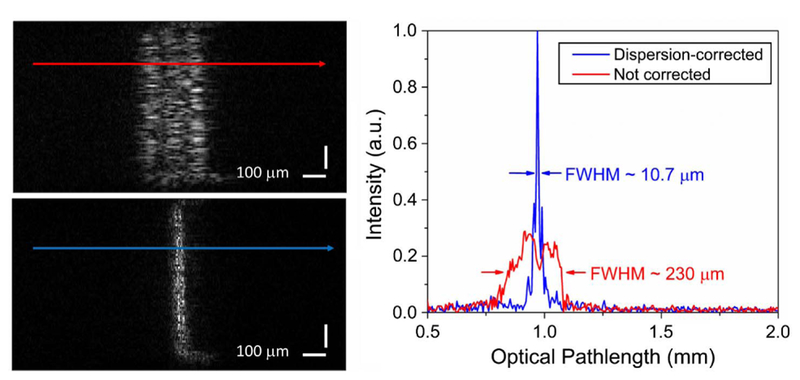
was applied to each spectrum, which was then Fourier transformed to produce a profile of modal propagation across the bundle face (Fig. 2). Constants n2 and n3 were chosen empirically to minimize the linewidth of the fundamental mode. Schematics depicting both interferometers are displayed in (Fig. 3).
Fig. 2.
Fundamental mode of light transmitted through the 4.5 μm Collimated Holes bundle both before (top left) and after (bottom left) numerical dispersion compensation. The OPL is displayed horizontally in this modality, in accordance with the sensor format. (Right) Plots displaying a single line profile across the mode. The FWHM of a single line across the fundamental mode was reduced from 230 μm to 10.7 μm, which is consistent with the coherence length of the SLD (approx. 6.2 μm).
Fig. 3.
(Top) Mach-Zehnder interferometer used to characterize interpixel variability across fiber pixels. (Bottom) The modified OCT system from Lumedica, Inc. using a 10x objective lens (NA = 0.3) for improved coupling efficiency. The spectrometer schemes mirror the expected geometry of a/LCI and OCT, two interferometric modalities that often employ imaging bundles.
3. RESULTS
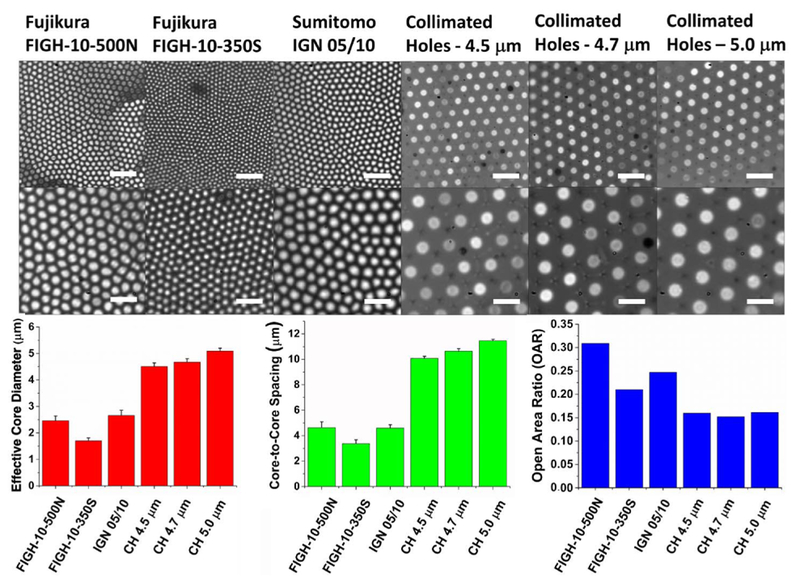
The results of the bundle geometric characterization experiments are summarized in Fig. 4. The commercially available bundles exhibit substantially smaller effective core diameters, with values of approximately 2.46 ± 0.17 μm for FIGH-10-500N, 1.70 ± 0.11 μm for FIGH-10-350S, and 2.66 ± 0.19 μm for IGN-05/10, with N = 20 cores each. This stands in contrast to the custom-designed bundles with effective diameters of 4.51 ± 0.13 μm, 4.67 ± 0.13 μm, and 5.09 ± 0.11 μm, also with N = 20 each. These values are quite close to the quoted diameters of 4.5 μm, 4.7 μm, and 5.0 μm, which validated our core-segmentation algorithm. Critically, commercially available bundles exhibited a substantially higher variation in core size, with a standard deviation of approximately 7%, compared with 2% −3% for the custom bundles. This is unsurprising, considering the irregular appearance and shape of core elements in the commercial bundles (Fig. 4). The Fujikura and Sumitomo bundles also exhibited a larger OAR (0.31 for FIGH-10-500N, 0.21 for FIGH-10-350S, and 0.25 for IGN-05/10) compared with bundles from Collimated Holes (0.15–0.16 for all three bundles). Coupled with the higher NA in the Fujikura and Sumitomo bundles — 0.35 for IGN-05/10 and 0.39 for Fujikura [19], versus ~0.19 for custom bundles—commercially available fiber bundles are shown to have a substantially better light-gathering capacity. The larger OAR for the Fujikura and Sumitomo bundles correlates expectedly with a tighter CCS (4.63 ± 0.36 for FIGH-10-500N, 3.37 ± 0.30 μm for FIGH-10-350S, and 4.60 ± 0.26 μm for IGN-05/10) than the corresponding values for bundles from Collimated Holes (10.08 ± 0.16 μm, 10.63 ± 0.20 μm, and 11.46 ± 0.12 μm for the 4.5, 4.7, and 5.0 μm core bundles, respectively), suggesting that the Fujikura and Sumitomo bundles offer advantages for simple imaging applications where only the light intensity is measured.
Fig. 4.
(Top row) Wide-area image of each fiber bundle end face, showing circularity and packing density. The scale bar = 20 μm. (Middle row) A close-up image showing more detailed features; the scale bar = 10 μm. (Bottom row) Bar charts showing the effective core diameter, OAR, and CCS. Commercially available bundles exhibit a smaller core diameter, tighter CCS, and higher OAR. The core elements from these bundles are also highly noncircular and exhibit a significant core size variability. The error bars represent the standard deviation (SD).
Modal structure arising from the two interferometers is shown in Figs. 5 and 6. Both interferometers provide complementary information in this case: the use of an objective lens in the OCT system allows for better filling of the NA of each element, which enables the coupling of light into higher-order modes that would otherwise fail to populate. Because illumination of the entire bundle face (~1 mm diameter) at a high NA is not feasible, the Mach-Zehnder interferometer limits the NA of the illumination light while flood-illuminating the entire bundle face for simultaneous modal characterization of adjacent elements.
Fig. 5.
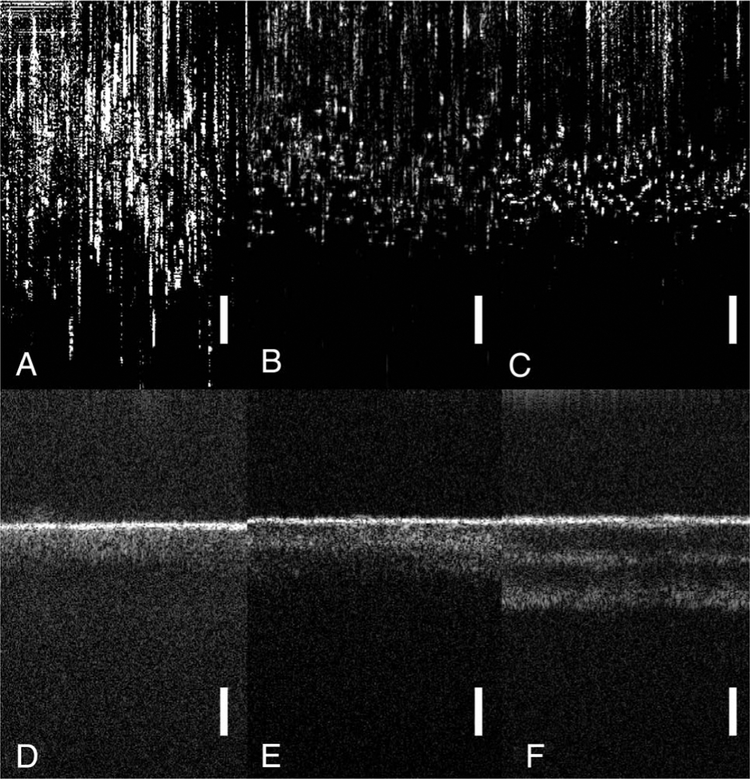
B-Scan OCT images using the distal face of each bundle as a reflectance object, with the OPL oriented in the vertical dimension. A-C: Commercially available bundles (FIGH-10-350S, FIGH-10-500N, and IGN-05/10, respectively) exhibit high interpixel path length variability, which limits their utility for interferometric imaging without adding a mechanism for path length compensation. D-F:4.5 M-m, 4.7 μm, and 5.0 μm core diameter bundles from Collimated Holes exhibit much more consistent OPL between pixels. Higher-order modes begin to couple in the larger cores, with approximately one, two, and three modes in each bundle, respectively. Diffuse “tails” following each modal peak are also observed that are likely the result of cross talk between elements, contributing to a slightly longer OPL for some photons, as well as the inability to provide dispersion compensation for multiple modes simultaneously. The images are presented in log scale to show weakly coupling modes. The scale bar = 200 μm.
Fig. 6.
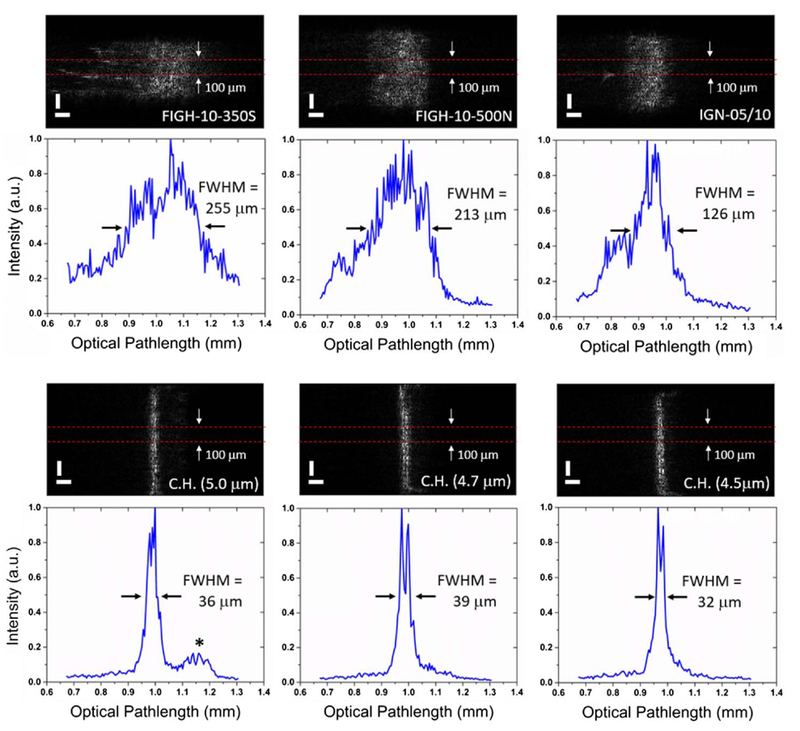
Modal structure of the imaging bundles using a Mach-Zehnder interferometer in a similar configuration to a/LCI, with the OPL displayed horizontally in accordance with the sensor format. (Top row) The bundles from Fujikura and Sumitomo exhibit a substantial variation in OPL between the core elements. Averaging the signal over a 100 μm region produces a FWHM broadening of 100–300 μm. (Bottom row) The bundles from Collimated Holes exhibit substantially less OPL variability. The binned FWHM in these cases is 30–40 μm, with several individual lines approaching the expected coherence length of 6.2 μm. “*” indicates a weakly-coupled secondary mode. Line profiles (blue) are displayed at 2× magnification compared with their corresponding image to show multicore interference, which degrades the axial resolution.
The results from the OCT characterization are shown in Fig. 5. Qualitatively, we observed high interelement path length variability in the Fujikura and Sumitomo bundles, which appeared worse with smaller core sizes. This effect may be explained by a higher sensitivity of smaller cores to mechanical deformation, or by a relatively larger impact of a given deformation on the optical properties of small cores. Custom-drawn bundles from Collimated Holes did not experience the same issue, with minimal variation in the OPL between adjacent elements. Because larger core radii result in a larger normalized frequency parameter (“V”-parameter), we observed coupling of higher-order modes from bundles with larger core diameters, with approximately 1, 2, and 3 modes observed in the 4.5 μm, 4.7 μm, and 5.0 μm cores. Interestingly, we observed diffuse “tails” to each interference peak, which become visible on the logarithmic intensity scale implemented by the OCT system display. These are likely the result of cross talk between elements, as photons that escape from one core to the next will experience a slightly longer OPL. This issue may be worsened by overfilling of the fiber NA, which occurred to a minor degree in the custom-drawn bundles. Another possible explanation is imperfect dispersion compensation, which leads to blurring of nonfundamental modes.
The results from the Mach-Zehnder characterization of the imaging bundles are shown in Fig. 6. Bundles from Fujikura and Sumitomo again exhibited substantial OPL variation between pixels, resulting in broadening of the effective interference peak across the bundle face. To fully characterize this effect, the modal FWHM was calculated by averaging the mode profile across a 100 μm lateral region of the bundle face. This provides a good metric for the usefulness of the bundle for single-mode imaging, since variations in the width, location, and number of modes across individual lines will lead to corruption of an interferometric image.
The interpixel OPL variation resulted in a substantial reduction in performance of the commercial imaging bundles. Binned FWHM values for these bundles were 126 μm for the IGN-05/10, 213 μm for the FIGH-10-500N, and 255 μm for the FIGH-10-500N bundle, substantially larger than the coherence length of the SLD. Bundles from Collimated Holes performed substantially better, with binned FWHM values of 36 μm, 39 μm, and 32 μm for the 4.5 μm, 4.7 μm, and 5.0 μm core elements, suggesting that the fundamental mode propagates reliably in each of these bundles. The 5.0 μm bundle allowed a weakly coupled secondary mode (“*”, Fig. 6), though the multiple modes observed in the OCT instrument were not observed due to the low NA of the flood-illumination in this case.
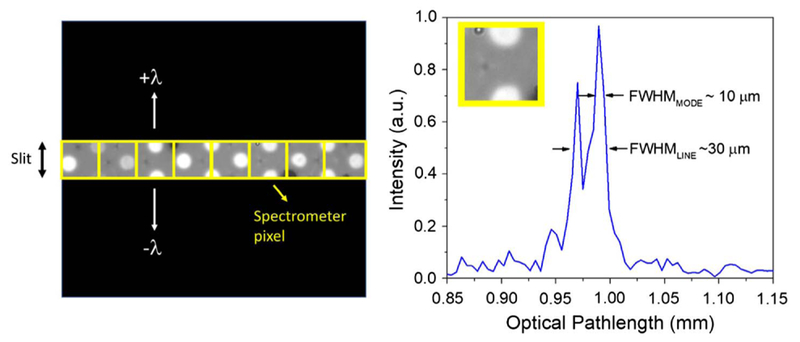
While our custom-drawn bundles did perform significantly better than the commercial options, the binned FWHM of the fundamental mode was still larger than expected (30–40 μm, as opposed to the 6.2 μm coherence length of the source). Upon further investigation, we noted the appearance of multiple interference peaks (typically 2–3) on most lines of the camera. This phenomenon is well explained by an overlap of adjacent fiber cores when imaged onto the same spectrometer pixel. Even with typical CCSs of 10–12 μm, and a magnification of ~2.14, at least a portion of the multiple core elements can be imaged into a single 20 × 20 pixel of the spectrometer. This will in turn result in multiple interference peaks corresponding to the superposition of the fundamental modes of adjacent core elements. Figure 7 displays a pictorial representation of this phenomenon, as well as a single line taken from the fundamental mode of the 4.5 μm Collimated Holes bundle, which performed best in this case. From the pictorial, we can see that it is typical for a spectrometer line to contain information from 2 to 3 fiber cores, which matches the 2–3 modes observed in a typical spectral line. From the line profile, we observe multiple (in this case, two) interference peaks, with FWHM values of approximately 10 μm each. This is close to the 6.2 μm coherence length of the source and validates our postulate of multicore interference. The FWHM of the combined peak is 30 μm, which is within the acceptable depth resolution of a/LCI, and comparable to the 26 μm FWHM observed in a/LCI instrumentation that which uses more advanced fiber solutions [17,20]. We also note that the issue of superimposed fiber elements was not evident in every line. The presence of a small number of lines whose signal primarily originates from a single fiber allows us to demonstrate that our modal FWHM is near the coherence length, and thus, that our dispersion compensation has been sufficiently optimized.
Fig. 7.
(Left) Pictorial representation of the magnified face of a bundle, superimposed with the spectrometer slit and pixels along a single line. Multiple fiber elements (generally 1–3) appear on each pixel row, which are dispersed in the second dimension as a function of wavelength. (Right) The example line profile of a single Fourier-transformed interferogram depicting two modes, with an individual FWHM of approximately 10 μm and a joint FWHM of around 30 μm.
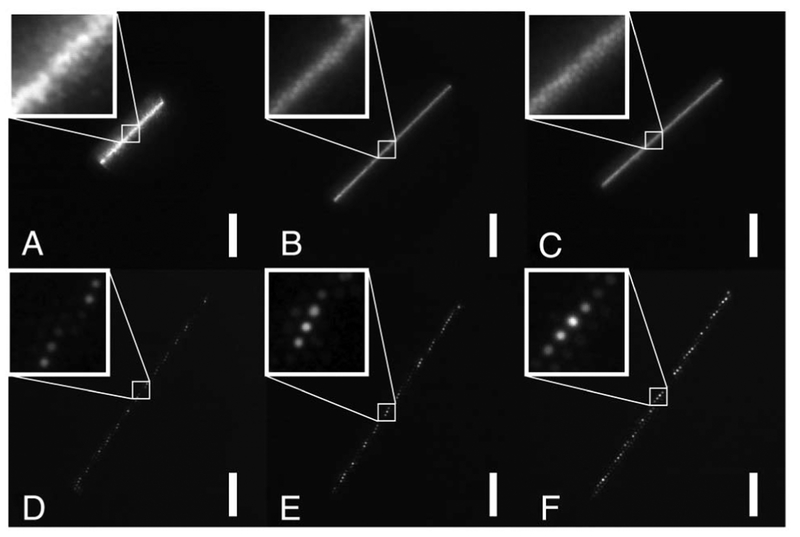
In addition to modal structure, cross talk was also a likely factor in the degradation of the interferometric image quality. Figure 8 shows images of the distal end of each image bundle as linear scanning was performed on the proximal end during OCT image acquisition. Substantial cross talk is observed in the commercial bundles, appearing as a “halo” artifact surrounding the scan line. This effect is most pronounced in the bundle with the tightest CCS (FIGH-10-350S), though it is also visible on the other two commercial bundles to a lesser extent.
Fig. 8.
Image of the distal tip of each bundle during the OCT scanning procedure. A–C: FIGH-10-350S, FIGH-10-500N, and IGN-05/10 bundles exhibited visible cross talk, appearing above as a “halo” around the scan line. D–F: Custom bundles from Collimated Holes, in order of increasing core diameter. These bundles exhibited substantially less cross talk than the commercially available elements. The scale bar = 100 μm. (Insets) A 50 × 50 μm image showing the cross talk between adjacent elements at the single-pixel level.
While visible cross talk is not as pronounced in the custom bundles, we did observe “tails” in each interference peak that were slightly longer in OPL, suggesting the presence of some intercore coupling, among other competing effects. While not a major factor in these experiments, cross talk may become more pronounced when longer lengths of the imaging bundle (e.g., multiple meters) are used.
4. DISCUSSION
A summary of the properties of each bundle is displayed in Table 1. Measured properties (CCS, OAR, etc.) from this work are included, along with properties like NA obtained from other work [19]. The V-parameter displayed in the table is calculated using the full NA of each fiber element, though OC T scanning in this work was performed using an NIR-optimized objective that was slightly lower in acceptance angle than some bundles (NA = 0.3) but was used because it prevented backreflection and common path interference in the NIR. This resulted in lowering the effective V-parameter during measurement by a ratio of NAobjective/NAfiber, if NAobjective < NAfiber. For perfectly cylindrical waveguides using a monochromatic source, only the fundamental LP01 mode will propagate if V is below a cutoff of 2.405. Above this value, a second mode (LP11) will be visible if V < 3.832, and a third mode will appear if V < 5.520. The bundle that most closely approximated single-mode performance was the 4.5 pm custom bundle, which had a V-parameter of 3.2 using the NIR objective. While this number may seem high, the use of a broadband source is a complicating factor not typically considered in a simplified expression such as Eq. (1). Furthermore, we do observe some signals outside of the fundamental mode in this bundle, as shown in Fig. 5D. The 4.7 pm bundle experienced a more predictable performance, with a V-parameter of 3.32 and two clearly observable modes. A weak third mode is evident in the 5.0 pm bundle (V = 3.62). The use of broadband light may contribute to this third mode, since lower wavelengths will experience a higher V-parameter than the center of the spectrum. Variability in core size may also produce a larger V-parameter in some individual elements. For example, a core with a 4% increase in diameter (18–20 nm) will allow a third mode to propagate for at least a portion of the illumination spectrum. Any error in the core and clad refractive indices will also contribute to changes in the V-parameter, and hence, the number of modes allowed to propagate.
Table 1.
Optical Characteristics and Performance Specifications of Imaging Bundles Examined in This Worka
| FIGH-10-500N | FIGH-10-350S | IGN-05/10 | C.H. (4.5 μm) | C.H. (4.7 μm) | C.H. (5.0 μm) | |
|---|---|---|---|---|---|---|
| No. of Elements | 10,000 | 10,000 | 10,000 | ~3, 400 | ~3, 400 | ~3, 400 |
| Core Diameter (μm) | 2.46 ± 0.17 | 1.70 ± 0.11 | 2.66 ± 0.19 | 4.51 ± 0.13 | 4.67 ± 0.13 | 5.09 ± 0.11 |
| Core-to-core spacing (μm) | 4.63 ± 0.36 | 3.37 ± 0.30 | 4.60 ± 0.26 | 10.08 ± 0.16 | 10.63 ± 0.20 | 11.46 ± 0.12 |
| Active Area Diameter (μm) | 460 | 325 | 450 | 680 | 720 | 780 |
| Flexibility | Good | Good | Good | Poor | Poor | Poor |
| Open-Area Ratio | 0.31 | 0.21 | 0.25 | 0.16 | 0.15 | 0.16 |
| V -parameter | 3.59 | 2.48 | 3.48 | 3.20 | 3.32 | 3.62 |
| NA | 0.39 | 0.39 | 0.35 | 0.19 | 0.19 | 0.19 |
| Allowed Modes (NA = 0.3) | 1–2 | 1 | 1–2 | 1 | 2 | 3 |
| Variable OPL/pixel? | Yes | Yes | Yes | No | No | No |
The V-parameter was calculated using the average value of core diameter at λ = 840 nm. Error values are presented as SD.
While the core diameter, CCS, and OAR are given using the standard deviation of their measured values, in reality the optical resolution of the objective will limit the ability to quantify small structures with submicrometer precision. Images of the bundle tips were performed using a 40× objective, NA = 0.65, with an expected lateral resolution of ~ 0.78 pm in air. This value was validated by imaging subdiffraction polystyrene microspheres (560 nm diameter) and calculating the FWHM of the corresponding point-spread function (N = 50). Empirically, we obtained a lateral resolution of 0.89 μm, which is a bit larger than the expected value. The limited lateral resolution of our imaging objective may have introduced some error into the core-size quantification in this case.
A complicating issue facing the use of fiber bundles in interferometric imaging schemes is the overlap of modes from adjacent cores onto a single spectrometer line, as shown in Fig. 7. While it was not studied in this case, the use of detectors with a small pixel pitch (< 5 μm, as opposed to the 20 μm pixels used here) could help to alleviate this problem. Additional magnification can also be introduced prior to the detector, which may separate light from individual cores in space. However, this will also limit the number of cores that can be imaged.
As shown in Fig. 5, the Fujikura and Sumitomo bundles exhibited a high variability in OPL between adjacent cores, making them ineffective for interferometry when combined with a planar reference wavefront. Common path interferometry schemes, in which light from a single core is interfered with a time-delayed reflection, may improve the utility of these bundles. A basic implementation of a common path OCT system using a bundle from Sumitomo was recently demonstrated by Risi etal. [21], although cross talk still caused a reduction in the image quality.
While the core size variability plays a role in OPL variance, the shape irregularity will also affect the propagation constant, and thus the OPL variance between adjacent fiber elements. Although the shape irregularity was not quantified in this work due to limitations in the optical resolution, previous studies have examined the shape irregularity in some commercial bundles using scanning electron microscopy (SEM) [19,22]. An improved understanding of how the core shape influences OPL would assist with the design of OPL-stable imaging bundles for interferometric applications.
Leached image bundles (Schott North America, Elmsford, New York) are more advanced fiber optic bundles that have been extensively characterized for interferometric imaging [17,23], and thus were not examined in this work. Leached bundles are composed of rigid ends with an acid-soluble jacket material between elements. After drawing, the jacketing is leached away, creating a flexible image conduit. While these bundles present an attractive solution, they are often very expensive (>$1000/m), exhibit a limited optical throughput, and offer a limited opportunity for customization. Furthermore, the presence of loose borosilicate elements on the order of 10 pm makes them subject to mechanical failure,i.e., broken fiber elements. For these reasons, cost-effective and robust bundles with a high performance are needed as an alternative to leached image bundles.
In this work, modal linewidths were compared against the coherence length of the source, which was calculated using the center wavelength and bandwidth of a Gaussian spectrum. While coherence length is determined by these parameters, the shape of the spectrum is also important. For example, a Lorentzian source with an identical bandwidth to a Gaussian source exhibits a coherence length that is reduced by 52%, while a rectangular spectrum will have a coherence length that is augmented by 51%. The SLD used in the Mach-Zehnder interferometer exhibited a bimodal spectrum whose profile is somewhat between a rectangular and a Gaussian spectrum. Variation in the spectral profile may account for the measurement of mode widths that were slightly larger (but still very similar) to the coherence length.
In this work, custom bundles exhibited the best optical performance, though they were relatively inflexible, with outer diameters approaching 800 μm. Smaller diameter bundles with fewer elements may provide the requisite flexibility while maintaining satisfactory optical properties. We are currently working with Collimated Holes to produce bundles with smaller form factors, with an eye toward a highly flexible, single-mode image bundle.
While this work characterizes the current state of imaging bundle technology, it is important to comment on ways in which future bundles could be improved. Bundles from Fujikura and Sumitomo provided excellent spatial sampling and flexibility, though their OPL variability suggests little utility for interferometric imaging. It is likely that a flexible silica bundle with highly circular cores and a stable OPL would find a substantial market among OCT developers, and drive innovation in other interferometric modalities such as a/LCI. It is our hope that this study will encourage innovation in the space of currently available imaging fiber bundles.
5. CONCLUSIONS
In this work, we have comprehensively examined a broad array of imaging fiber bundles, including commercially available and custom bundles. Optical and mechanical characteristics including core diameter, CCS, OAR, V-parameter, modal linewidth, interpixel OPL variability, and the number of allowed modes were measured. This work will lead to an improved utility of imaging bundles for interferometric sensing and imaging, and drive innovation to improve upon the current state of bundle technology.
Acknowledgment.
ZS gratefully acknowledges support from the National Science Foundation Graduate Research Fellowship Program. Disclosures: AW, MC: Lumedica, Inc (I, C).
Funding.
North Carolina Biotechnology Center (NCBC) (2015-CFG 8005); National Institutes of Health (NIH) (R01 CA167421, R01 CA210544).
REFERENCES
- 1.Huang D, Swanson EA, Lin CP, Schuman JS, Stinson WG, Chang W, Hee MR, Flotte T, Gregory K, and Puliafito CA, “Optical coherence tomography,” Science 254, 1178–1181 (1991). [DOI] [PMC free article] [PubMed] [Google Scholar]
- 2.Hee MR, Izatt JA, Swanson EA, Huang D, Schuman JS, Lin CP, Puliafito CA, and Fujimoto JG, “Optical coherence tomography of the human retina,” Arch. Ophthalmol 113, 325–332 (1995). [DOI] [PubMed] [Google Scholar]
- 3.Evans JA, Poneros JM, Bouma BE, Bressner J, Halpern EF, Shishkov M, Lauwers GY, Mino-Kenudson M, Nishioka NS, and Tearney GJ, “Optical coherence tomography to identify intramucosal carcinoma and high-grade dysplasia in Barrett’s esophagus,” Clin. Gastroenterol. Hepatol 4, 38–43 (2006). [DOI] [PMC free article] [PubMed] [Google Scholar]
- 4.Wax A, Terry NG, Dellon ES, and Shaheen NJ, “Angle-resolved low coherence interferometry for detection of dysplasia in Barrett’s esophagus,” Gastroenterology 141, 443–447 (2011). [DOI] [PMC free article] [PubMed] [Google Scholar]
- 5.Zhu Y, Terry NG, and Wax A, “Angle-resolved low-coherence interferometry: an optical biopsy technique for clinical detection of dysplasia in Barrett’s esophagus,” Exp. Rev. Gastroenterol. Hepatol 6, 37–41 (2012). [DOI] [PMC free article] [PubMed] [Google Scholar]
- 6.Wax A, Yang C, Backman V, Badizadegan K, Boone CW, Dasari RR, and Feld MS, “Cellular organization and substructure measured using angle-resolved low-coherence interferometry,” Biophys. J 82, 2256–2264 (2002). [DOI] [PMC free article] [PubMed] [Google Scholar]
- 7.Isenberg G, Sivak MV, Chak A, Wong RC, Willis JE, Wolf B, Rowland DY, Das A, and Rollins A, “Accuracy of endoscopic optical coherence tomography in the detection of dysplasia in Barrett’s esophagus: a prospective, double-blinded study,” Gastrointest. Endosc 62, 825–831 (2005). [DOI] [PubMed] [Google Scholar]
- 8.Qi x., Sivak MV Jr., Wilson DL, and Rollins AM, “Computer-aided diagnosis of dysplasia in Barretts esophagus using endoscopic optical coherence tomography,” Proc. SPIE 5316, 33–40 (2004). [DOI] [PubMed] [Google Scholar]
- 9.Steelman ZA, Eldridge WJ, Weintraub JB, and Wax A, “Is the nuclear refractive index lower than cytoplasm? Validation of phase measurements and implications for light scattering technologies,” J. Biophotonics 10, 1714–1722 (2017). [DOI] [PMC free article] [PubMed] [Google Scholar]
- 10.Duma V-F, Lee K-S, Meemon P, and Rolland JP, “Experimental investigations of the scanning functions of galvanometer-based scanners with applications in OCT,” Appl. Opt 50, 5735–5749 (2011). [DOI] [PubMed] [Google Scholar]
- 11.Ferguson RD, Hammer D. x., Paunescu LA, Beaton S, and Schuman JS, “Tracking optical coherence tomography,” Opt. Lett 29, 2139–2141 (2004). [DOI] [PMC free article] [PubMed] [Google Scholar]
- 12.Drake TK, Robles FE, and Wax A, “Multiplexed low coherence interferometry instrument for measuring microbicide gel thickness distribution,” Appl. Opt 48, D14–D19 (2009). [DOI] [PubMed] [Google Scholar]
- 13.Drake TK, Shah T, Peters JJ, Wax A, and Katz DF, “Measuring dilution of microbicide gels with optical imaging,” PLoS One 8, e82213(2013). [DOI] [PMC free article] [PubMed] [Google Scholar]
- 14.McLaughlin RA, Quirk BC, Curatolo A, Kirk RW, Scolaro L, Lorenser D, Robbins PD, Wood BA, Saunders CM, and Sampson DD, “Imaging of breast cancer with optical coherence tomography needle probes: feasibility and initial results,” IEEE J. Sel. Top. Quantum Electron 18, 1184–1191 (2012). [Google Scholar]
- 15.Chiarulli DM, Levitan SP, Derr P, Hofmann R, Greiner B, and Robinson M, “Demonstration of a multichannel optical interconnection by use of imaging fiber bundles butt coupled to optoelectronic circuits,” Appl. Opt 39, 698–703 (2000). [DOI] [PubMed] [Google Scholar]
- 16.Teich MC and Saleh B, Fundamentals of Photonics (Wiley Interscience, 1991), p. 3. [Google Scholar]
- 17.Zhu Y, Terry NG, Woosley JT, Shaheen NJ, and Wax A, “Design and validation of an angle-resolved low-coherence interferometry fiber probe for in vivo clinical measurements of depth-resolved nuclear morphology,” J. Biomed. Opt 16, 011003(2011). [DOI] [PMC free article] [PubMed] [Google Scholar]
- 18.Brown WJ, Pyhtila JW, Terry NG, Chalut KJ, D’Amico TA, Sporn TA, Obando JV, and Wax A, “Review and recent development of angle-resolved low-coherence interferometry for detection of precancerous cells in human esophageal epithelium,” IEEE J. Sel. Top. Quantum Electron 14, 88–97 (2008). [Google Scholar]
- 19.Han J-H and Kang JU, “Effect of multimodal coupling in imaging micro-endoscopic fiber bundle on optical coherence tomography,” Appl. Phys. B 106, 635–643 (2012). [DOI] [PMC free article] [PubMed] [Google Scholar]
- 20.Steelman ZA, Ho D, Chu KK, and Wax A, “Scanning system for angle-resolved low-coherence interferometry,” Opt. Lett 42, 4581–4584 (2017). [DOI] [PMC free article] [PubMed] [Google Scholar]
- 21.Risi MD, Makhlouf H, Rouse AR, and Gmitro AF, “Analysis of multimode fiber bundles for endoscopic spectral-domain optical coherence tomography,” Appl. Opt 54, 101–113 (2015). [DOI] [PMC free article] [PubMed] [Google Scholar]
- 22.Reichenbach KL and xu C, “Numerical analysis of light propagation in image fibers or coherent fiber bundles,” Opt. Express 15, 2151–2165 (2007). [DOI] [PubMed] [Google Scholar]
- 23.xie T, Mukai D, Guo S, Brenner M, and Chen Z, “Fiber-optic-bundle-based optical coherence tomography,” Opt. Lett 30, 1803–1805 (2005). [DOI] [PubMed] [Google Scholar]


