

Summary
Since the origins of DNA-based life, the enzyme ribonucleotide reductase (RNR) has spurred proliferation because of its rate-limiting role in de novo deoxynucleoside-triphosphate (dNTP) biosynthesis. Paradoxically, the large subunit, RNR-α, of this obligatory two-component complex in mammals plays a context-specific anti-proliferative role. There is little explanation for this dichotomy. Here, we show that RNR-αhas a previously-unrecognized DNA-replication-inhibition function, leading to growth retardation. This underappreciated biological activity functions in the nucleus where RNR-α interacts with ZRANB3. This process suppresses ZRANB3’s function in unstressed cells that we show to be promotion of DNA-synthesis. This non-reductase-function of RNR-α is promoted by RNR-α-hexamerization—induced by natural- and synthetic-nucleotide of dA/ClF/CLA/FLU—which elicits rapid RNR-α nuclear import. The newly-discovered nuclear signaling axis is a primary defense against elevated/imbalanced dNTP-pools that can exert mutagenic effects irrespective of the cell cycle.
Editorial summary
Double Agent Exposed! The large subunit of ribonucleotide reductase—the harbinger of the DNA world—downregulates replication when inside the nucleus: it plays a tug-of-war with IRBIT/importin-α1 in the cytosol and PCNA/ZRANB3 in the nucleus.
Replication fidelity is paramount for fitness1. One factor controlling DNA-replication fidelity is an optimal dNTP-pool concentration that ensures high-fidelity nucleotide incorporation and proofreading. The enzyme ribonucleotide reductase (RNR) stands at the epicenter of dNTP-pool maintenance. RNR is rate-limiting for dNTP production2 and catalyzes the reduction of CDP/ADP/GDP/UDP to deoxynucleotides, providing dNTPs for DNA synthesis and repair. RNR senses both the absolute levels and relative ratios of NTPs/dNTPs, altering its reductase-activity and/or NDP-substrate preference to balance dNTP-pools and promote high-fidelity replication. Mammalian-RNR requires two subunits—α and β—for reductase activity. The minimal quaternary state of active reductase is α2β23. However, modulation in reductase activity brought about by nucleotide-pool changes is coupled to changes in RNR quaternary structure. dATP—the universal allosteric downregulator of RNR—induces α-subunit-specific hexamerization, independent of RNR-β. The dATP-driven formation of ‘reduced-reductase-activity’ hexameric states (α6) is a regulatory mechanism conserved across eukaryotic RNR-α3–13. Conversely, the positive allosteric stimulator ATP can induce distinct ‘reductase-active’ α6 states3. α6RD and α6RS respectively denote dATP-promoted ‘reductase-activity-downregulated’ RNR-α-hexamers and ATP-promoted ‘reductase-activity-stimulated’ RNR-α-hexamers.
RNR-α-protein is constitutively present due to its long half-life, whereas RNR-β-protein (t1/2~3 h)3 peaks in S-phase. Another constitutive, low-expression RNR-β-isoform—p53β—supplies dNTPs outside S-phase in conjunction with RNR-α3. All RNR-isoforms are predominantly cytosolic3,14,15. Although RNR-activity is elevated in some cancer cells, RNR-α-subunit-specific expression in cancer can either be elevated or downregulated relative to normal tissue3,16–18.
Since ribonucleotide reduction is an essential metabolic function that sustains rapid cancer growth19, RNR is the target of several anticancer drugs. Although overexpression of RNR-subunits confers resistance to RNR-targeting drugs and DNA-damaging chemotherapeutics3, effects of RNR-α-subunit are context-/stage-specific3. RNR-α lies in a chromosomal region frequently lost during oncogenesis20; RNR-α-overexpression alone suppresses oncogenic ras-induced-transformation in cells and mice xenografts21 and promotes survival post-therapy3,21–28, whereas RNR-α-knockdown promotes oncogenic ras-induced transformation22. These findings combined with RNR-α’s status as an essential gene indicate RNR-α is likely a haploinsufficient tumor-suppressor gene29. However, the mechanism is unknown. Nevertheless, because RNR-α–knockdown is tumor-promoting, these activities likely do not stem from RNR-enzymatic function3.
Here we offer the first molecular basis of RNR-α-alone-promoted growth-suppression. This activity is selectively associated with nuclear-RNR-α directly interacting with ZRANB3, impeding ZRANB3–PCNA complexation that we find promotes DNA-synthesis in non-stressed cells. We identify both small-molecule (natural nucleotide-dATP and anti-leukemic nucleotide-drugs) and protein (IRBIT and importin-α) modulators of this novel nuclear signaling axis which we show is independent of RNR-reductase-activity but relies on RNR-α-hexamerization.
Results
ZRANB3 is a domain-specific direct binder of RNR-α
We under took a large-scale yeast two-hybrid (Y2H) screen using the Gal4-DNA-binding-domain fused to full-length RNR-α (Fig. 1a). The ZRANB3 C-terminus (residues-929–1079) emerged as an RNR-α-specific interactor (Fig. 1a, Supplementary Fig. 1a), in addition to RNR-β (residues-279–389, a known RNR-α-binding site).
Figure 1. Functional interaction of RNR-α with nuclear protein ZRANB3.
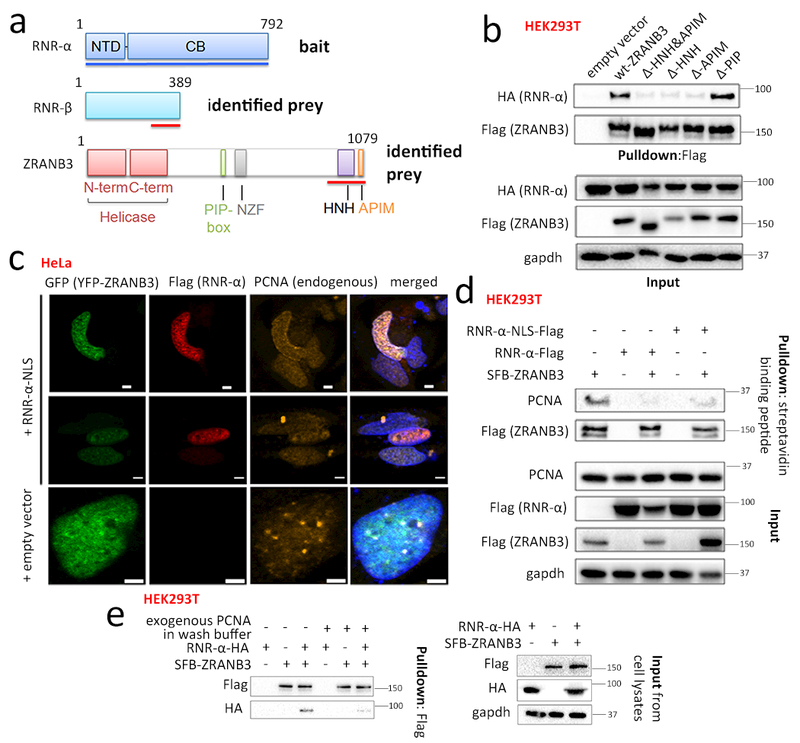
(a) Domains of RNR-α (NTD=N-terminal domain; CB=catalytic body), RNR-β, and ZRANB3 (PIP-box=PCNA-interacting motif; NZF=Npl4 Zinc Finger; HNH=homing endonuclease; APIM=AlkB-homolog-2 PCNA-interacting motif). Red lines show interacting domains in Y2H. See also Supplementary Fig. 1a. (b) Co-IP of Flag-ZRANB3-deletion-mutants with RNR-α in HEK293T. See also Supplementary Fig. 1b–e and 2–3. (c) In transiently transfected HeLa cells: nuclear RNR-α colocalizes with ZRANB3. Scale bars, 2 μm. Although PCNA foci colocalize with ZRANB3 as reported30,31 (Row 3), this association is reduced upon RNR-α-NLS expression (Row 1–2). IF images are representatives of independent cells shown in Supplementary Fig. 4b. See also Supplementary Fig. 4–8. (d) Overexpression of wt-RNR-α (NLS- or no-NLS-tagged) reduces the ZRANB3—PCNA-interaction. HEK293T cells were transfected with indicated plasmids and SFB-tagged-ZRANB3 in lysates was enriched using streptavidin (note: SFB tag contains a streptavidin-binding peptide). See Supplementary Fig. 3b for quantitation. (e) Recombinant His5-PCNA rapidly displaces ZRANB3-bound RNR-α-HA. HEK293T cells ectopically co-expressing RNR-α-HA and SFB-ZRANB3 were lysed and the (SFB-ZRANB3)–(RNR-α-HA) complex was immuno-precipitated using anti-Flag resin (note: SFB tag contains Flag-peptide sequence). The amount of RNR-α-HA co-IP-ed with SFB-ZRANB3 diminished when the washing steps post IP were performed with 5 μM purified, recombinant His5-PCNA. See also Supplementary Fig. 3c–d. For full-view blots and cell cycle data relevant to Fig. 1 and supplementary figures referred to above, see Supplementary Fig. 32 and 35–39. WB images are representatives of n=3 [Fig. 1(b)] or 2 [Fig. 1(c-d)] independent experiments.
ZRANB3 (zinc-finger-RAN-binding-domain-containing-3) is a replication-associated SNF2 protein and ATP-driven DNA-rewinding motor30–32, also possessing ATP-hydrolysis-coupled endonuclease-activity and annealing activity. ZRANB3 associates with PCNA through two functionally-coupled motifs30,32, the PIP-(PCNA-interacting-protein)-box (aa 519–526) and the APIM-(AlkB-homolog-2-PCNA-interaction)-motif (aa 1074–1078) (Supplementary Fig. 1a). ZRANB3/PCNA colocalize in unstressed cells at discrete nuclear foci termed replication factories30,31. The role of this complex in non-stressed cells is unknown. However, after DNA-damage30–32, ZRANB3 cooperates with ubiquitinated-PCNA to facilitate replicative bypass, repair, and sister chromatid exchange at DNA lesions—a process typified by formation of small ZRANB3/PCNA foci.
We verified the ZRANB3—RNR-α interaction in non-challenged cells by co-immunoprecipitation (co-IP) in HEK293T. The interaction required ZRANB3’s C-terminus; specifically, the HNH-domain and the APIM-motif (Fig. 1b, Supplementary Fig. 1b-c). Recombinantly-purified C-terminal domains of ZRANB3 (aa 929–1079, HNH-domain and APIM-motif) directly bind to full-length recombinant RNR-α in vitro (Supplementary Fig. 1d). ZRANB3—RNR-α interaction requires neither the PIP-box nor the polyubiquitin-chain-recognition function of ZRANB3 (Supplementary Fig. 1b-e). ZRANB3—RNR-α-interaction is also independent of helicase or nuclease activity of ZRANB3 (Supplementary Fig. 1e).
NLS-RNR-α constructs function similarly to the untagged
Consistent with previous studies30–32, ZRANB3 localizes to the nucleus (Fig. 1c). RNR-α is primarily cytosolic3,14,15. We first investigated how these two proteins meet in cells. All previous reports on RNR-α nuclear translocation3 are linked to RNR-reductase activity and DNA-damage either in stressed/damaged cells, or upon prolonged treatment with cytotoxic nucleoside-antimetabolites.
We generated nuclear-targeted RNR-α-constructs, both wild-type (wt) and C429S (a reductase-inactive mutant)33. The expression-levels/stabilities of these nuclear localization signal (NLS)-tagged variants is similar to non-NLS-tagged equivalents in HeLa and HEK293T (Supplementary Fig. 2a-c). RNR-β-levels/localization showed no change. We also investigated how dATP-feedback inhibition—one of the many nuanced aspects of RNR-α regulation—that may be influenced by RNR-α-overexpression, was involved in this process. We thus examined NLS-tagged/non-tagged variants of RNR-α(D57N), which lacks dATP-feedback regulation but features similar specific reductase activity to that of wt-RNR-α3,5,6. The ZRANB3 interaction was maintained with the D57N-mutantin lysates (Supplementary Fig. 2d). All three NLS-tagged variants—wt, C429S, and D57N—were nuclear localized (Supplementary Fig. 2a). Non-NLS-tagged-RNR-α(wt/D57N) was primarily cytosolic8,14,15.
Because endogenous RNR-β is primarily cytosol-localized3,14,15, we predicted that overexpression of nuclear-specific-RNR-α would not contribute to the amount of reductase-active RNR-complex and not affect dNTP pools. Overexpression of nuclear-targeted RNR-α (Supplementary Fig. 2a) did not perturb dNTP pools, but that of non-NLS-tagged-RNR-α (mostly cytosolic) (Supplementary Fig. 2a-c) elevated dATP levels (Supplementary Fig. 2e). Thus, nuclear-restricted constructs do not perturb canonical RNR function.
RNR-α impedes ZRANB3–PCNA binding in unstressed cells
Deletion of the ZRANB3 APIM-motif leads to 95%-reduction in PCNA-mediated recruitment of ZRANB3 to DNA-damage sites30. Since the APIM-motif is required for ZRANB3—RNR-α-interaction (Fig. 1b and Supplementary Fig. 1c-d), we proposed a ‘competition model’ wherein nuclear RNR-α forms a complex with ZRANB3 inside the nucleus, preventing the ZRANB3—PCNA interaction in the absence of DNA damage. Evidence is as follows: (1) Overexpression of either reductase-dead(C429S)- or wt-RNR-α-NLS reduced ZRANB3—PCNA-association in co-IP (Fig. 1d, Supplementary Fig. 3a-b). (2) Using purified proteins, ZRANB3(HNH-APIM)—RNR-α direct interaction was reduced in the presence of excess PCNA in the binding buffer (Supplementary Fig. 3c). (3) Excess PCNA fully eluted recombinant-RNR-α pre-bound to ZRANB3(HNH-APIM)-coated anti-HA beads (Supplementary Fig. 3d), within 30 min. (4) On a similar time scale, recombinant-PCNA interrupted co-IP of full-length ZRANB3 and RNR-α (Fig. 1e). (5) ZRANB3 and nuclear-RNR-α partly co-localized independent of reductase activity (Fig. 1c, Supplementary Fig. 4a-b). Consistent with the mutually-exclusive binding of RNR-α and PCNA to ZRANB3, RNR-α-NLS-overexpression reduced ZRANB3—PCNA puncta co-localization in both transient-expression lines (Fig. 1c, Supplementary Fig. 4b) and stably-integrated lines (Supplementary Fig. 4c-d).
Elevated nuclear RNR-α did not affect non-homologous-end-joining (Supplementary Fig. 5a), nor did it increase DNA-damage either in the basal-state or upon mitomycin-C-treatment, in both transiently-transfected cells and tetracycline-inducible Flp-In™ isogenic lines (Supplementary Fig. 5b-c). PCNA-ubiquitination—an established DNA-damage-induced-signaling-mechanism—was also unaffected (Supplementary Fig. 5d)30,34. Therefore, this novel nuclear-RNR-α—ZRANB3 interaction is uncoupled from the classical role of ZRANB3 in DNA-damage-induced replication stress.
In both native and cross-linked iPOND experiments—which identify proteins on nascent DNA35—RNR-α was not associated with chromatin (Supplementary Fig. 5e) and did not colocalize with PCNA/BrdU-puncta (Supplementary Fig. 6), further indicating that nuclear-RNR-α is not recruited to sites of DNA-synthesis.
As previously reported, ZRANB3 was recruited to small PCNA-foci upon mitomycin-C treatment, in the backdrop of either primarily-cytosol-localized-RNR-α(D57N) or nuclear-targeted-reductase-dead-RNR-α-NLS(C429S) (Supplementary Fig. 4a-b). These small PCNA/ZRANB3 foci did not contain RNR-α, consistent with the competition model between RNR-α and PCNA, and that damage and non-damage roles of PCNA/ZRANB3/RNR-α are uncoupled. Thus RNR-α—ZRANB3—PCNA form a novel axis wherein the degree of ZRANB3 association with PCNA is modulated by RNR-α-nuclear-levels. Upon DNA-damage, ZRANB3 re-associates with PCNA to aid DNA-damage-tolerance.
Nuclear RNR-α elicits growth inhibition
Since nuclear-targeted-RNR-α affected the constitutive interaction between ZRANB3 and PCNA, we hypothesized that nuclear-RNR-α may regulate proliferation by affecting DNA synthesis. RNR-α-overexpression suppresses Colo320-HRS cell growth21. Various nuclear-localized RNR-α constructs—RNR-α-NLS, RNR-α(C429S)-NLS, RNR-α(D57N)-NLS—were thus made and validated against primarily-cytosol-localized variants, RNR-α(D57N) and RNR-α-NES (Supplementary Fig. 2a-c). Consistent with our hypothesis, BrdU-incorporation analysis—reporting on DNA synthesis (S-phase cells)36—demonstrated that cells overexpressing nuclear-localized RNR-α showed reduced DNA-synthesis relative to cells in the same plate not expressing the transgene or expressing the cytosolic hypomorphic variant, RNR-α(D57N) (Supplementary Fig. 7). These data—from three different cell types (HeLa, Cos-7, and HEK293T)—showed that it is the presence of nuclear-RNR-α—rather than nuanced differences between each mutant—that is responsible for DNA-synthesis-downregulation. The isotypic output from RNR-α and RNR-α-NLS variants (regardless of reductase activity)—all of which have a significant nuclear contribution—provided a first hint that saturation of a specific binding site has occurred (Supplementary Fig. 8).
Nuclear-RNR-α suppresses growth in primary cells
Homozygous knock-in of the RNR-α(D57N)-mutation in the mouse RNR-α gene (Rrm1) causes embryonic lethality, but early embryos could be used to derive MEFs. MEFs from homozygous Rrm1+/+ or Rrm1D57N/D57N embryos 10 days-post-fertilization were cultured for 10 more days. BrdU-incorporation analysis suggested that Rrm1D57N/D57N MEFs were more proliferative than Rrm1+/+cells (Fig. 2a, Supplementary Fig. 9). Notably, RNR-α(D57N) was excluded from the nucleus in contrast to wt-RNR-α, explaining these differences.
Figure 2. Nuclear RNR-α suppresses DNA replication by eliciting loss of function of ZRANB3.

(a) Left: Quantification of: BrdU-positive fraction in MEFs. RNR-α+/+ (1), n=8; RNR-α+/+ (2), n=5; RNR-α+/+ (3), n=9; RNR-αD57N/D57N(1), n=8; RNR-αD57N/D57N(2), n=5; RNR-αD57N/D57N(3), n=9; where n indicates data taken from an individual frame and the bar shows mean from a specific plate. Points per bar denote fraction of cells (>20) proliferating. (Note: average of 3 wt sets proliferating is less than average 3 D57N sets proliferating, p<0.05). Two-tailed two sample t-test was applied. No adjustments were made. Precise p-values between each combination are: between RNR-α+/+ (1) and RNR-αD57N/D57N(1): 7e-5; between RNR-α+/+ (1) and RNR-αD57N/D57N(2): 1e-5; between RNR-α+/+ (1) and RNR-αD57N/D57N(3): 0.02; between RNR-α+/+ (2) and RNR-αD57N/D57N(1): 0.0002; between RNR-α+/+ (2) and RNR-αD57N/D57N(2): 0.0001; between RNR-α+/+ (2) and RNR-αD57N/D57N(3): 0.02; between RNR-α+/+ (3) and RNR-αD57N/D57N(1): 8e-6; between RNR-α+/+ (3) and RNR-αD57N/D57N(2): 9e-6; between RNR-α+/+ (3) and RNR-αD57N/D57N(3): 0.001. Right: nucleus:cytosol fraction of RNR-α in primary MEFs derived from different embryos Each bar derived from a separate embryo with points per bar denoting separate cells: [RNR-α+/+ (1), n=205; RNR-α+/+ (2), n=46; RNR-α+/+ (3), n=137; RNR-αD57N/D57N(1), n=100; RNR-αD57N/D57N(2), n=73; RNR-αD57N/D57N(3), n=276; where n indicates individual cells]. Average of 3 wt sets is greater than average 3 D57N sets, p<0.001. Two-tailed two sample t-test was applied. No adjustments were made. Precise p-values between each combination are: between RNR-α+/+ (1) and RNR-αD57N/D57N(1): 1e-18; between RNR-α+/+ (1) and RNR-αD57N/D57N(2): 6e-15; between RNR-α+/+ (1) and RNR-αD57N/D57N(3):5e-43; between RNR-α+/+ (2) and RNR-αD57N/D57N(1): 5e-31; between RNR-α+/+ (2) and RNR-αD57N/D57N(2): 2e-22; between RNR-α+/+ (2) and RNR-αD57N/D57N(3): 1e-56; between RNR-α+/+ (3) and RNR-αD57N/D57N(1): 1e-25; between RNR-α+/+ (3) and RNR-αD57N/D57N(2): 6e-20; between RNR-α+/+ (3) and RNR-αD57N/D57N(3): 4e-56. For box plots, center lines indicate medians, box limits are the first and third quartiles and whisker ends represent 10-90%. Data not included between the whiskers are plotted as an outlier with a dot. See also Supplementary Fig. 9. (b) Schematics for dual-pulse labeling, single-DNA-fiber-staining, and single-DNA-fiber-combing. For single-DNA-fiber combing, 3× wash cycles were performed after IdU treatment. See Methods. (c) Overexpression of wt-ZRANB3 partially rescues nuclear-RNR-α-induced DNA-synthesis suppression. The normalized DNA-synthesis efficiency (reported by “normalized BrdU-incorporation efficiency”) was determined by sequential dual-pulse labeling using EdU/BrdU in tetracycline-inducible isogenic cells expressing wt-RNR-α-NLS compared to the nuclear-translocation-defective hypomorph RNR-α(D57N). These cells were also transfected with either empty vector or a vector encoding wt-ZRANB3. Data for cells transfected with either empty- or ZRANB3-plasmid are respectively divided by the mean of the RNR-α(D57N) cells transfected with either empty- or ZRANB3-plasmid. Data show mean +/− s.e.m. [RNR-α(D57N), n=558; RNR-α-NLS, n=376; RNR-α(D57N), ZRANB3, n=368; RNR-α-NLS, ZRANB3, n=397]. Also see Fig. 2f and Supplementary Fig. 15b (presented using a ‘non-normalized’ Y-axis). (d) Single-DNA-fiber analysis shows ZRANB3-knockdown fails to reduce DNA-synthesis further in tetracycline-induced RNR-α-NLS-overexpressing-isogenic Flp-In T-REx™ 293 cells. Data show mean+/−s.e.m. (Tet−, siCont-1 n=291; Tet−, siZRANB3–1 n=312; Tet+, siCont-1 n=450; Tet+, siZRANB3-1 n=289) The p-value between siCont-1, Tet+ and siZRANB3-1, Tet+ is 0.49. See also Supplementary Fig. 8, 10–17. (e) HEK293T cells were transfected with indicated siRNA/plasmid combination and were analyzed after 2 days by dual pulse imaging. Data show mean +/− s.e.m. (Left panel: siCont-1, n=430; siZRANB3-1, n=399; siZRANB3-1+wt-ZRANB3, n=215; siZRANB3+2Xwt-ZRANB3, n=443; right panel: siCont-1 Empty vector, n=327; siZRANB3-1 Empty vector, n=634; siZRANB3 wt-ZRANB3 n=441; siZRANB3 Δ-PIP n=408; siZRANB3 Δ-APIM n=363; siZRANB3 Q519A n=313; siZRANB3 H1021A n=312; siCont-1 wt-ZRANB3 n=334). In the right panel, the p-values for n’s are: between empty vector, siZRANB3 and ΔPIP, siZRANB3: 0.10; between empty vector, siZRANB3 and ΔAPIM, siZRANB3: 0.16; between empty vector, siZRANB3 and Q519A, siZRANB3: 0.86. (f) Single-DNA-fiber analysis from cells with/without Tet-induced-RNR-α-expression shows only the overexpression of wt-RNR-α, but not the nuclear-translocation-defective hypomorph RNR-α(D57N), reduces the DNA-synthesis rate. [Data show mean+/−s.e.m. RNR-α(D57N), Tet+ n=151; RNR-α, Tet+ n=151, RNR-α(D57N), Tet− n=208; RNR-α, Tet− n=59]. The p-value between D57N, Tet- and wt, Tet- is 0.20. For full-view blots relevant to Fig. 2 and supplementary figures referred to above, see Supplementary Fig. 33–40, and 42. For Fig. 2(c)–(f), two-tailed t-test was applied. n indicates number of fibers or cells measured.
ZRANB3 is a positive regulator of DNA synthesis
Given the involvement of PCNA in our newly-identified nuclear-RNR-α—ZRANB3 axis, we investigated the consequences on DNA-synthesis. We used EdU/BrdU-dual-pulse labeling to accurately monitor global DNA-synthesis occurring over a precise time in S-phase [Fig. 2b (top)]. RNR-α-overexpression—which increases nuclear-RNR-α-levels—reduced DNA-synthesis rates (Fig. 2c). Ectopic-ZRANB3-overexpression partially rescued this nuclear-RNR-α-promoted DNA-synthesis-suppression (Fig. 2c).
These data allowed us to propose three possible models by which nuclear RNR-α suppresses growth through a mechanism involving DNA-synthesis inhibition. Model A: nuclear-RNR-α—ZRANB3-complex suppresses DNA-synthesis through ZRANB3 gain-of-function. Model B: nuclear-RNR-α induces loss-of-function of ZRANB3, i.e., ZRANB3 is a novel DNA-synthesis promoter. Model C: nuclear-RNR-α—ZRANB3-interaction has no correlation with growth-suppression.
Cells deficient for ZRANB3 (~70% knockdown efficiency, Supplementary Fig. 10a) exhibited ~30% decrease in DNA-synthesis-rate by both fiber-spreading and fiber-combing [Fig. 2b(middle and bottom), 2d(bar:1–2); Supplementary Fig. 10b-e]. EdU/BrdU-dual-pulse labeling [Fig. 2b(top)] also revealed 30–40% suppression of BrdU-incorporation (second pulse) upon ZRANB3-siRNA-knockdown in HEK293T (Supplementary Fig. 10f). Identical analyses in tetracycline-inducible shRNA-knockdown HeLa as well as constitutively-expressing sh-ZRANB3-knockdown NIH-3T3 showed moderate DNA-synthesis-suppression (~25% in BrdU-incorporation in HeLa, and 28% and 14% in EdU- and BrdU-incorporation, respectively, in NIH-3T3) (Supplementary Fig. 11a-b). ZRANB3-overexpression rescued the suppression [Fig. 2e(left) (HEK293T), Supplementary Fig. 11c (HeLa)]. Broadly consistent with a mechanism involving PCNA, both PIP- and APIM-deleted ZRANB3 (Supplementary Fig. 1a) could not rescue ZRANB3-knockdown [Fig. 2e(right), Supplementary Fig. 11c]. A PIP-inactivation mutation (Q519A, Supplementary Fig. 1e) did not rescue DNA synthesis [Fig. 2e(right)]. A nuclease-dead mutant (H1021A, Supplementary Fig. 1e) rescued ZRANB3-knockdown [Fig. 2e(right)], further indicating that this newly-identified role of ZRANB3 is distinct from its canonical role in DNA-damage30–32. Notably, ZRANB3-depletion neither altered the nuclear:cytosol distribution of RNR-α (or RNR-β) (Supplementary Fig.12a), nor changed γ-H2AX-levels (either in untreated or mitomycin-C-treated cells relative to controls (Supplementary Fig. 12b). However, ZRANB3-knockdown reduces proliferation rate and caused an increase in G1 (Supplementary Fig. 13). LDH-release assays indicated no cell death (Supplementary Fig. 14; NIH-3T3, HEK293T, HeLa).
Overexpression of RNR-α(D57N) (nuclear-excluded variant, Supplementary Fig. 2a-c) did not suppress DNA-synthesis (Fig. 2f, Supplementary Fig. 15a); whereas overexpression of wt-RNR-α, RNR-α-NLS, and the reductase-dead-RNR-α-NLS(C429S), exerted equal extent of DNA-synthesis-suppression (Supplementary Fig. 15a–b). The similarity in the suppression extent between wt-RNR-α and two NLS-tagged variants—namely, wt-RNR-α-NLS and C429S [both enriched >10-fold in the nucleus over wt-RNR-α (Supplementary Fig. 2a)], reinforces that saturation of a specific binding site—later identified as ZRANB3—occurs in the nucleus (Supplementary Fig. 8). As shown above, these data are not a function of dNTP-pool changes upon RNR-α overexpression (Supplementary Fig. 2e).
These findings indicate a novel role for ZRANB3 in non-stressed cells; ZRANB3 is a positive-regulator of DNA-synthesis and cell proliferation, and nuclear RNR-α inhibits this function, supporting Model B (Supplementary Fig. 15c). Consistent with this, increase in nuclear-RNR-α independent of reductase activity—via either wt-RNR-α overexpression, or expression of nuclear-restricted-construct—suppressed proliferation [Supplementary Fig. 15d(top)]. Interestingly, overexpression of RNR-α—regardless of reductase activity—increased the proportion of cells with S-phase DNA-content relative to the D57N-analog [Supplementary Fig. 15d(bottom)]. EdU-staining, however, showed a reduced proportion of cells actively synthesizing DNA (Supplementary Fig. 15e). These outcomes observed in isogenic tetracycline-inducible HeLa replicated those measured in other lines (Supplementary Fig. 7). No detectable cell death occurred (Supplementary Fig. 15f).
Nuclear-RNR-α inhibits ZRANB3-supported DNA synthesis
To further substantiate Model B (Supplementary Fig. 15fc), we showed by fiber-staining analysis that DNA-synthesis suppression upon tetracycline-induced RNR-α-NLS-overexpression (Fig. 2d, bar:3–4) did not occur in ZRANB3-deficient cells. This result confirms nuclear-RNR-α-promoted DNA-synthesis suppression is ZRANB3-dependent. Dual pulse-labeling method confirmed that the effect is reductase-activity independent (Supplementary Fig. 16a-b).
PCNA-overexpression alone did not cause lengthening of tracks in nuclear-excluded-hypomorph-RNR-α(D57N)-expressing cells. However, dual over-expression of RNR-α-NLS and PCNA increased DNA-fiber lengths relative to RNR-α-NLS alone (Supplementary Fig. 16c), reinforcing the competition between PCNA and nuclear-RNR-α for ZRANB3.
Sequential EdU/BrdU dual-pulse-labeling in HeLa showed that BrdU incorporation (second pulse) was significantly lower in cells expressing RNR-α-NLS, relative to the hypomorphic mutant, RNR-α(D57N) (Supplementary Fig. 16d). PCNA-overexpression fully rescued this effect (Supplementary Fig. 16d).
A non-RNR-α–binding ZRANB3 rescues reduced replication
There is significant variation across known APIM-domains37. There is some variation in ZRANB3-APIM domains across species (Supplementary Fig. 17a). We thus mutagenized various residues within and around the APIM-domain (1074–1078) in an attempt to derive a ZRANB3-mutant that could not bind RNR-α but that would retain PCNA-binding. From 13 mutants, we identified two potential ZRANB3-mutants less able to bind RNR-α than wt-ZRANB3: V1077A and K1078A (Supplementary Fig. 17b). We screened these mutants for ability to rescue RNR-α-overexpression-induced DNA-synthesis suppression. Using low levels of ZRANB3 plasmid—in which rescue by wt-ZRANB3 was measurable but minimal—we showed that V1077A-mutant rescued (to a significantly larger extent than wt-ZRANB3) the DNA-synthesis-suppression promoted by wt-RNR-α- or RNR-α-NLS-overexpression (Supplementary Fig. 17c). We validated that V1077A is functional for basal ZRANB3-activity: V1077A-overexpression in cells transfected with siZRANB3 rescued DNA-synthesis (Supplementary Fig. 17d). Critically, an analogous APIM-motif—KFLAR; bolded residue is analogous to ZRANB3-V1077A—is found in RAD51B, which is known to interact with PCNA via this conserved APIM-motif37.
dATP-mimetic drugs cause rapid RNR-α translocation
The D57N-mutant was the only RNR-α-variant hypomorphic for growth suppression. Since this mutant is unable to be regulated by dATP, we proposed that dATP-elevation might govern this axis. We first investigated the effects of non-natural deoxyadenosine (dA) mimics on the newly-discovered nuclear role of endogenous RNR-α. In three different cells (HeLa, Cos7, and HEK293T), treatment with clinically-used antileukemic dA-mimetics [clofarabine (ClF), cladribine (CLA), fludarabine (FLU)] under conditions that drive RNR-α6RD, resulted in nuclear translocation of a small amount of RNR-α (Fig. 3a-c, Supplementary Fig. 18a-g).
Figure 3. dA-Mimetics drive partial RNR-α nuclear translocation that saturates rapidly, independent of cell cycle, DNA damage, RNR-reductase activity, or RNR-β/-p53β.
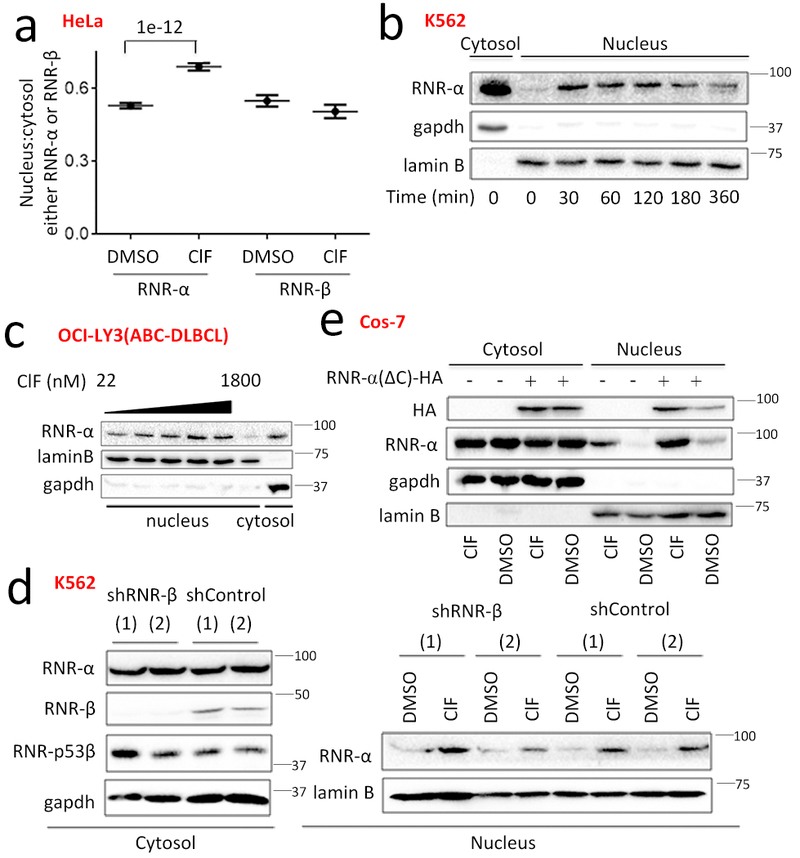
(a) Quantitation of RNR-α-translocation in ClF-(5 µM, 3-h)-/DMSO-treated HeLa cells by IF. Data show mean+/−s.e.m. (DMSO, RNR-α n=90; ClF, RNR-α n=135; DMSO, RNR-β n=46; ClF, RNR-β n=48). Two-tailed t-test was applied. n indicates number of cells measured. Note: the fact that there is no translocation of RNR-β rules out artifacts due to imaging incorrect focal plane. Also see Supplementary Fig. 18–21 and 24. (b) Time-responsive RNR-α-translocation in ClF-(5 µM, 3-h)-treated K562 cells analyzed by nucleus:cytosol-fractionation and western blot. See Supplementary Fig. 19d for quantitation. (c) OCL-LY3 cells were treated with various concentrations of ClF for 3 h, then nuclear RNR-α content was analyzed by western blot. (d) ClF-promoted-RNR-α-selective-translocation still occurs in RNR-β knockdown cells (see Supplementary Fig. 20d for the corresponding RNR-p53β-knockdown) [(1) and (2) represent two separate lines expressing shRNAs with different sequences]. K562 cells expressing sh-RNR-β or sh-Controls were treated (5 μM ClF, 3 h) and RNR-α-translocation was analyzed by fractionation and western blot. For full-view blots relevant to Fig. 3 and supplementary figures referred to above, see Supplementary Fig. 35–42. WB images are representatives of n=2 biologically independent experiments with similar results. (e) Catalytically-active, Tip60-binding-defective-mutant—RNR-α(ΔC)-HA42—translocates upon ClF-(5 µM, 3 h)-treatment of COS-7 cells expressing this mutant analyzed by fractionation and WB.
Identical outcomes were obtained—by both immunofluorescence and nucleus/cytosol fractionation—in blood cancer lines [K562, Raji(BL), and OCI-LY3(ABC-DLBCL)] treated with ClF (at a lower dose) (Fig. 3b-c, Supplementary Fig. 18h-i). The similar response across numerous lines indicates a general phenomenon.
Since (1) the volume of the nucleus is small compared to the cytosol38, (2) the basal amount of nuclear-RNR-α is low, and (3) percentage RNR-α-translocation upon treatment with dA-mimetics was modest, cytosolic RNR-α levels were unaltered during nuclear translocation. Consistent with previous reports8,10, expression of each RNR-subunit was unaltered by ClF (Supplementary Fig. 19a). RNR-β/-p53β-localization was unchanged (Fig. 3a, Supplementary Fig. 18a). Although immunofluorescence experiments can be affected by focal plane misalignments, selective translocation of RNR-α over RNR-β rules this artifact out. Ectopic RNR-β/-p53β-binding-defective loss-of-function mutant—RNR-α(W684G)39—translocated as efficiently as RNR-α (Supplementary Fig. 19b). The EC50 for translocation of endogenous-RNR-α was <300 nM at 3 h, and within 30-min treatment, translocation reached saturation with a nuclear-RNR-α content ~5-fold above background (Fig. 3b-c, Supplementary Fig. 19c-e). This rapid timeframe means translocation is unlikely due to cell-cycle perturbation, apoptosis, or cytotoxicity, which we also confirmed occur more slowly. We found no change in RNR-α nucleus:cytosol distribution between S-phase and outside of S-phase. Thus RNR-α nucleus:cytosol partitioning is unchanged across the cell cycle (Supplementary Fig. 20a-b).
Neither gemcitabine (F2C)—an RNR-α-binding inactivator3, nor triapine (3AP)—a RNR-β-isoform-specific inhibitor40 caused RNR-α nuclear translocation (Supplementary Fig. 20c). ClF elicited RNR-α-translocation in RNR-β/-p53β-knockdown lines (Fig. 3d, Supplementary Fig. 20d). Although these regimens change dNTP-pool levels41, as we show subsequently, dA- and ClF-treatment did not affect dNTP-pools similarly, implying that this nuclear signaling is not tuned to specific nucleotide changes.
A histone acetyl transferase—Tip60—mediates RNR-α-specific nuclear translocation upon DNA damage42,43. However, Tip60-binding-defective mutant—RNR-α(ΔC)42—still translocated (Fig. 3e). No DNA damage occurred post ClF-treatment based on the number of γ-H2AX-foci (Supplementary Fig. 20e). Taken altogether, this mode of RNR-α nuclear translocation is independent of DNA-damage.
ClF drives endogenous RNR-a—ZRANB3 association
The low-expression-levels of RNR-α and ZRANB3 render the study of their endogenous interactions challenging8,31. Nevertheless, we successfully co-IPed endogenous-ZRANB3 and endogenous-RNR-α, from lysates of native HEK293T (Supplementary Fig. 21a). No IP was observed using an isotype antibody control. ClF-treatment had no effect on the observed association in lysates since nucleus/cytosol-compartmentalization is lost (Supplementary Fig. 21b).
To investigate compartmentalized association, we deployed a cross-linking assay. HEK293T cells, pre-treated with either si-Control or si-ZRANB3, were treated with ClF or DMSO for 3 h, then treated with a cell-permeable cross-linker, EGS [ethylene glycol bis(succinimidyl succinate)] for 1 h. Following washing in quenching buffer, lysis, and IP with anti-RNR-α, western blotting with anti-ZRANB3 antibody showed that high-molecular-weight (HMW) ZRANB3—RNR-α complexes were observed only in ClF-treated siControl cells (Supplementary Fig. 21c). These HMW-bands were significantly reduced in ZRANB3-knockdown cells One of the HMW cross-linked bands was consistent with a cross-linked heterodimeric RNR-α—ZRANB3 complex, further indicating a direct interaction. The other bands are likely RNR-α tetramer/hexamer complexed to ZRANB3. Similar overall outcomes were observed upon replicating the similar cross-linking analyses in HeLa (Supplementary Fig. 21d). Here, isotype IgG was used instead of siRNA.
Anti-leukemic drugs induce discrete RNR(α6RD)-hexamers
Electron micrographs of negatively-stained recombinant-RNR-α treated with ClA/FlU-nucleotides revealed α-hexamers (α6RD)[(RNR-α)6ClATP/(RNR-α)6FlUTP; Fig. 5a, Supplementary Fig. 22, Supplementary Table 1] similar to those formed upon ClF-treatment8. Consistent with our previous studies10, the hexamers (α6RD) formed by the different drugs were pleomorphic (Fig. 4a, Supplementary Fig. 22) despite sharing a common “trimer-of-dimers” architecture (Supplementary Fig. 23). It is likely that (a) certain hexameric (α6RD) state(s)—distinct from the ATP-induced α6RS-state [(RNR-α)6ATP]—initiate(s) nuclear translocation. In line with the cell-based data for the nuclear-excluded hypomorph, the enzymatically-active—but α-hexamerization-(α6RD)-defective—RNR-α(D57N)mutant3,5,6 did not translocate upon ClF-treatment (Fig. 4b, Supplementary Fig. 20f). Since RNR-α(D57N) likely cannot form hexamers (α6RD), the (RNR-α)6dATP (or similar) state is probably necessary for translocation.
Figure 5. IRBIT regulates nucleus:cytosol levels of endogenous RNR-αthrough cytosol anchoring of RNR-α6RD-hexamers.
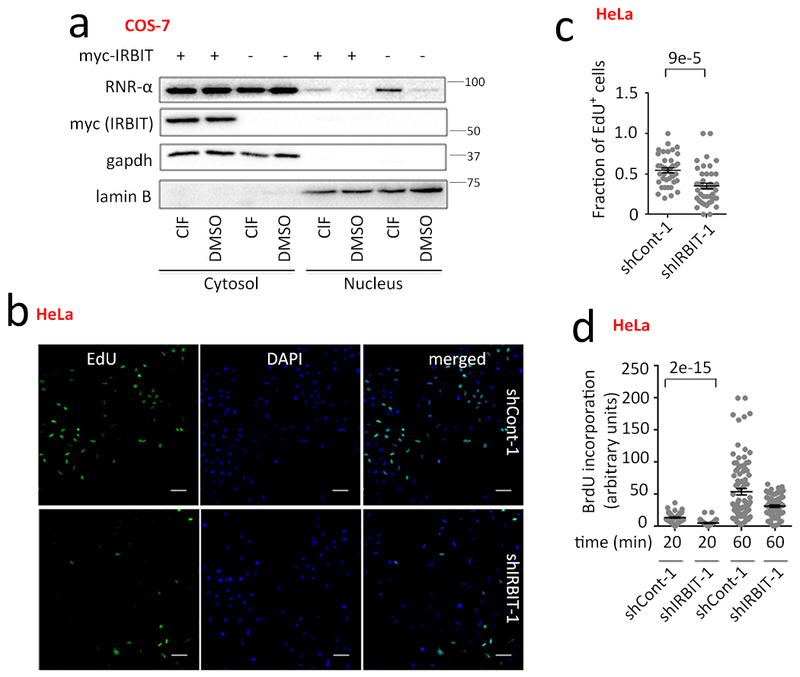
(a) IRBIT overexpression antagonizes endogenous RNR-α-partial nuclear translocation. Nucleus:cytosol-fractionation of COS-7 cells transiently transfected with either myc-IRBIT or vector-alone were treated subsequently with ClF/DMSO (5 μM, 3 h). WB images are representatives of n=3 biologically independent experiments with similar results. Supplementary Fig. 29–31. (b–d) IRBIT-knockdown causes DNA-synthesis-suppression: (b) as judged by EdU-staining analysis, and (c) quantitation [Data show mean +/− s.e.m. ~500-cells over more than 35 frames per condition (shCont-1 n=39; sh-IRBIT n=44, where n indicates separate frames from a specific plate]. IF images are representatives of n=3 biologically independent experiments with similar results. (d) Relative BrdU-incorporation-rate (in EdU-positive-cells) during the labeling-time-course. Data show mean +/−s.e.m. (shCont-1, 20 min, n=88; shIRBIT-1, 20 min, n=67; sh-Cont-1, 60 min, n=92; shIRBIT-1, 60 min, n=77; where n indicates number of cells measured). See also Supplementary Fig. 31c. For full-view blots relevant to Fig. 5 and supplementary figures referred to above, see Supplementary Fig. 37–41. Two-tailed t-test was applied in Fig. 5(c-d). See Statistics and Reproducibility section for sample size n. n indicates number of cells measured.
Figure 4. RNR-α-nuclear-translocation is functionally linked to RNR-α6RD hexamerizationdriven by dATP and its mimetics.
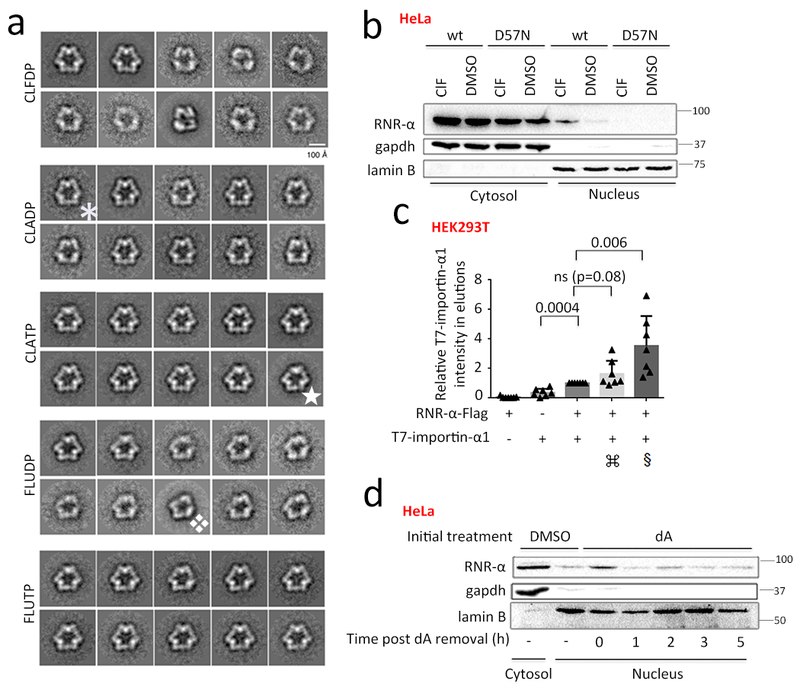
(a) Conformational variability (e.g., ✱, ✯, ❖) of the RNR-α6RD-hexamers induced by nucleotides [ClAD(T)P and FlUD(T)P] visualized by transmission electron microscopy. Images show class-averages representing the multiple conformations adopted by these oligomers. For each nucleotide, a data set of ~2000 particle images was collected and subjected to a maximum likelihood classification approach, assuming the existence of ten classes. RNR-α6RD-hexamers were assembled in the presence of the indicated nucleotide. In the dilution step before preparing the grids, the nucleotide was not included (see Methods). See also Supplementary Fig. 22–23 and Supplementary Table 1. (b) ClF (5 μM, 3-h)/DMSO-treated cells expressing wt-RNR-α-2XFlag or hypomorphic oligomerization- & nuclear-import-defective-mutant—RNR-α(D57N)-2XFlag, were analyzed by fractionation/western blot (HeLa). See also Supplementary Fig. 20f, 24–26. (c) Importin preferentially interacts with α6RD-hexamers: lysates from HEK293T cells expressing the indicated transgenes were subjected to Flag-IP. Additive: ⌘ and § indicate either dA (1 mM) or ClF (5 µM) in media (3 h), and either dATP (100µM) or ClFTP (5 µM) in IP-buffer, respectively; quantitation from 7 independent replicates. Data show mean +/− s.d. Two-tailed t-test was applied. N indicates biologically independent experiments. Also see Supplementary Fig. 27. (d) Fractionation and western blot analysis of nuclear RNR-α levels following pre-treatment of HeLa cells with dA (1 mM, 3 h) and subsequent removal of dA from media. See Supplementary Fig. 28a (quantitation) and 28b–g. For full-view blots relevant to Fig. 4 and supplementary figures referred to above, see Supplementary Fig. 35–41. EM images and WB images are representatives of n=2 biologically independent experiments with similar results.
dA2—an α6RD-inducing allosteric-suppressor3—elicited RNR-α-specific translocation; adenosine (A) and deoxyguanosine (dG) did not [Supplementary Fig. 24–25(a-b)]. dA-induced translocation was equally effective when dA/dT/dG/dC were added together (Supplementary Fig. 25c), indicating that translocation is independent of other nucleotides (non-hexamer-α6RD-inducers). RNR-α-hexamerization-α6RD-induced partial nuclear import functions independently of ZRANB3 (Supplementary Fig. 26).
RNR-α nuclear translocation is rapidly reversible
RNR-α associated with importin-α in a ClF-nucleotide-induced manner (Fig. 4c, Supplementary Fig. 27), explaining the elevated nuclear component upon hexamer (α6RD) formation. Although dA-nucleotides only weakly influenced association of importin with RNR-α, (α6RD)dATP are much less kinetically-stable than (α6RD)ClFTP3,8. Thus (α6RD)dATP are likely not sufficiently stable for co-immunoprecipitation.
Removal of dA from cells that had undergone dA-induced RNR-α-translocation elicited complete retro-translocation (Fig. 4d, Supplementary Fig. 28a) within 3–4 half-lives of dATP in asynchronous cells44. Whereas treatment of cells with dA significantly reduced DNA-synthesis within 30 min [Supplementary Fig. 28b(si-Controls)–c(bar:1–2)], dA removal restored DNA-synthesis within 30 min (Supplementary Fig. 28c)—the same time scale as dA-removal-driven RNR-α retro-translocation (Fig. 4d, Supplementary Fig. 28a) and the time it takes for RNR-α to elute from the RNR-α–ZRANB3 complex in vitro (Fig. 1e, Supplementary Fig. 3d). Thus, RNR-α translocation/retrotranslocation is kinetically competent to both stall DNA-synthesis transiently upon elevated dATP and allow restart once dATP-levels are rebalanced.
Nuclear-RNR-α signaling is not due to dNTP-pool changes
dA addition did not perturb dTTP-pools (Supplementary Fig. 28d-e). Thus reduced BrdU-incorporation upon dA-treatment is not due to increased competition between dTTP and (BrdU)TP for DNA-incorporation. Although dA-treatment raises dATP-levels but lowers dCTP/dGTP-levels, dNs—(i.e., dA/dG/dC/dT)—addition elevates all dNTP-levels except dGTP (Supplementary Fig. 28f). Both these conditions cause RNR-α translocation (Supplementary Fig. 24–25) and also ZRANB3-dependent DNA-synthesis-inhibition in the dual-pulse assay (Supplementary Fig. 28g). [dT was omitted from the dual-pulse assay (Supplementary Fig. 28g) as it competitively inhibits BrdU-incorporation (see Supplementary Fig. 28e for dNTP-pools upon dA/dG/dC-treatment)].
Contrary to dA addition that raised dATP and lowered dCTP/dGTP, ClF-treatment had little effect on dCTP-pools, but lowered both dATP and dGTP (Supplementary Fig. 28f). Since both dA- and ClF-elicited hexamers (α6RD) translocate to the nucleus, but ClF perturbs dNTP-pools differently to dA or dA/dG/dC/(dT) (Supplementary Fig. 28e-f), dNTP-pool changes are not strongly correlated with RNR-α translocation.
IRBIT negatively regulates RNR-α nuclear translocation
Although the preeminence of dATP controlling this pathway may be surprising, cells exclusively use dATP to regulate global dNTP-synthesis (and balance dNTP-pools). Furthermore, the only current candidate for mammalian analogs of the lower eukaryote RNR-reductase-activity-regulators (Sml1/Spd1), is IRBIT45—a dATP-controlled, hexamer-(α6RD)-specific regulator.
IRBIT—a cytosolic protein involved in calcium signaling—negatively regulates RNR-reductase-activity by selectively binding(α6RD)dATP45. We hypothesized that IRBIT is a negative-regulator of RNR-α-nuclear-translocation by sequestering (α6RD)dATP. IRBIT-overexpression antagonized ClF-induced-RNR-α-translocation (Fig. 5a, Supplementary Fig. 29a), consistent with previous reports that IRBIT binds selectively to (α6RD)dATP45. IRBIT-phosphorylation was unchanged by ClF (Supplementary Fig. 29b). Thus ClF did not modulate the phosphorylation-dependent IRBIT–RNR-α interaction45.
Basal nuclear-RNR-α levels were increased by IRBIT-knockdown in K562, HeLa and Raji (Supplementary Fig 30a-d) [which had little effect on cell-cycle distribution (Supplementary Fig. 30e)]. In IRBIT-knockdown HeLa, IRBIT-overexpression reduced RNR-α nuclear fraction (Supplementary Fig. 31a).
IRBIT-overexpression reduced nuclear-RNR-α (Fig. 5a, Supplementary Fig. 29a), providing further evidence that RNR-α-translocation occurs under basal conditions, likely due to (α6RD)dATP existing endogenously in cells. These data are consistent with IRBIT counteracting RNR-α nuclear translocation by selectively sequestering (α6RD)dATP/analogs in the cytosol.
Analysis of cyclin-E levels further verified that elevation in nuclear-RNR-α upon IRBIT-knockdown was cell-cycle independent (Supplementary Fig. 31b). RNR-β levels were unaltered upon IRBIT-knockdown (Supplementary Fig. 30a,d). Thus RNR-reductase-activity—upregulated in IRBIT-knockdown cells—is not coupled to RNR-α-translocation. The existence of two opposing α6RD-conformation-specific regulators of RNR-α-nuclear import—importin (positive) and IRBIT (negative)—explains why nuclear translocation is partial.
IRBIT knockdown alone sufficiently reduces DNA synthesis
Elevated nuclear RNR-α levels in IRBIT-knockdown cells sufficiently reduce DNA-synthesis
Dual-pulse labeling with EdU-followed-by-BrdU showed reduced DNA-synthesis-rate in IRBIT-knockdown cells (Fig. 5b-d, Supplementary Fig. 31c). Because IRBIT is a negative regulator of RNR-reductase activity, this result underscores that reductase activity is not positively correlated with changes in DNA-synthesis rate, but Nuclear-RNR-α levels do correlate with suppressed DNA-synthesis. Thus misregulation of RNR-α nucleus:cytosol partitioning can negatively impact DNA-synthesis under conditions where RNR-α is not overexpressed.
DISCUSSION
We delineate three interesting and interconnected findings: (1) ZRANB3 is a positive regulator of DNA-synthesis in “unstressed” cells; (2) the constitutively-expressed RNR-α, suppresses DNA-replication when in the nucleus—a new biological function of this ancient enzyme; (3) RNR-α can translocate to the nucleus and inhibit ZRANB3 that in turn affects DNA-synthesis. It is pertinent to stress that this study—that was undertaken both in vitro, in normal cells, cancerous cells, transformed cell lines, and primary cell culture—paints a consistent picture of how RNR-α negatively regulates ZRANB3 function, leading to DNA-synthesis retardation (Fig. 6).
Figure 6. Schematic model illustrating the double agent role discovered for the enzyme RNR.
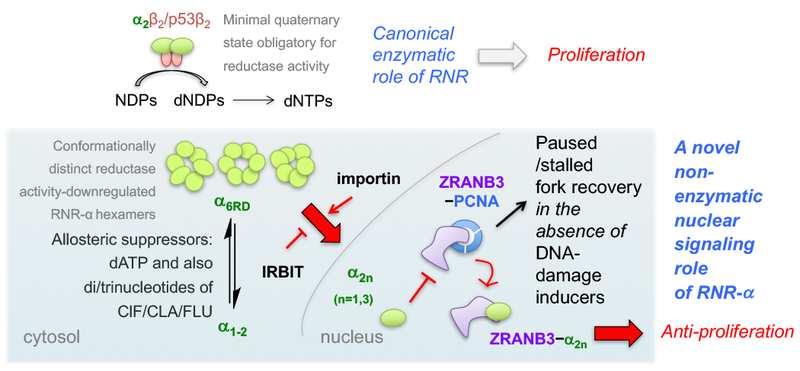
Top panel: canonical reductase capability of RNR-α promotes high-fidelity DNA-replication. Active reductase requires minimally a heterodimeric quaternary state as shown3. Currently the preponderance of data indicate that ATP-induced active hexamers also form3,7. Lower panel: This work uncovers a novel oligomerization-dependent reductase-activity-independent moonlighting function of RNR-α. This function—negative-regulation of DNA-replication—uniquely proceeds via nuclear-RNR-α translocation allowing direct binding to ZRANB3. Also see Supplementary Fig. 15c. Indicated nucleotides are capable of converting lower-order RNR-α species into conformationally-distinct α6RD hexamers. Also see Supplementary Fig. 23–23. Only a fraction of α6RD—likely those that selectively interact with importin-α1—translocates into the nucleus. IRBIT45 is a negative regulator of this nuclear translocation. This novel signaling pathway occurs in diverse mammalian cells not exposed to DNA-damage inducers. PCNA antagonizes this interaction. The ZRANB3–RNR-α direct interaction in the nucleus provides the molecular basis of the long-elusive, stage-specific tumor-suppressor role of RNR-α.
There remain residual unknowns. We have not fully delineated how ZRANB3 promotes DNA-synthesis/S-phase-entry. One recent report agrees that ZRANB3 depletion leads to elevation of G1-phase, although it did not find an effect on DNA-synthesis rate in ZRANB3-deficient cells not exposed to DNA-damage-inducers46. These observations are likely a manifestation of the complex regulatory networks that exist for ZRANB3, and further indicate that there are additional regulators/compensatory factors of this axis to be discovered.
Although we identified a functional ZRANB3-mutant defective for RNR-α-binding and hypomorphic for nuclear-RNR-α-promoted DNA-synthesis downregulation, identification of the corresponding sites on RNR-α is limited by intolerance of the human-RNR-α-protein to most mutations without perturbing its activity/function/solubility. However, our data involving binding studies between RNR-α(D57N) and ZRANB3 in lysates (no nuclear/cytosol-segregation), and recapitulation of many downstream assays with the engineered NLS-tagged-RNR-α-constructs (thereby by-passing hexamer-inducer-treatment) collectively indicate that RNR-α N-terminal-domain-based dimer-interface—obligate for RNR-α-trimer-of-dimer [(α2)3] formation3,5,8,9,12,47—is not necessary for ZRANB3–RNR-α interaction. Structure-based knowledge at the atomic level will ultimately enable novel interventions tapping into this growth-suppressive axis.
Finally, the importance of the ZRANB3/RNR-α interaction in more complex disease models, remains to be tested. We have identified many regulators of RNR-α-nuclear translocation and one negative regulator of the RNR-α—ZRANB3 interaction. These variables are critical to predict how nuclear-RNR-α may impact proliferation/transformation in a given cell-type/context. However, we cannot rule out other factors that influence this signaling pathway.
The delegation of RNR-α as a dual-regulator of DNA-replication cements the privileged position of RNR in mammalian physiology, and is elegantly parsimonious in design. RNR-α can assume this linchpin role because it is one of the most sensitive and versatile dNTP-pool sensors. Our single-fiber analysis shows a decrease in average fiber-length on the order of what was reported in IRBIT-knockdown cells (25–30%)45 which we show display elevated nuclear-RNR-α levels. The magnitudes of proliferation suppression are similar to decreases in DNA-synthesis measured by fiber-staining, fiber-combing, and dual-pulse labeling. We also observe changes in cell-cycle distribution upon ZRANB3-knockdown and nuclear RNR-α accumulation. Interestingly, for RNR-α-overexpression, S-phase arrest occurs; whereas when ZRANB3 is knocked down, G1-stall dominates, even though passage through S-phase is also slowed. This discrepancy is not ideal. However, these differences could reflect that ZRANB3 is multifunctional and nuclear-RNR-α affects some—but not all—ZRANB3 functions. It is also possible that RNR-α-overexpression exerts effects—other than ZRANB3-knockdown—that relax G1-arrest, allowing movement into S-phase. Nevertheless, ZRANB3-knockdown and RNR-α overexpression are epistatic for DNA synthesis suppression, and thus function in the same DNA-synthesis pathway.
The fact that both IRBIT-knockdown and increased cellular dATP that result in elevation and decrease of RNR-enzymatic-activity3,45, respectively, promoted functional translocation lends credence to the non-enzymatic nature of this activity. Since our data indicate that elevated nuclear-RNR-α does not affect global dNTP-pools, IRBIT-binding and nuclear-translocation are functionally redundant in terms of global RNR reductase activity. Thus negative regulation of RNR-α-translocation by IRBIT likely serves to control RNR-α-cytosol/nucleus partitioning. However, dNTP-synthesis regulation and DNA-synthesis inhibition are not equivalent functions. dNTPs present at any given moment can only produce a small fraction of the genome48. Thus regulated dNTP-production is required to sustain high-fidelity DNA-synthesis: lowering dNTP-pools promotes ribonucleotide incorporation49and affects origin-firing50,and hence is not optimal to downregulate DNA-synthesis. Elevated dNTP-pools are inherently mutagenic3. This imbalance cannot be redressed by modulating RNR-reductase activity, so transient DNA-synthesis inhibition is likely more appropriate.
Thus, RNR-α directly influences DNA-replication by reducing DNA-synthesis upon dNTP-pool imbalances. When dATP levels are elevated, RNR-reductase-activity is down-regulated, rendering RNR-α poised to assume a secondary role. RNR-α-nuclear translocation is rapidly reversible. Retro-translocation occurs on the order of dATP degradation44, thus RNR-α translocation provides a mechanism whereby DNA-synthesis can restart once nucleotide levels are rebalanced.
Online Methods
Chemicals and reagents, siRNAs, shRNAs, amino acid sequences of epitope tags, plasmids, antibodies and antibody validations.
Chemicals and reagents:
All chemicals were from Sigma-Aldrich and were of the highest grade unless otherwise stated. Bortezomib and Leptomycin B were from LC laboratories (working concentration: 5 nM and 15 nM respectively); Cyanine5(Cy5)-azide was from Lumiprobe; clorafabine (ClF), cladribine (CLA), and gemcitabine (F2C) were from AK Scientific. Radiolabeled dATP, [α–32P] (~2.1×10⁵ cpm/nmol) was from PerkinElmer. TCEP, deoxyguanosine (dG), deoxyadenosine (dA), adenosine (A) and EdU (working concentration 20 μM) were from Fludarabine monophosphate (FlUMP) was from Selleckchem. Deoxycytidine was from Sigma-Aldrich. ClFDP4 and triapine (3AP)40 were synthesized as previously reported. The chemical syntheses and mechanistic investigations of CLA- and FLU-nucleotides was described in detail elsewhere10. Hygromycin B and Zeocin were from Invitrogen. Recombinant RNR-α was purified as previously described4. CellTiter-Glo kit was from Promega and was used as suggested. AlamarBlue® was from Invitrogen, used as the manufacturer’s instructions. Minimal Essential Media, RPMI, Opti-MEM, Dulbecco’s PBS, 100X pyruvate (100 mM), 100X non-essential amino acids (11140–050) and 100X penicillin streptomycin (15140–122) were from Gibco. Alkaline phosphatase was from NEB (M0290S). Phos-tag acrylamide was from Wako Pure Chemical Industries, Ltd. Protease inhibitor cocktail complete EDTA-free was from Roche. 3XFlag peptide was from APExBIO. Anti-Flag(M2) resin (A2220) and anti-HA resin (A2095) were from Sigma-Aldrich. Streptavidin agarose (20353) was from Thermo Scientific. TALON (635503) resin was from Clontech. Ni-NTA agarose (30210) was from QIAGEN. Ethylene glycol bis(succinimidyl succinate) (EGS) and disuccinimidyl suberate (DSS) crosslinkers were from ThermoScientific. Bsu polymerase (M0300) was from New England Biolabs. Transfection: Cells were transfected using Mirus 2020 (all small scale and growth/proliferation experiments), Mirus TransIT.LT1 (for virus production), DharmaFECT Duo (for siRNA), or PEI (fractionation experiments that require 10-cm-diameter dishes). Venor™ GeM PCR-based mycoplasma detection kit was from Sigma. Cells were typically left for 24–48 h without changing media prior to harvest/assay. ECL substrate or ECL-Plus substrate were from Pierce and used as directed. Acrylamide, ammonium persulfate, TEMEDA, Precision Plus protein standard was from Bio-Rad. All lysates were quantified using the Bio-Rad Protein Assay (Bio-Rad), relative to BSA as a standard (Bio-Rad). PCR was carried out using Phusion Hot start II (Thermo Scientific) as per manufacturer’s requirements. All plasmid inserts were validated by sequencing at Cornell Biotechnology sequencing core facility. All sterile cell culture plasticware was from CellTreat, except for glass-bottomed dishes used for imaging that were from In Vitro Scientific. The cloning cylinders for harvesting cell colonies (3166–6) were from Corning.
siRNAs:
siZRANB3–1 siRNA was purchased from Dharmacon (D-010025–03-0005). siZRANB3–2 and siZRANB3–3 were purchased from Invitrogen (s38487 and s38488). Two negative control siRNAs were purchased from Santa Cruz Biotechnology (sc-37007 and sc-44230). The sequences of the 3 different ZRANB3-targeting siRNAs were: siZRANB3-1: GAUCAGACAUCACACGAUU; siZRANB3-2: CAAGAGAUAUCAUCGAUUAtt; siZRANB3–3: GAUUCGAUCUAAUAACAGUtt. (The siRNAs with “tt” addition to the 3’-ends were designed by the manufacturers to improve the stability). RNR-α siRNA (D-004270–01-0005, D004270–02-0002, and D004270–03-0002) and RNR-β siRNA (D-010379–05-0005) were purchased from Dharmacon and used for verification of antibody specificity. The sequences were: siRNR-α–1: GAACACAUACGACUUUA; siRNR-α–2: GGACUGGUCUUUGAUGUGU; siRNR-α–3: GCACAGAAAUAGUGGAGUA. The sequence of the RNR-β siRNA was GAGUAGAGAACCCAUUUGA.
shRNAs:
The following shRNA sequences were used in pLKO1 vector. The shRNA plasmids for RNR-α, RNR-β and IRBIT were gifts from Professor Andrew Grimson (Cornell University). The shRNA plasmids for RNR-p53β were purchased from Sigma-Aldrich. For details, see lentivirus production and infection methods. sh-Controls: (1) CGCGATCGTAATCACCCGAGT (lac Z); (2) GTCGAGCTGGACGGCGACGTA (GFP). sh-RNR-β: (1) GCTCAAGAAACGAGGACTGAT; (2) CCCATTTGACTTTATGGAGAA. sh-IRBIT: (1) CAATGTCTAAATCGCCTTAAA; (2) CGGCAAGTCGATGTCGTAATA; (3) GCACTGATAGAACTCTATAAT; (4) CCAGAAAGTTGATTCTTTA (mouse). sh-RNR-p53β: (1) GCGATGGATAGCAGATAGAAA; (2) GCAGCCAGTGATGGAATTGTA. sh-ZRANB3: (1) TGGTCTTTGCGCACCATTTA (mouse).
Amino acid sequences of epitope tags:
Flag tag, DYKDDDDK; HA tag, YPYDVPDYA; T7 tag, MASMTGGQQMG; myc tag, EQKLISEEDL; NLS, PKKKRKV; SFB (S-tag, Flag tag, and streptavidin binding peptide) tag; KETAAAKFERQHMDSGAGAGAGADAPDYKDDDDKGDYKDDDDKGASMDEKTTGWRGGHVVEGLAGELEQLRARLEHHPQGQREP; His tag, (H)HHHHH.
Plasmids:
Plasmid pCMVTNT-T7-KPNA2 (importin-α1) (26678), pcDNA3–3Xmyc-Nrf2 (21555) and pcDNA5/FRT/TO-Venus-Flag (40998) were purchased from Addgene. pOG44 Flp-Recombinase Expression Vector was purchased from Thermo Scientific. Empty pcDNA3 plasmid was a gift from Professor Barbara Baird (Cornell University). pfastbac-GST-IRBIT was a gift from Dr. Alexei Arnaoutov (Eunice Kennedy Shriver National Institute of Child Health and Human Development, NIH, Bethesda, MD). The plasmids pMIR-His6-RNR-α, pMIR-DsRed-IRES-His6-RNR-α, and pET28a-His6-RNR-α were gifts from Professor JoAnne Stubbe (Massachusetts Institute of Technology). The plasmids SFB-ZRANB3, SFB-ZRANB3-ΔPIP and SFB-ZRANB3(Q519A) were gifts from Professor Jingsong Yuan (Columbia University Medical Center). The plasmids YFP-ZRANB3 and Flag-ZRANB3 were gifts from Professor Dragana Ahel (Oxford University). The plasmid pet15b-His5-PCNA was a gift from Professor Zhihao Zhang (University of Delaware). The pcDNA3-RNR-α expression plasmids and SFB-ZRANB3 mutant plasmids were constructed as described in Supplementary Table 1.
Antibodies:
(WB = western blot; IF = immunofluorescence; FLOW = flow cytometry): RNR-α [AB81085, AbCam. 1:1000 (WB), 1:200 (IF/FLOW)]; RNR-β [AB57653, AbCam. 1:1000 (WB), 1:200 (IF)]; RNR-p53β [AB8105, AbCam. 1:1000 (WB)]; gapdh-HRP [G9295, Sigma-Aldrich. 1:30000 (WB)]; lamin B [SC6217, Santa Cruz. 1:250 (WB)]; Flag [PA1–984B, Fisher Pierce. 1:1000–2000 (WB), 1:200 (IF)]; HA-HRP [2013819, Roche. 1:2000]; BrdU [Ab8152, AbCam. 1:1000 (IF); NA61, Calbiochem, 1:1000 (Clone MoBu-1, Dual Pulse, selective for BrdU over EdU); AB6326, Abcam. 1:400 (DNA fiber staining); 347580, BD Biosciences, 1:25 (DNA fiber staining)]; γ-H2AX [05–636, Millipore. 1:1000 (IF)]; IRBIT [SC162507, Santa Cruz. 1:500 (WB)]; Fibrillarin, [SC-166001, 1:250, (IF)]; Myc [MMS-150, Covance. 1:1000 (WB)]; GFP-FITC [AB66180, AbCam. 1:200 (IF)]; rabbit anti-Ubiquitin [Ab7780, AbCam. 1:1000 (WB)]; Ku80 [2180s, Cell Signaling. 1:1000 (WB)]; Histone H3 [4499s, Cell Signaling. 1:1000 (WB)]; T7 [AB18611, AbCam. 1:500 (WB)]; ZRANB3 [A303–033-A, Bethyl Laboratories. 1:2500 (WB)]; Cyclin E2 [4132s, Cell Signaling. 1:1000 (WB)]; goat anti-rabbit Alexa-647 [AB150063, AbCam. 1:1000 (IF)]; goat anti-rabbit Alexa-488 [A11008, Invitrogen. 1:1000 (IF/FLOW)]; goat anti-mouse-FITC [1010–02, Southern Biotec. 1:1000 (IF, DNA fiber staining)]; anti-rabbit-HRP [AB99702, AbCam 1:5000 (WB)]; anti-mouse-HRP [AB6789, AbCam 1:5000 (WB)]; anti-goat-HRP [AB97100, AbCam 1:5000 (WB)]; donkey anti-rat-Alexa 568 [AB175475, Abcam, 1:200 (DNA fiber staining)]; donkey anti-rabbit Alexa 647 [Ab150075, AbCam, 1:1000 (IF)]; donkey anti-mouse Alexa 568 [Ab175472, AbCam, 1:1000 (IF)].
Validation of antibodies:
Many of the antibodies were themselves used to show knockdown of proteins using multiple shRNAs. The antibody specificities of RNR-α and RNR-β were verified using targeted siRNA knockdowns (see above for sequence information). For instance, the percentage loss of fluorescence staining was quantitated to be 68–72% [three replicates; p <1e-15 with respect to control for each (for cytosol); and <1e-15/3e-9/1e-8 (for nucleus)] and 33% for endogenous RNR-α. In addition, for many experiments results were replicated by detecting ectopic expression of an epitope-tagged version (where the gene of interest from both non-transfected and transfected cells can be viewed in the same frame, validating the specificity of the antibody). By this metric, we showed that the data for ectopically overexpressed proteins are consistent with the IF data for the endogenous protein. Anti-Flag/myc/HA were used to detect many ectopic proteins, thereby eliminating doubts about antibody specificity. Within the IF experiment protocols and SI figure legends, we have cautioned the readers for the choice of methanol over formaldehyde fixing method in IF, because many anti-RNR antibodies and various fixing methods gave rise to non-consistent results between ectopic proteins vs. overexpressed proteins. All of our data were consistent across cell lines from multiple species (human, monkey, mouse) as well as cell types (HeLa, COS-7, HEK293T, K562, Raji, OCI-LY3, etc.) and primary cells from knock-in mice. With nucleus/cytosol fractionation, leakage of more proteins (including RNR-α/RNR-β, etc.) from the nucleus happens over the course of the procedure. We thus consistently used IF as an independent validation for all of the cell–fractionation analysis. Notably, the western blot and IF data for the respective endogenous proteins in native cells we present are consistent with various literature reports from independent labs wherever possible.
Equipment:
Plate reader assays were carried out on a Biotek Cytation 3 plate reader. All imaging was carried out on a Zeiss LSM710 or i880 confocal microscope (Cornell Biotechnology Imaging Core Facility), equipped with an Inverted Axio Observer.Z1 microscope with 405, 458, 488, 514, 543, 561, and 633 nm laser lines. Electron microscopy was performed was performed in a JEOL 2010F FEG electron microscope (Canadian Centre for Electron Microscopy; McMaster University). Flow cytometry was carried out on a Beckman Dickinson LSR-II flow cytometer (Cornell Biotechnology Flow Cytometers Core Facility) equipped with 407, 488, 633 nm lasers. Typically, single color analysis was conducted. For two-color analysis, chromatically orthogonal fluorophores (488, 647 nm) were used without compensation aside from NHEJ assays, where compensation was applied as required. Western blots were all imaged using HRP-conjugated secondary or primary antibodies. Gels were stained using Coomassie brilliant blue. Gel imaging was performed using a ChemiDoc Imager (Bio-Rad).
Sample size n for figures with quantification.
n for imaging experiments represents the number of single DNA fibers, single cells, or in a few instances, panels quantified from at least ten fields of view. n for western blot represents the number of lanes on western blots under identical experimental condition from biologically independent experiments. All imaging data originate from at least 3 or more independent biological replicates using cells cultured in independent flasks or dishes and at different passage numbers (all kept below no more than 10 passages, and for shRNA lines below 5 passages). All t-tests were two-tailed and unpaired. The total number of degrees of freedom for all the two sample t-test is n1+n2–2, where n1 and n2 represent sample size n for the two samples. The confidence interval for all the test is 95%.
Cultured cells and generation of MEF cultures from Rrm1+/D57N mice
Cell lines—HEK293T, Cos-7, HeLa, and K562—were from ATCC. Flp-In T-REx™cells were from Invitrogen. All cell lines were validated mycoplasma free using the MycoGuard® Mycoplasma PCR detection Kit every 3 months. Cells were maintained below passage 10, and were thawed from stocks of cell lines that had previously been validated to be mycoplasma free. Most cells were grown in MEM supplemented with 10% FBS, 1X pyruvate and non-essential amino acids and 1X penicillin/streptomycin in a humidified atmosphere at 37 °C with 5% CO2. K562 cells were grown in RPMI supplemented with 10% FBS and 1X penicillin/streptomycin in a humidified atmosphere at 37 °C with 5% CO2. All animals used in this study were handled in accordance with federal and institutional guidelines, under a protocol approved by the Cornell University Institutional Animal Care and Use Committee (IACUC). To create Rrm1D57N knock-in mice, the Rrm1D57N point mutation was introduced into the endogenous mouse Rrm1 locus by homologous recombination in mouse embryonic stem cells, using a targeting construct that was generated by recombineering and contained a guanine-to-adenine transition in codon 57, in the third exon of mouse Rrm1. (Rrm1 is the gene for mammalian RNR large subunit, RNR-α). Correctly targeted clones were confirmed by Southern blotting and sequencing, and the Neo cassette used for positive selection was removed by Cre-mediated recombination. A detailed description of the resulting Rrm1D57N knock-in mouse strain will be published elsewhere. To generate mouse embryonic fibroblast cultures, Rrm1+/D57N mice on the 129S6 strain background were interbred in timed matings, and embryos were collected and cultured at mid-gestational stages. Genotyping was performed by PCR on DNA from yolk sac tissue. Mouse embryonic fibroblasts were grown on glass bottomed dishes in DMEM supplemented with 10% FBS and 1X penicillin/streptomycin in a humidified atmosphere at 37 °C with 5% CO2. Cell stocks were maintained in 10% DMSO in FBS and stored in liquid nitrogen.
Generation of Isogenic Flp-In T-REx™ HEK293 and HeLa cells
For generation of isogenic Flp-In T-REx HEK293 or HeLa cell lines expressing RNR-α-NLS-2XFlag and DsRed, Flp-In T-REx HEK293 cells were cultured in MEM supplemented with 10% FBS, 1X pyruvate and non-essential amino acids, 100 µg/ml zeocin and 1X penicillin/streptomycin in a humidified atmosphere at 37 °C with 5% CO2. The cells were co-transfected with the POG44 vector encoding the Flp recombinase and pcDNA5/FRT/TO-RNR-α-NLS-2XFlag using Mirus 2020 in 6 well plates. Two days after transfection, the cells were split and passaged into 10 cm dishes, then after 1.5 d were changed to selective media containing 150 µg/mL Hygromycin B. After 3 weeks, single colonies had formed, and these were ultimately harvested using cloning cylinders. Individual clones were grown in 12 well plates, and verified for expression using western blot or imaging. To induce expression, cells were exposed to 100–200 ng/mL tetracycline and incubated for 48 h before treatment with EdU for 45 min, then fixing.
Generation of knockdown cell lines using lentivirus
HEK293T packaging cells were seeded and grown overnight in antibiotic free media in 6 well plates. At 80% confluence, each well was transfected with packaging plasmid (pCMV-R8.74psPAX2, 500 ng), envelope plasmid (pCMV-VSV-G, 50 ng) and pLKO vector (500 ng) using TransIT.LT1 as per the manufacturer’s protocol. After 18 h media were removed and replaced with 20% serum containing media. After 24 h, media were collected, spun down and passed through a 0.8 micron filter and stored at –80 °C or used directly. Cells in log phase were treated with 1 ml of virus supernatant (from above) in 8 μg/ml polybrene in a total of 6 ml of media in a 6-well plate. After 24 h, media were removed and replaced with media containing 2 μg/ml puromycin (which was 100% toxic to all lines used in this study). Cells were cultured till plate was confluent, then cells were split and moved to a 10 cm dish in 2 μg/ml puromycin containing media and grown till confluent again. At this point the line was considered to be “selected”, and expression of target gene was analyzed by western blot and compared to shRNA controls. Up to passage 5 was used for these cells and they were typically grown in 1.5 μg/ml puromycin.
SDS-PAGE and western blot
SDS-PAGE was carried out using polyacrylamide gels (typically 10%) on a Bio-Rad miniprotean II apparatus. Transfer was carried out using a tank apparatus in transfer buffer (Towbin Buffer containing 15% MeOH). Samples were transferred onto PVDF membrane that had been pre-equilibrated in 100% MeOH for 3 min, then transfer buffer until required, at 90V for 1 h, then 90 V for 3–4 h in an ice bath with stirring. Blots were blocked in 5–10% fat free milk (Wegmans) then exposed to primary and secondary antibodies in 1% fat free milk. All blocking/incubation/wash solutions were made in 100 mM Tris pH 7.6, 150 mM NaCl, 0.05% Tween-20. Aside from last wash prior to visualization that did not contain Tween-20. Mostly blocking was carried out for 1 h at room temperature (rt), and the blot was incubated with primary antibody overnight at 4 °C. Secondary antibody incubation was for 40–60 min. When required, HRP was inhibited using sodium azide, or blot was stripped using SDS/BME (55 °C).
Nucleus:cytosol fractionation
Cells were detached using trypsin and washed twice with PBS. The cell pellet was then resuspended in around five pellet volumes of extraction buffer A (20 mM Tris, pH 7.6, 0.1 mM EDTA, 2 mM MgCl2, 0.5 mM NaF and 0.5 mM Na3VO4 with recommended amount of Roche protease inhibitor tablet). After incubation for 2 min at rt and for another 10 min on ice, a 10% Nonidet P-40 solution was added to obtain a final Nonidet P-40 concentration of 1%. The cytosolic extract was separated from intact nuclei by centrifugation in a pre-chilled tabletop centrifuge at 4 °C and 500×g for 3 min. The top 50% of the supernatant was aspirated and saved as cytosolic extract. The pellet was then washed three times with 10 pellet volumes for extraction buffer A with 1% Nonidet P-40. Each time, the nuclei were pelleted by centrifugation at 4 °C and 500×g for 3 min. The purified nuclear pellet was resuspended in one pellet volume of extraction buffer B (20 mM HEPES pH 7.9, 400 mM NaCl, 25% vol/vol glycerol, 1 mM EDTA, 0.5 mM NaF, 0.5 mM Na3VO4 and 0.5 mM DTT with the recommended amount of Roche protease inhibitor tablet) and vortexed rigorously. The mixture was freeze-and-thawed three times in liquid nitrogen and incubated on ice for 20 min. After that the soluble nuclear proteins was separated from the insoluble fraction by centrifugation at 4 °C and 20,000×g for 20 min. Typically, 25 μg of each lysate was analyzed by western blot. During fractionation experiments, leakage from the nucleus occurs over time, and hence basal nuclear levels are dependent on total sample size, and variations that are specific-experiment-invariant, but run-to-run variant. Multiple replicates support the same translocation process in 4 different cell lines and we thus consistently used immunofluoresnce (IF) as an independent validation for all of the cell–fractionation analysis. Absolute variations of one lane from one blot and that in another blot are not affecting the conclusions made.
Imaging analysis
Cells were grown in 35 mm glass bottom plates to appropriate confluence and treated as described. At the conclusion of the experiment cells were fixed by addition of 2 ml MeOH (–20 °C) for 20 min (– 20 °C). MeOH was removed and PBS was added and stored at 4 °C for days to weeks. NOTE: fixing with MeOH is critical for appropriate visualization of RNR-α. Only for imaging BrdU-treated cells: directly before blocking, cells were treated with 1 M HCl at 4 °C for 10 min, then 2 M HCl at rt for 10 min, then warmed to 37 °C for 10 min. Cells were then washed 3 times with PBS and carried straight on to blocking. When required cells were treated with 2 ml imaging blocking buffer: 3% BSA & 0.2% Triton x-100 in PBS at 37 °C for 1 h. Plates were washed 2 times with PBS (1 ml), then treated with primary antibody (dilutions: RNR-α, RNR-β, IRBIT, Flag 1:200; BrdU, γ-H2AX 1:1000), in antibody incubation buffer: 1% BSA and 0.02% Triton x-100 in PBS, using 120–150 μl to cover only the glass portion of the plate. Plates were incubated at rt for 2 h. Primary antibody was removed (it could be reused at least 3 times) and plates were washed two times with PBS (1 ml). Then secondary antibody (120–150 μl; 1:1000 dilution in antibody incubation buffer) was added (1 h). Plates were washed one time in PBS containing 1 μg/ml DAPI, then once with PBS and stored at 4 °C until ready to image. For imaging Raji cells, all steps prior to fixation were performed on non-adhered cells. Prior to imaging, cells were placed on fibronectin-coated glass backed imaging plates for 10 min, then media were removed and adhered cells were fixed and analyzed similarly to above.
For imaging of EdU-treated cells, after blocking step, cells were treated with a freshly made mix of 1 mM CuSO4 (from a 100 mM CuSO4 stock in water), 10 mM sodium ascorbate in 50 mM HEPES pH 7.6 and 15 μM Cy5-azide was added directly to cells for 40 min in the dark. Note 1: this mix must be made just before use. Note 2: treating with HCl is NOT required for EdU treated cells. Then cells were treated with imaging blocking buffer for 10 min, then washed twice with PBS, then primary antibody buffer was applied and subsequent steps were carried out as described above.
Quantification of imaging data
Quantification of nucleus:cytosol partitioning in images was performed using the histogram function in Image-J (NIH). For all instances, at least 40 cells from multiple independent frames were captured. Plotted data show mean +/− s.e.m > 40-cells-per-point. Most of the magnification settings were 40× water objective with 10× digital zoom. Imaging data shown are mean and s.e.m. and significance was assessed using the T-test. For EdU/BrdU incorporation analyses, data were collected using a 20× oil objective with 10× zoom and calculated using manual picking of cells transfected or non-transfected, or incorporating or not-incorporating BrdU/EdU. These were split into groups of 20–40 cells arbitrarily, and the number of cells positive/negative for BrdU or EdU incorporation, and/or positive or negative for transfection, was calculated. This was repeated >16 times, and then the means of the total group sets was calculated and compared using the T-test. On average, ~20 groups in total were evaluated. For all other data sets, data were collected using a 40× water objective with an 8× zoom and BrdU intensities of individual EdU positive cells were calculated, averaged and analyzed using the T-test.
Electron microscopy data acquisition and rotational symmetry analysis and maximum-likelihood-based classification approach
Complexes were assembled by mixing recombinant RNR-α (10 µM) with the respective nucleotide (100 µM, ClFDP as positive control; 250 µM for ClADP, ClATP, FlUDP or FlUTP) in assembly buffer [50 mM HEPES (pH 7.6), 15 mM MgCl2, and 5 mM DTT], for 2 min at ambient temperature. The sample was then diluted 100-fold in assembly buffer (with or without the presence of respective nucleotide inhibitors, as indicated on the result section and figure legends) immediately prior to depositing onto an EM grid freshly coated with a continuous layer of amorphous carbon. A glow-discharge treatment of 5 mA for 15s was applied to the EM grids before they were floated on a 5-µl drop of the diluted assembly reaction for 2 min. Excess of sample was blotted with filter paper and the grids were stained with 1% uranyl acetate for 1 min. Images were collected on a JEOL 2010F electron microscope operated at 200 kV at 50,000× magnification with a dose of ~20 electrons per Å2. Images were recorded on Kodak SO-163 films and scanned on a Nikon Super COOLSCAN 9000 ED producing images with a pixel size of 1.27 Å per pixel. Images were bin by two before they were used to obtain class averages. Image processing of the electron micrographs was performed with programs from Xmipp, EMAN and Rotastat software packages.
To formally establish the symmetry of the observed rings (Supplementary Table 1), particles from the electron micrographs were selected, extracted, and their rotational symmetry analyzed using the spectral ratio product and Student’s t test as implemented in the Rotastat software51. These tests compared the rotational power spectra of particle images containing ring-shaped particles with that of background images of the same size. To calculate the class averages of the oligomers exhibiting 3-fold rotational symmetry required to first separated particles exhibiting this symmetry from the rest using self-organizing featured maps. Subsequently a 2D average was computed from these particles. Averages were obtained both for samples where the reaction was diluted in buffer containing inhibitor (250 µM) and for those diluted in the buffer without inhibitors. Conformational variability of the hexamers (α6RD) was analyzed using maximum-likelihood-based classification approaches as implemented in the Xmipp software package52–54.
Immunoprecipitation
HEK293T were grown as described. After 36 h, cells were harvested and washed twice with PBS, and once with 50 mM HEPES pH 7.6. Cells were resuspended in lysis buffer (50 mM HEPES pH 7.6, 100 mM NaCl, 1% Nonidet P-40, with Roche protease inhibitors and freeze thawed, and vortexed with glass beads three times. The lysate was spun down (15000×g, 10 min at 4°C then normalized to 5 mg/ml with a final concentration of 0.5% Nonidet P-40. To lysate was added 50 μl settled anti-FLAG M2 resin and incubated for 30 min at rt. Resin was pelleted (900×g, 5 min) then washed three times for 5 min each in 1 ml of 50 mM HEPES pH 7.6, 100 mM NaCl, 0.1% Nonidet P-40 at rt. Proteins were eluted using 3X FLAG peptide in wash buffer at 4 °C for 1 h. For examining polyubiquitinated proteins, proteins were eluted using 2X Laemmli Buffer at 60 °C. For experiments where cells were treated with ClF or dA, all lysis and wash buffers contained 5 μM ClF-nucleotide or 100 μM dATP.
DNA fiber staining analysis
HEK293T cells were incubated with 37 μM IdU for 30 min then media were removed and replaced with media containing 250 μM CldU for 30 min. Spreading of DNA fibers on frosted glass slides was performed as described55. Glass slides were then fixed with AcOH/MeOH (1:3) for 10 min and then fixed in 2.5 M HCl for 80 min followed by three washes in PBS. Slides were incubated for 30 min in blocking buffer (PBS with 5% BSA) in a humidified chamber and then rat anti-BrdU antibody (Abcam, ab6326)/mouse anti-BrdU (BD Biosciences, 347580) in blocking buffer were added and slides were kept in a humidified chamber overnight at 4°C. After washing with PBS three times, the slides were exposed to goat anti-mouse FITC and donkey-anti rat Alexa 568 in blocking buffer at rt for 1 h. Slides were washed three times in PBS then mounted in vecta shield and stored at −20 °C. Slides were analyzed on a Zeiss 710 confocal instrument. Only fibers that were being synthesized during the first pulse were considered (both green and red) and only the length of the fibers formed during the second pulse were analyzed.
DNA Fiber combing analysis
This protocol was conducted as directed by Genomic vision. Visualization was performed essentially the same, except anti-ssDNA was omitted and dual color imaging was carried out on a confocal microscope.
EdU analysis using flow cytometry
30000 HEK293T cells were plated in a 6-well plate. After 1.5 d, at approximately 30% confluence, cells were transfected with the indicated plasmid and maintained for 36 h. After this time, cells were trypsinized, washed with media, spun down (700×g, and resuspended in 100 μl PBS, then fixed (with 900 μl MeOH at –20 °C, and then maintained at 4 °C for at least 20 min to a few weeks). When ready, cells were pelleted by centrifugation (1500×g, 5 min), supernatant was aspirated, then cells were resuspended in blocking buffer (3 % BSA in 50 mM HEPES pH 7.6) at 37 °C for 1 h. Cells were washed once with 50 mM HEPES pH 7.6 then a fresh mix of 1 mM CuSO4 (from a 100 mM CuSO4 stock in water), 10 mM sodium ascorbate in 50 mM HEPES pH 7.6 and 15 μM Cy5-azide was added directly to cells for 40 min (with rotation in the dark). Note: this mix must be made just before use. Cells were centrifuged and washed with blocking buffer for 10 min, then washed once with PBS. 100 μl primary antibody in primary incubation buffer (1% BSA in PBS) was next added and incubated with the fixed cells for 1–2 h with rotation in dark. After this time, rotation could be moved to 4°C until needed for a few hours to overnight. Cells were then washed once with PBS, then 300 μl secondary antibody (1:800 dilution, must use a chromatically orthogonal dye such as Alexa-488) was added in primary incubation buffer for 1 h only. Cells were then washed once with primary incubation buffer (500 μl), and subsequently analyzed by flow cytometry.
Streptavidin pulldown of SFB-tagged ZRANB3 and associated proteins
HEK293T cells were transfected with plasmids encoding SFB-tagged ZRANB3 wild type or mutants and HA-tagged RNR-α and cultured as described elsewhere. After 36 h, cells were harvested and washed twice with PBS, and once with 50 mM HEPES pH 7.6. Cells were resuspended in lysis buffer (50 mM HEPES pH 7.6, 100 mM NaCl, 1% Nonidet P-40, with Roche protease inhibitor tablets) and freeze thawed, and vortexed with glass beads three times. The lysate was spun down (15000×g, 10 min at 4 °C) and normalized to 4 mg/ml using the lysis buffer containing 0.5% Nonidet P-40. To this lysate was added 25 μl streptavidin resin pre-washed and equilibrated with the same lysis buffer. The suspension was incubated for 2 h at 4°C. The mixture was spun down (900×g, 5 min), supernatant was removed, and the resin was washed three times with 5 min incubation during each wash in 1 ml of 50 mM HEPES pH 7.6, 100 mM NaCl, 0.1% Nonidet P-40 (wash buffer) at rt. Proteins were eluted using 3 mg/ml biotin in wash buffer at 4 °C for 2 h.
Identification of RNR-α Interactor by Yeast Two-Hybrid Screening
Y2H screening was performed by Hybrigenics. (http://www.hybrigenics.com). The RNR-α bait was constructed as a Gal4 N-terminal fusion in pB43, a Y2H vector optimized by Hybrigenics. To generate an expression library, a randomly primed cDNA library from human HeLa cells (RP1) was constructed and inserted into the pP6 vector. Ninety-seven million interactions were analyzed in the screening. After selection on medium lacking histidine, 54 positive clones were chosen and sequenced. Sequences were compared with the latest release of the GeneBank database using BLAST.
Cell cycle analysis using flow cytometry
Cells were grown as described. At the desired time (typically 50% confluence) cells were harvested, pelleted by centrifugation (700×g) then resuspended in PBS (300 μl). To this was added dropwise with regular mixing, chilled EtOH (700 μl). Cells were maintained at 4 °C until required (they can be left for at least a month in the dark). Cells were pelleted and washed with 1% BSA in PBS two times. Cells were then incubated with 50 μg/ml propidium iodide (PI) (300 μl from a master 1X stock mix) at rt for 30 min with rotating in the dark. To this was then added RNase (30 μl 10 mg/ml) with continued shaking for 30 min. Samples were stored in the dark at 4 °C until required. Analysis was carried out using FlowJo (tree star) by finding the largest side (SSC-A) and forward (FSC-A) scatter group in DMSO-treated cell population (typically 70% of total samples in control) (See representative data below). This was then analyzed for PI staining (488–2 channel) height and width, or forward scatter width and area, to give single cells in the scatter population (typically >94% scatter group, irrespective of condition), as shown below. These two gates were applied to all samples within a single experiment, and each cell sample was analyzed further. Percentage G1/S/G2-M are shown for points within the single cell population. Representative data for histograms is given in Supplementary Fig. 13a and 30e, and Supplementary Figure 32-34.
Non-homologous end joining (NHEJ) reporter assay
NHEJ was measured according to the method developed by Gorunova and co-workers. Briefly, the NHEJ reporter plasmid contains a GFP sequence interrupted by the Pem1 intron that is itself interrupted by adenovirus exon 2. This plasmid does not code for a functional GFP due to the adenovirus exon (verified by us; data not shown), however, if the adenovirus exon is removed by I-SCE1 digestion (mimicking DSB formation), upon NHEJ this plasmid can form a functional Pem1 intron, and produce functional GFP. Cells undergoing NHEJ are read off as GFP positive, relative to a co-transfected DsRed plasmid used as a marker for all transfected cells. Cells at 50–70% confluence in 6-well plates were transfected with a plasmid mix containing linearized reporter plasmid (0.5 µg; ISCE-1 treated for 8 h, followed by gel extraction), pDsRed2-N1 (0.2 µg) and test plasmid (2.5 µg) (i.e., construct encoding RNR-α variant), using 7.5 µL TransIT-2020 (Mirus) for 36–40 h. After this time, cells were trypsinized, resuspended in 1% FBS in PBS and analyzed by flow cytometry. Compensation was applied based on GFP only or DsRed only expressing cells.
Measurement of deoxyribonucleotide levels
dNTP levels were measured according to Sherman and Fyfe method with modifications described in Bianchi et al. Briefly, HEK293T or HeLa cells, grown on 10 cm2 culture dish were harvested, washed once with PBS and extracted with ice-cold 60% methanol (0.8 ml/ 2 million cells). The methanolic extract was then heated for 5 min at 95 °C, centrifuged to remove insoluble fraction and vacuum dried overnight. The dry residue was re-dissolved in 50 μl water and used for the assays. The assay mixture in final concentrations contained 1X NEB buffer II, 0.25 μM template DNA, 0.25 μM primer DNA, 2 μM 3H- labeled dATP or dTTP (5000 cpm/pmol), 1 unit Bsu DNA polymerase and 5 μl of extract in a total volume of 100 μl. After 60 min incubation, the mixture was spotted on circular disks of Whatman DE81 paper. After drying, the filter paper disks were washed three times for 10 min in 5% Na2HPO4, once in water and once in ethanol. The retained radioactivity was determined by scintillation counting.
Recombinant protein purification
CodonPlus(DE3)-RIL competent cells (Stratagene) were transformed with pet28a–His6-RNR-α, pet28a-His6-HA-HNH&APIM or pet15b-His5-PCNA. Cells were then grown overnight on LB agar plates in the presence of 50 μg/mL kanamycin (for pet28a plasmids) or 100 μg/mL ampicillin (for pet15b plasmid). In a typical expression procedure, a 5-ml culture containing kanamycin or ampicillin with 50 μg/mL chloramphenicol was inoculated with a single colony and incubated overnight at 37 °C. The overnight culture was subsequently diluted into 6×1.2 L LB media. Cells were grown to OD600 of 0.6–0.8 at 37 °C and induced with 1 mM IPTG overnight at 19 °C. The cells were harvested by centrifugation (7,000 × g for 20 min), flash frozen in liquid N2, stored at −80 °C and used within two weeks for protein isolation.
For protein isolation, all steps were carried out at 4 °C. The cell pellet was suspended in the lysis buffer (5 vol/g) containing 50 mM NaH2PO4 (pH 7.0), 0.1% Triton X-100, 10 mM imidazole, 5 mM BME and 1 mM PMSF. For purification of His6-RNR-α, EDTA free Roche protease cocktail inhibitors were used instead of PMSF. The cells were lysed by two passages through a French pressure cell operating at 13,000 psi and cell debris was removed by centrifugation (20,000 × g, 10 min). DNA was precipitated by dropwise addition of streptomycin sulfate (2% wt/vol) with continuous stirring over 15 min, with an additional 15 min incubation. The precipitated DNA was removed by centrifugation (20,000 × g, 10 min) and supernatant was incubated for 1 h with TALON (for His6-RNR-α) or Ni-NTA (for His6-HA-HNH&APIM and pet15b-His5-PCNA) resin (1 mL bed vol/g cell pellet) that had been preequilibrated with lysis buffer. Subsequent to removal of flow-through, the column was washed under gravity with wash buffer containing 50 mM NaH2PO4 (pH 7.0), 0.1% Triton X-100, 50 mM imidazole, 5 mM BME and 800 mM NaCl until the A280 absorbance reached background level. The bound polyhistidine-tagged proteins were released from Ni-NTA resin with elution buffer containing 50 mM NaH2PO4 (pH 7.0), 250 mM imidazole, 1 mM BME and 300 mM NaCl. For TALON resin, the imidazole concentration in elution buffer was 125 mM. The fractions with eluted proteins were identified by A280 absorbance, pooled and concentrated using Amicon Ultra. Removal of imidazole and exchange into storage buffer [50 mM Tris-Cl (pH 7.6), 100 mM KCl, 15 mM MgCl2, 5 mM DTT, and 5% glycerol] was carried out using Sephadex G25 chromatography (GE healthcare).
In vitro pulldown assay
All recombinant proteins were buffer exchanged into binding buffer (50 mM Hepes, 100 mM NaCl and 0.5 mM TCEP) using EconoPac 10DG desalting column. During all incubation steps, the samples were subjected to end-over-end rotation at rt. Prior to pulldown, the anti-HA affinity resin was incubated with binding buffer containing 1% BSA over 30 min to block non-specific sites. After blocking, the resin was incubated with 5 μM His6-HA-HNH&APIM over 30 min. Subsequent to centrifugation and removal of the supernatant, the resin was washed twice with the binding buffer and further incubated with 5 μM His6-RNR-α in buffer containing 1% BSA for 1 h. For competition assay, 20 μM of recombinant His5-PCNA was supplemented into the buffer. After incubation, the resin was spun down and washed as above. Bound proteins were eluted by heating the resin in 2X laemmli buffer, resolved by SDS-PAGE, and stained with Coomassie blue.
Phos-tag gel
HeLa cells were treated with ClF (5 μM, 3 h). The cells were fractionated and cytosolic and nuclear fractions were resolved on a 10% Phos-tag gel. For alkaline phosphatase-treated samples, the lysate was diluted to 2 mg/ml with 1X NEB cutsmart buffer in a total volume of 20 μl and incubated with 5 units of alkaline phosphatase (AB) for 30 min at rt before loading onto the gels. Gel recipe for separating layer: 1.7 ml 30% acrylamide-bisacrylamide 37.5:1; 1.25 ml Tris/HCl pH=8.8 (final concentration 375 mM); 50 μl 5 mM Phos-tag solution (final concentration 0.05 mM); 50 μl MnCl2 (final concentration 0.1 mM); 50 μl 10% SDS (final concentration 0.1%); 1.88 mL H2O; 5 μl TEMEDA; 25 μl 10% APS. For western blot, the gel was incubated in 10 mM EDTA (pH=7.0) for 10 min before soaking in transfer buffer.
Co-immunoprecipitation of endogenous proteins with crosslinkers
HEK293T cells were grown to 30% confluence in 10 cm plates then transfected with siRNAs (either SiCont or siZRANB3) for 2 days. After this time cells were approximately 80 % confluent and were treated with either ClF (5 μM) or DMSO for 3 h. After this time media were replaced with serum free media containing EGS (1 mM; DSS was used at the same concentration) with or without ClF (5 μM). After 1 h, cells were harvested by trypsinization, collected and washed 3 times in 200 mM Tris (pH 7.5). Cell pellets were resuspended in lysis buffer [200 mM Tris (pH 7.5), 150 mM NaCl, 1% triton, with 2X protease inhibitors] then lysed by vortexing with glass beads/freeze thawing three times. Lysates were clarified by centrifugation at 18000× rpm for 10 min at 4 °C. Then 500 μg lysate in 500 μl volume was precleared with 75 μl non-conjugated protein G agarose beads at rt for 2 h. The day before lysis, protein G resin was bound to anti-RNR-α (rabbit) in (50 mM Tris pH 7.6, 150 mM NaCl, 0.2% BSA, 1% Triton) overnight at 4oC. The resulting beads were rinsed 3 times in lysis buffer just prior to pulldown. The washed anti-RNR-α protein G agarose resin (75 μl) was then added to the precleared lysate (500 μl) and incubated at 4 °C overnight. Resulting beads were washed 3 times in lysis buffer at rt for 10 min, then bound complexes were eluted by heating in Laemmlli buffer. Samples were analyzed by western blot.
Supplementary Material
ACKNOWLEDGMENTS
Individual labs who generously provided plasmids and shRNAs as indicated in on-line methods. Dr. Jenn Page for contributing to the creation of RNR-α(D57N) knock-in mice. Research: Pershing Square Sohn Cancer Research Alliance grant (to Y.A.); Meyer Cancer Center grant (Weill Cornell Medicine) (to Y.A. & R.S.W.); and the Canadian Institutes of Health Research grant (MOP-82930) (to J.O.). Instrumentation and shared supplies: NIH DP2 New Innovator (1DP2GM114850); NSF CAREER (CHE-1351400); Office of Naval Research (ONR) Young Investigator (N00014-17-1-2529); Beckman Young Investigator; Sloan Fellowship (FG-2016-6379) (to Y.A.).
Footnotes
SUPPLEMENTARY INFORMATION. Supplementary information includes Supplementary Experimental Procedures, 42 supplementary figures, 2 supplementary tables and supplementary notes.
COMPETING FINANCIAL INTERESTS
The authors declare no competing financial interests.
DATA AVAILABILITY STATEMENT
Not applicable
REFERENCES
- 1.O’Donnell M, Langston L & Stillman B Principles and concepts of DNA replication in bacteria, archaea, and eukarya. Cold Spring Harb. Perspect. Biol 5(2013). [DOI] [PMC free article] [PubMed] [Google Scholar]
- 2.Nordlund P & Reichard P Ribonucleotide reductases. Annu. Rev. Biochem 75, 681–706 (2006). [DOI] [PubMed] [Google Scholar]
- 3.Aye Y, Li M, Long MJ & Weiss RS Ribonucleotide reductase and cancer: Biological mechanisms and targeted therapies. Oncogene 34, 2011–21 (2015). [DOI] [PubMed] [Google Scholar]
- 4.Aye Y & Stubbe J Clofarabine 5’-di and -triphosphates inhibit human ribonucleotide reductase by altering the quaternary structure of its large subunit. Proc Natl Acad Sci USA 108, 9815–20 (2011). [DOI] [PMC free article] [PubMed] [Google Scholar]
- 5.Fairman JW et al. Structural basis for allosteric regulation of human ribonucleotide reductase by nucleotide-induced oligomerization. Nat. Struct. Mol. Biol 18, 316–22 (2011). [DOI] [PMC free article] [PubMed] [Google Scholar]
- 6.Cooperman BS & Kashlan OB A comprehensive model for the allosteric regulation of class ia ribonucleotide reductases. Adv. Enzyme Regul 43, 167–182 (2003). [DOI] [PubMed] [Google Scholar]
- 7.Hofer A, Crona M, Logan DT & Sjoberg BM DNA building blocks: Keeping control of manufacture. Crit. Rev. Biochem. Mol. Biol 47, 50–63 (2012). [DOI] [PMC free article] [PubMed] [Google Scholar]
- 8.Aye Y et al. Clofarabine targets the large subunit α of human ribonucleotide reductase in live cells by assembly into persistent hexamers. Chem. Biol 19, 799–805 (2012). [DOI] [PMC free article] [PubMed] [Google Scholar]
- 9.Fu Y, Lin HY, Wisitpitthaya S, Blessing WA & Aye Y A fluorimetric readout reporting the kinetics of nucleotide-induced human ribonucleotide reductase oligomerization. Chembiochem 15, 2598–604 (2014). [DOI] [PMC free article] [PubMed] [Google Scholar]
- 10.Wisitpitthaya S et al. Cladribine and fludarabine nucleotides induce distinct hexamers defining a common mode of reversible rnr inhibition. ACS Chem. Biol 11, 2021–32 (2016). [DOI] [PMC free article] [PubMed] [Google Scholar]
- 11.Ando N et al. Allosteric inhibition of human ribonucleotide reductase by datp entails the stabilization of a hexamer. Biochemistry 55, 373–81 (2016). [DOI] [PMC free article] [PubMed] [Google Scholar]
- 12.Brignole EJ et al. 3.3-å resolution cryo-em structure of human ribonucleotide reductase with substrate and allosteric regulators bound. e- Life 7, e31502 (2018). [DOI] [PMC free article] [PubMed] [Google Scholar]
- 13.Rofougaran R, Vodnala M & Hofer A Enzymatically active mammalian ribonucleotide reductase exists primarily as an alpha6beta2 octamer. J. Biol. Chem 281, 27705–11 (2006). [DOI] [PubMed] [Google Scholar]
- 14.Engström Y & Rozell B Immunocytochemical evidence for the cytoplasmic localization and differential expression during the cell cycle of the m1 and m2 subunits of mammalian ribonucleotide reductase. EMBO J 7, 1615–20 (1988). [DOI] [PMC free article] [PubMed] [Google Scholar]
- 15.Pontarin G et al. Ribonucleotide reduction is a cytosolic process in mammalian cells independently of DNA damage. Proc. Natl. Acad. Sci. U. S. A 105, 17801–6 (2008). [DOI] [PMC free article] [PubMed] [Google Scholar]
- 16.Fong KM, Zimmerman PV & Smith PJ Correlation of loss of heterozygosity at 11p with tumour progression and survival in non-small cell lung cancer. Genes Chromosomes Cancer 10, 183–9 (1994). [DOI] [PubMed] [Google Scholar]
- 17.Wang Q et al. Ribonucleotide reductase large subunit m1 predicts poor survival due to modulation of proliferative and invasive ability of gastric cancer. PLoS One 8, e70191 (2013). [DOI] [PMC free article] [PubMed] [Google Scholar]
- 18.Lee JJ et al. The immunohistochemical overexpression of ribonucleotide reductase regulatory subunit m1 (rrm1) protein is a predictor of shorter survival to gemcitabine-based chemotherapy in advanced non-small cell lung cancer (nsclc). Lung Cancer 70, 205–10 (2010). [DOI] [PubMed] [Google Scholar]
- 19.Mathews CK Deoxyribonucleotide metabolism, mutagenesis and cancer. Nat. Rev. Cancer 15, 528–39 (2015). [DOI] [PubMed] [Google Scholar]
- 20.Ali IU, Lidereau R, Theillet C & Callahan R Reduction to homozygosity of genes on chromosome 11 in human breast neoplasia. Science 238, 185–8 (1987). [DOI] [PubMed] [Google Scholar]
- 21.Cao MY et al. Adenovirus-mediated ribonucleotide reductase r1 gene therapy of human colon adenocarcinoma. Clin. Cancer Res 9, 4553–61 (2003). [PubMed] [Google Scholar]
- 22.Fan H, Huang A, Villegas C & Wright JA The r1 component of mammalian ribonucleotide reductase has malignancy-suppressing activity as demonstrated by gene transfer experiments. Proc Natl Acad Sci USA 94, 13181–6 (1997). [DOI] [PMC free article] [PubMed] [Google Scholar]
- 23.Bepler G et al. Rrm1 and pten as prognostic parameters for overall and disease-free survival in patients with non-small-cell lung cancer. J. Clin. Oncol 22, 1878–85 (2004). [DOI] [PubMed] [Google Scholar]
- 24.Gautam A & Bepler G Suppression of lung tumor formation by the regulatory subunit of ribonucleotide reductase. Cancer Res 66, 6497–502 (2006). [DOI] [PubMed] [Google Scholar]
- 25.Gautam A, Li ZR & Bepler G Rrm1-induced metastasis suppression through pten-regulated pathways. Oncogene 22, 2135–42 (2003). [DOI] [PubMed] [Google Scholar]
- 26.Pitterle DM et al. Lung cancer and the human gene for ribonucleotide reductase subunit m1 (rrm1). Mamm. Genome 10, 916–22 (1999). [DOI] [PubMed] [Google Scholar]
- 27.Zheng Z et al. DNA synthesis and repair genes rrm1 and ercc1 in lung cancer. N. Engl. J. Med 356, 800–8 (2007). [DOI] [PubMed] [Google Scholar]
- 28.Qi H et al. Non-enzymatic action of rrm1 protein upregulates pten leading to inhibition of colorectal cancer metastasis. Tumor biology 36, 4833–42 (2015). [DOI] [PubMed] [Google Scholar]
- 29.Davoli T et al. Cumulative haploinsufficiency and triplosensitivity drive aneuploidy patterns and shape the cancer genome. Cell 155, 948–62 (2013). [DOI] [PMC free article] [PubMed] [Google Scholar]
- 30.Ciccia A et al. Polyubiquitinated pcna recruits the zranb3 translocase to maintain genomic integrity after replication stress. Mol. Cell 47, 396–409 (2012). [DOI] [PMC free article] [PubMed] [Google Scholar]
- 31.Weston R, Peeters H & Ahel D Zranb3 is a structure-specific atp-dependent endonuclease involved in replication stress response. Genes Dev 26, 1558–72 (2012). [DOI] [PMC free article] [PubMed] [Google Scholar]
- 32.Yuan J, Ghosal G & Chen J The harp-like domain-containing protein ah2/zranb3 binds to pcna and participates in cellular response to replication stress. Mol. Cell 47, 410–21 (2012). [DOI] [PMC free article] [PubMed] [Google Scholar]
- 33.Stubbe J & van Der Donk WA Protein radicals in enzyme catalysis. Chem. Rev 98, 705–762 (1998). [DOI] [PubMed] [Google Scholar]
- 34.Andersen PL, Xu F & Xiao W Eukaryotic DNA damage tolerance and translesion synthesis through covalent modifications of pcna. Cell Res 18, 162–73 (2008). [DOI] [PubMed] [Google Scholar]
- 35.Sirbu BM, Couch FB & Cortez D Monitoring the spatiotemporal dynamics of proteins at replication forks and in assembled chromatin using isolation of proteins on nascent DNA. Nat. Protoc 7, 594–605 (2012). [DOI] [PMC free article] [PubMed] [Google Scholar]
- 36.Gratzner H Monoclonal antibody to 5-bromo- and 5-iododeoxyuridine: A new reagent for detection of DNA replication. Science 218, 474–475 (1982). [DOI] [PubMed] [Google Scholar]
- 37.Gilljam KM et al. Identification of a novel, widespread, and functionally important pcna-binding motif. J. Cell Biol 186, 645–654 (2009). [DOI] [PMC free article] [PubMed] [Google Scholar]
- 38.Su Lim C et al. Measurement of the nucleus area and nucleus/cytoplasm and mitochondria/nucleus ratios in human colon tissues by dual-colour two-photon microscopy imaging. Sci. Rep 5, 18521 (2015). [DOI] [PMC free article] [PubMed] [Google Scholar]
- 39.Specks J, Lecona E, Lopez-Contreras AJ & Fernandez-Capetillo O A single conserved residue mediates binding of the ribonucleotide reductase catalytic subunit rrm1 to rrm2 and is essential for mouse development. Mol. Cell. Biol 35, 2910–7 (2015). [DOI] [PMC free article] [PubMed] [Google Scholar]
- 40.Aye Y, Long MJ & Stubbe J Mechanistic studies of semicarbazone triapine targeting human ribonucleotide reductase in vitro and in mammalian cells: Tyrosyl radical quenching not involving reactive oxygen species. J. Biol. Chem 287, 35768–78 (2012). [DOI] [PMC free article] [PubMed] [Google Scholar]
- 41.Ewald B, Sampath D & Plunkett W Nucleoside analogs: Molecular mechanisms signaling cell death. Oncogene 27, 6522–37 (2008). [DOI] [PubMed] [Google Scholar]
- 42.Niida H et al. Essential role of tip60-dependent recruitment of ribonucleotide reductase at DNA damage sites in DNA repair during g1 phase. Genes Dev 24, 333–8 (2010). [DOI] [PMC free article] [PubMed] [Google Scholar]
- 43.Tsao N, Yang YC, Deng YJ & Chang ZF The direct interaction of nme3 with tip60 in DNA repair. Biochem. J 473, 1237–45 (2016). [DOI] [PubMed] [Google Scholar]
- 44.Bianchi V, Pontis E & Reichard P Dynamics of the datp pool in cultured mammalian cells. Exp. Cell Res 199, 120–8 (1992). [DOI] [PubMed] [Google Scholar]
- 45.Arnaoutov A & Dasso M Irbit is a novel regulator of ribonucleotide reductase in higher eukaryotes. Science 345, 1512–5 (2014). [DOI] [PMC free article] [PubMed] [Google Scholar]
- 46.Vujanovic M et al. Replication fork slowing and reversal upon DNA damage require pcna polyubiquitination and zranb3 DNA translocase activity. Mol. Cell 67, 882–890 e5 (2017). [DOI] [PMC free article] [PubMed] [Google Scholar]
- 47.Fu Y et al. Uncoupling of allosteric and oligomeric regulation in a functional hybrid enzyme constructed from escherichia coli and human ribonucleotide reductase. Biochemistry 52, 7050–9 (2013). [DOI] [PMC free article] [PubMed] [Google Scholar]
- 48.Kumar D, Viberg J, Nilsson AK & Chabes A Highly mutagenic and severely imbalanced dntp pools can escape detection by the s-phase checkpoint. Nucleic Acids Res 38, 3975–83 (2010). [DOI] [PMC free article] [PubMed] [Google Scholar]
- 49.Pai CC & Kearsey SE A critical balance: Dntps and the maintenance of genome stability. Genes (Basel) 8(2017). [DOI] [PMC free article] [PubMed] [Google Scholar]
- 50.Anglana M, Apiou F, Bensimon A & Debatisse M Dynamics of DNA replication in mammalian somatic cells: Nucleotide pool modulates origin choice and interorigin spacing. Cell 114, 385–394 (2003). [DOI] [PubMed] [Google Scholar]
References for the Online Methods:
- 51.Kocsis E, Cerritelli ME, Trus BL, Cheng N & Steven AC Improved methods for determination of rotational symmetries in macromolecules. Ultramicroscopy 60, 219–28 (1995). [DOI] [PubMed] [Google Scholar]
- 52.Marabini R et al. Xmipp: An image processing package for electron microscopy. J. Struct. Biol 116, 237–40 (1996). [DOI] [PubMed] [Google Scholar]
- 53.Scheres SH et al. Maximum-likelihood multi-reference refinement for electron microscopy images. J. Mol. Biol 348, 139–49 (2005). [DOI] [PubMed] [Google Scholar]
- 54.Sorzano CO et al. Xmipp: A new generation of an open-source image processing package for electron microscopy. J. Struct. Biol 148, 194–204 (2004). [DOI] [PubMed] [Google Scholar]
- 55.Jackson DA & Pombo A Replicon clusters are stable units of chromosome structure: Evidence that nuclear organization contributes to the efficient activation and propagation of s phase in human cells. J. Cell Biol 140, 1285–95 (1998). [DOI] [PMC free article] [PubMed] [Google Scholar]
Associated Data
This section collects any data citations, data availability statements, or supplementary materials included in this article.