. 2018 Sep 6;7:e38795. doi: 10.7554/eLife.38795

Figure 4. HA variants were depleted at increased temperature but enriched upon XBP1s or ATF6f/XBP1s induction.

Cropped sequence logo plots show differential selection on HA at positions where variants were depleted upon increased temperature but enriched upon XBP1s and ATF6f/XBP1s induction (based on sequential numbering of WSN HA). Size of amino acid abbreviation corresponds to magnitude of selection. Only variants behaving consistently across biological triplicates are plotted; all selections are plotted on the same scale. Figure 4—figure supplement 1. Full WSN HA sequence logo plot: Basal 39˚C vs. Basal 37˚C. Figure 4—figure supplement 2. Full WSN HA sequence logo plot: XBP1s 37˚C vs. Basal 37˚C. Figure 4—figure supplement 3. Full WSN HA sequence logo plot: XBP1s 39˚C vs. Basal 39˚C. Figure 4—figure supplement 4. Full WSN HA sequence logo plot: ATF6f/XBP1s 37˚C vs. Basal 37˚C. Figure 4—figure supplement 5. Full WSN HA sequence logo plot: ATF6f/XBP1s 39˚C vs. Basal 39˚C. Source data 1. Complete analysis of deep mutational scanning data.

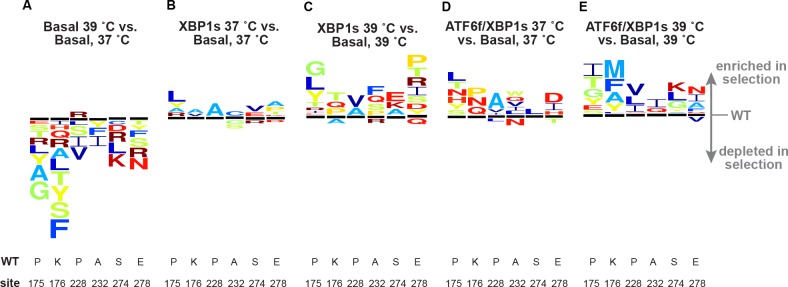
Figure 4.

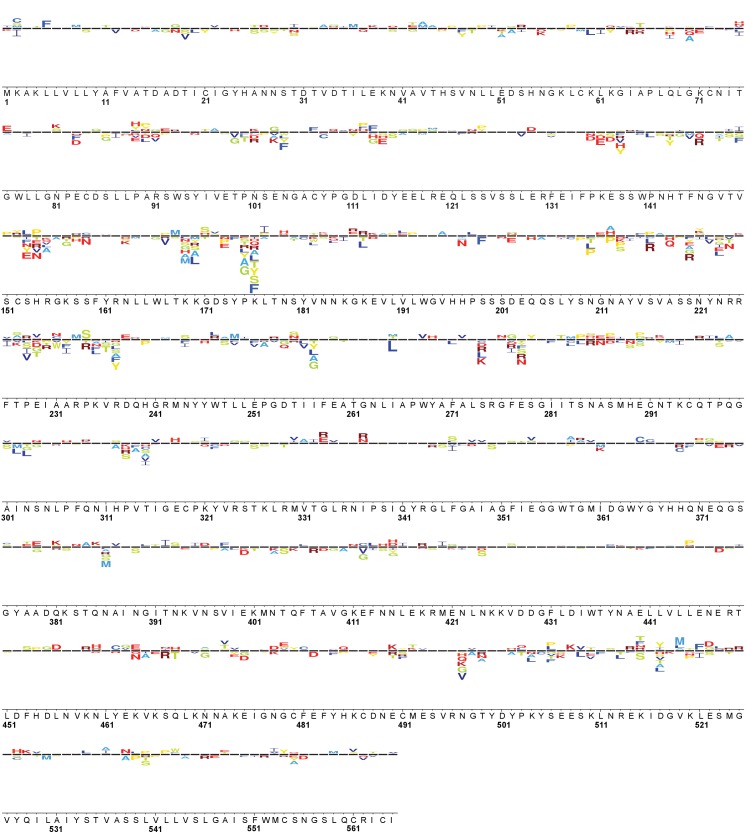
Figure 4—figure supplement 1. Full WSN HA sequence logo plot: Basal 39˚C vs. Basal 37˚C.

Figure 4—figure supplement 1.

Logo plot displays variants that behaved consistently across three biological replicates. Variants above the line (representative of selection on wild-type) were enriched at 39˚C relative to 37˚C in a basal environment; variants below the line were depleted at 39˚C. The wild-type WSN HA residue is shown below the corresponding logo, with the sites numbered below the wild-type sequence (based on sequential numbering of WSN HA). The size of the amino acid letter abbreviation is proportional to the diffsel for that amino acid variant, and all logo plots are plotted on the same scale.
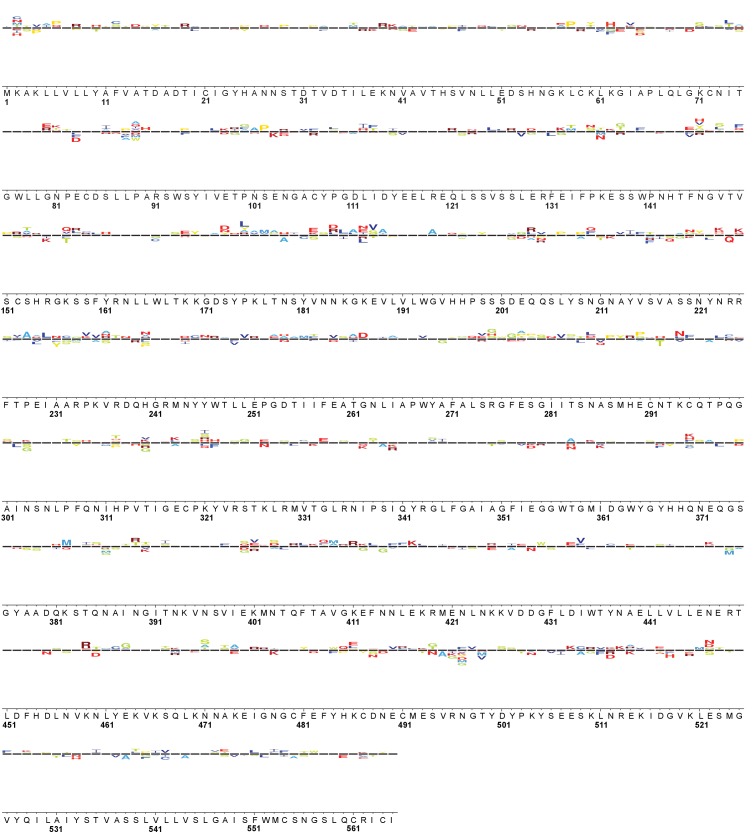
Figure 4—figure supplement 2. Full WSN HA sequence logo plot: XBP1s 37˚C vs. Basal 37˚C.

Figure 4—figure supplement 2.

Logo plot displays variants that behaved consistently across three biological replicates. Variants above the line (representative of selection on wild-type) were enriched upon XBP1s induction at 37˚C; variants below the line were depleted. The wild-type WSN HA residue is shown below the corresponding logo, with the sites numbered below the wild-type sequence (based on sequential numbering of WSN HA). The size of the amino acid letter abbreviation is proportional to the diffsel for that amino acid variant, and all logo plots are plotted on the same scale.
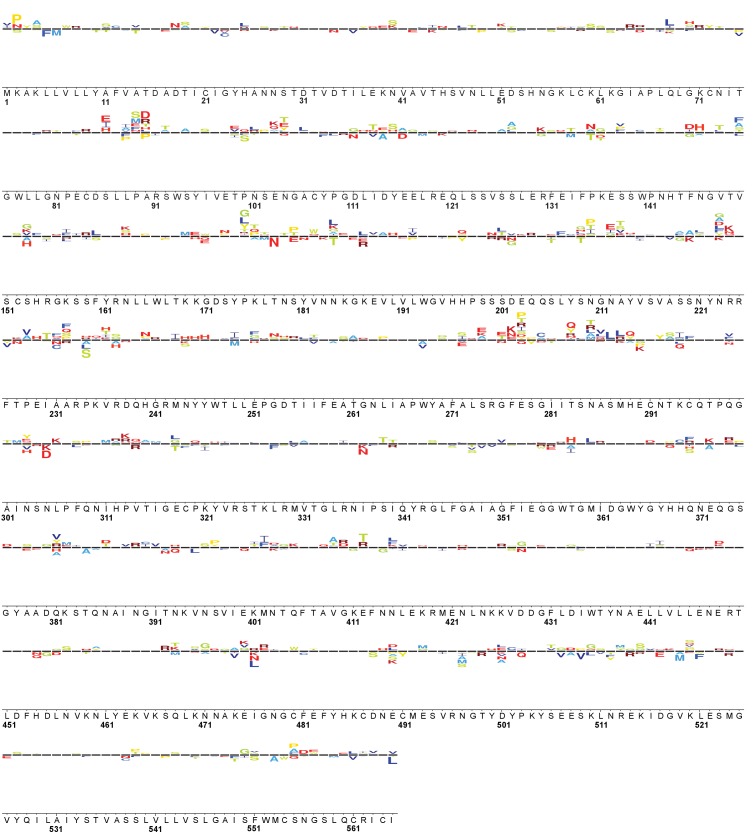
Figure 4—figure supplement 3. Full WSN HA sequence logo plot: XBP1s 39˚C vs. Basal 39˚C.

Figure 4—figure supplement 3.

Logo plot displays variants that behaved consistently across three biological replicates. Variants above the line (representative of selection on wild-type) were enriched upon XBP1s induction at 39˚C; variants below the line were depleted. The wild-type WSN HA residue is shown below the corresponding logo, with the sites numbered below the wild-type sequence (based on sequential numbering of WSN HA). The size of the amino acid letter abbreviation is proportional to the diffsel for that amino acid variant, and all logo plots are plotted on the same scale.
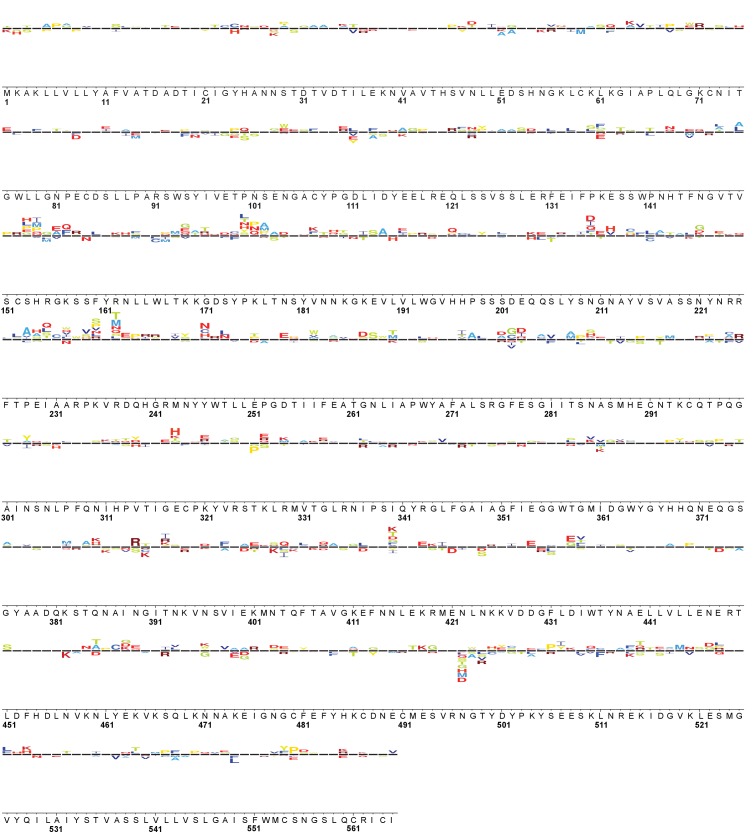
Figure 4—figure supplement 4. Full WSN HA sequence logo plot: ATF6f/XBP1s 37˚C vs. Basal 37˚C.

Figure 4—figure supplement 4.

Logo plot displays variants that behaved consistently across three biological replicates. Variants above the line (representative of selection on wild-type) were enriched upon ATF6f/XBP1s induction at 37˚C; variants below the line were depleted. The wild-type WSN HA residue is shown below the corresponding logo, with the sites numbered below the wild-type sequence (based on sequential numbering of WSN HA). The size of the amino acid letter abbreviation is proportional to the diffsel for that amino acid variant, and all logo plots are plotted on the same scale.
Figure 4—figure supplement 5. Full WSN HA sequence logo plot: ATF6f/XBP1s 39˚C vs. Basal 39˚C.

Figure 4—figure supplement 5.

Logo plot displays variants that behaved consistently across three biological replicates. Variants above the line (representative of selection on wild-type) were enriched upon ATF6f/XBP1s induction at 39˚C; variants below the line were depleted. The wild-type WSN HA residue is shown below the corresponding logo, with the sites numbered below the wild-type sequence (based on sequential numbering of WSN HA). The size of the amino acid letter abbreviation is proportional to the diffsel for that amino acid variant, and all logo plots are plotted on the same scale.