. 2018 Sep 6;7:e38795. doi: 10.7554/eLife.38795

Figure 6. Divergent fitness effects revealed by DMS assessed by pairwise competitions.

(A) Scheme for pairwise competition between wild-type HA and mutant HA influenza. Detailed description of competition conditions in Figure 6—figure supplement 1. (B) The difference between the average diffsel upon increased temperature (ΔT) and the average diffsel upon induction of XBP1s or ATF6f/XBP1s (ΔUPR) is plotted. This difference from the pairwise competitions is plotted on the y-axis, with error bars representing SEM for biological triplicates, and the corresponding difference from the DMS is plotted on the x-axis. Variants that validated (i.e., diffsel upon increased temperature was significantly different from that upon UPR induction in both DMS and pairwise competitions) are in black; variants that did not validate are in red; synonymous (neutral) validated negative controls are in gray. All non-synonymous variants are labeled. Figure 6—figure supplement 1. Individual pairwise competition diffsel values.

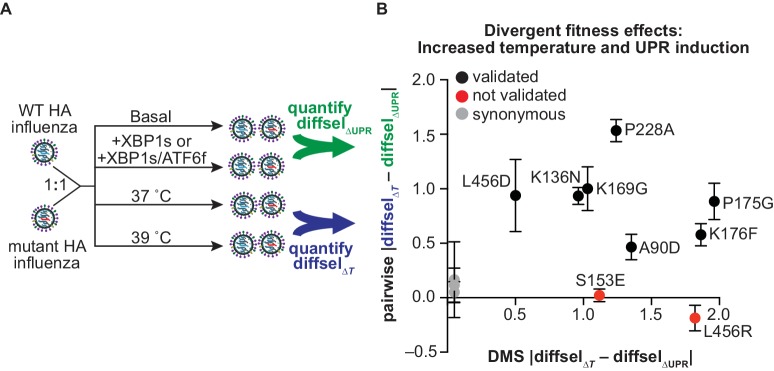
Figure 6.

Figure 6—figure supplement 1. Individual pairwise competition diffsel values.
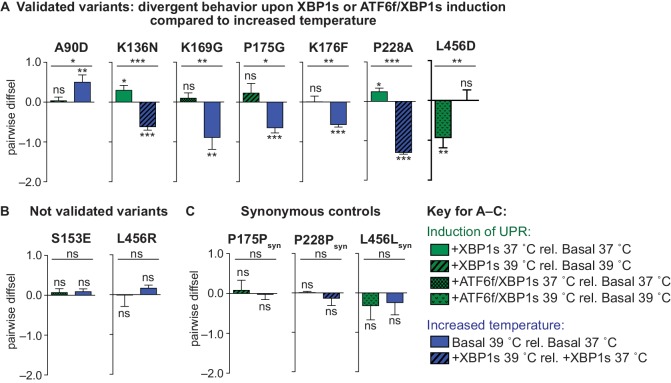
Figure 6—figure supplement 1.

(A) Diffsel of validated variants in pairwise competition with wild-type influenza upon induction of XBP1s or ATF6f/XBP1s and increased temperature. Variants were considered ‘validated’ if the diffsel upon induction of XBP1s or ATF6f/XBP1s was significantly different from that upon increased temperature. (B) Diffsel of non-validated variants in pairwise competition. (C) Diffsel of synonymous mutants in pairwise competition. For (A–C), the average of biological triplicates is plotted with error bars corresponding to SEM. Asterisks comparing selection conditions represent significance evaluated by Student’s t-test, while asterisks comparing an individual selection condition to no selection (diffsel of zero) represent significance evaluated by a one-sample t-test. For all significance tests, *, **, and *** represent two-tailed p-values≤0.05, 0.01, and 0.001, respectively; ‘ns’ corresponds to a p-value>0.05. Induction of UPR conditions in green corresponds to ΔUPR in Figure 6; increased temperature conditions in blue correspond to ΔT in Figure 6.