

Abstract
Silver nanoparticles (AgNPs) are among the most extensively used nanoparticles and are found in a variety of products. This ubiquity leads to inevitable exposure to these particles in everyday life. However, the effects of AgNPs on neuron and astrocyte networks are still largely unknown. In this study, we used neurons and astrocytes derived from human embryonic stem cells as a cellular model to study the neurotoxicity that is induced by citrate-coated AgNPs (AgSCs). Immunostaining with the astrocyte and neuron markers, glial fibrillary acidic protein and microtubule-associated protein 2 (MAP2), respectively, showed that exposure to AgSCs at the concentration of 0.1 µg/mL increased the astrocyte/neuron ratio. In contrast, a higher concentration of AgSCs (5.0 µg/ml) significantly changed the morphology of astrocytes. These results suggest that astrocytes are sensitive to AgSC exposure and that low concentrations of AgSCs promote astrogenesis. Furthermore, our results showed that AgSCs reduced neurite outgrowth, decreased the expression of postsynaptic density protein 95 and synaptophysin, and induced neurodegeneration in a concentration-dependent manner. Our findings additionally suggest that the expression and phosphorylation status of MAP2 isoforms, as modulated by the activation of the Akt/glycogen synthase kinase-3/caspase-3 signaling pathway, may play an important role in AgSC-mediated neurotoxicity. We also found that AgNO3 exposure only slightly reduced neurite outgrowth and had little effect on MAP2 expression, suggesting that AgSCs and AgNO3 have different neuronal toxicity mechanisms. In addition, most of these effects were reduced when the cell culture was co-treated with AgSCs and the antioxidant ascorbic acid, which implies that oxidative stress is the major cause of AgSC-mediated astrocytic/neuronal toxicity and that antioxidants may have a neuroprotective effect.
Keywords: Citrate-coated silver nanoparticles, neurons and astrocytes, human embryonic stem cells, neurotoxicity, nanotoxicity
INTRODUCTION
Silver nanoparticles (AgNPs) are one of the most common nanoparticles (NPs) used in consumer products (http://www.nanotechproject.org/inventories/consumer/analysis_draft/). They function as antibacterial and antifungal agents in the health industry, as well as in food storage, medical devices, and textiles, among others. They also have numerous environmental applications (Wei et al., 2015), and are found in many household items including soaps, toothpastes, wet wipes, deodorants, lip products, and face and body foams (Gajbhiye and Sakharwade, 2016). Consequently, frequent and long-term exposure of humans to AgNPs is expected. Upon systemic distribution, AgNPs may not only cause adverse effects in the directly exposed primary organs but also in secondary organs, such as the liver, spleen, kidney, or brain (Haase et al., 2012). Besides direct transfer from the bloodstream to the brain, NPs deposited in the nasal region can also enter the brain through translocation along the olfactory nerve (Ji et al., 2007). Additionally, AgNPs exhibit a longer half-life in the brain than they do in other organs. Given this tendency of AgNPs to reside in the brain for an extended period of time, these particles and the related dissolved ions pose considerable neurotoxic hazards (Panyala et al., 2008, Zhang et al., 2016).
It has been reported that AgNPs exert various neurotoxic effects. For instance, Haase et al. (Haase et al., 2012) found that AgNPs induce an acute intracellular calcium rise followed by a strong oxidative stress response in mixed primary neuronal cell cultures obtained from the mouse frontal cortex. Recently, Xu et al. (Xu et al., 2013) reported that AgNPs induce toxicity and neuronal cell death in primary rat cortical cell cultures by modulating cytoskeleton components, perturbations of pre- and postsynaptic proteins, and mitochondrial dysfunction. Dayem et al. (Dayem et al., 2014) found that AgNPs enhance the activation of kinases, such as protein kinase B and extracellular signal-regulated protein kinases 1 and 2, and modulate the expression levels of dual-specificity phosphatase genes. The most frequently reported effects of AgNPs involve the generation of reactive oxygen species (ROS) and inflammation (Dziendzikowska et al., 2012, Haase et al., 2012, Arora et al., 2008, Carlson et al., 2008). For neural cells, oxidative stress is a particular risk because it is involved in the pathogenesis of many neurodegenerative diseases, such as Alzheimer’s disease, Parkinson’s disease, or Huntington’s disease (Coyle and Puttfarcken, 1993, Lin and Beal, 2006, Simonian and Coyle, 1996).
Many published studies used primary animal cell cultures or neuronal-like cell lines that were derived from neuronal tumors; however, such cultures likely do not reflect the normal properties of human cells (Gordon et al., 2013). In this study, we applied our recently developed neuron and astrocyte differentiation protocol to produce a diverse neuron and astrocyte network from human embryonic stem cells (hESCs) (Begum et al., 2015). This type of network generated from both neurons and astrocytes is a more realistic test system than neuronal-like cell lines that are derived from neuronal tumors. Indeed, astrocytes play a role in the maintenance of neuronal cell homeostasis and are associated with both neuroprotection and neurodegradation in response to toxic substances or disease states (Rodrigue-Arellano et al., 2016). Hence, in the work presented here, we evaluated the astrocyte/neuron ratio, astrocytic morphology, neurite outgrowth, key protein (e.g., microtubule-associated protein 2 [MAP2]) expression, and signal pathways activated in response to citrate-coated AgNP (AgSC) exposure. MAP2 is a central substrate for many neuronal signal transduction pathways that are essential for proper neuronal function. The expression and phosphorylation state of MAP2 were demonstrated to be precisely regulated during brain development, which is consistent with the proposed role of MAP2 in neurite outgrowth, synaptic plasticity, and neuronal cell death (Sanchez, et al., 2000). Thus, in our study, we specifically studied the expression and functions of MAP2, as regulated by phosphorylation/dephosphorylation processes, in response to AgSC exposure.
Our recently published study showed that when glutamatergic neurons derived from hESCs were exposed to AgSCs, ROS and nitric oxide synthase production increased (Begum et al., 2016). Several studies have shown that glial cells exert neuroprotective effects against pro-oxidant agents (Bélanger and Magistretti, 2009). The neuroprotective capacity of astrocytes, the most abundant class of neuroglia, is due to significantly higher levels of a variety of antioxidant molecules (e.g., glutathione, ascorbate, and vitamin E) and ROS-detoxifying enzymes (e.g., glutathione S-transferase, glutathione peroxidase, and catalase), as well as to the recycling of ascorbate. Ascorbic acid (AA), a key antioxidant in the central nervous system, is stored in glial reservoirs and released into the synaptic cleft, where it is taken up by neurons. In addition, AA scavenges ROS generated during synaptic activity and neuronal metabolism (Covarrubias-Pinto et al., 2015, Zhang et al., 2016). However, AA also has many other roles beyond acting as an antioxidant scavenger. In fact, it is a key molecule of the central nervous system with many different functions (Covarrubias-Pinto et al., 2015).
The aim of the present study was to use hESCs as a cellular model to investigate the effects of AgSCs on a network made up of neurons and astrocytes. We also co-administered AA and AgSCs to cells in order to test our hypothesis that AA would ameliorate the AgSC-induced neurotoxicity owing to its antioxidative and neuroprotective effects. In addition, as there is a general consensus in the nanotoxicological field that the main mechanism underlying AgNP toxicity is the release of Ag+ (Romih et al., 2016), we compared the effects of AgSCs with the effects of free Ag+ ions (AgNO3).
METHODS
Maintenance of the H9 cell line and generation of the human neuron and astrocyte network from hESCs
Human embryonic stem cells (H9 line, National Stem Cell Bank code WA09, Wicell) were cultured in mTeSR™−1 medium (Stemcell Technologies) in a humidified atmosphere of 5% CO2/95% air at 37°C. Cells were routinely subcultured once a week by cutting the undifferentiated colonies with a pipette tip and transferring the fragments to dishes covered with Matrigel and containing fresh mTeSR™−1 medium. The medium was changed every second day until confluence.
Human glutamatergic neurons and astrocytes were generated as previously described (Begum et al., 2015). Briefly, hESCs were treated with collagenase IV (2 mg/mL, Life Technologies), harvested, plated onto low adhesion suspension culture plates (Olympus plastic) in KnockOut™ Serum Replacement medium (KRSM) and incubated in 10% CO2 for 5 days for neurosphere formation. The KRSM is supplemented with basic fibroblast growth factor (10 ng/mL), epidermal growth factor (0.5 ng/mL), and heparin (1 µg/mL). Neurospheres were incubated in 5% CO2 for 7 days, and the KSRM medium was gradually replaced with neuronal maintenance medium (NMM) by changing the medium every other day. Neurospheres were collected, treated with Gentle Cell Dissociation Reagent (Stem Cell Technologies, catalog # 07174) to break them down into smaller fragments, and then transferred to Matrigel-coated plates containing NMM. After 6 days, cells were plated on Matrigel-coated plates. Cells were maintained in NMM until neurons and astrocytes appeared in the culture (2–3 weeks).
Characterization of NPs
The 20-nm colloidal AgSCs were a generous gift from the National Institute of Environment and Health Sciences (NIEHS, USA). The materials were characterized by the Nanotechnology Characterization Laboratory (NCL, Supplementary Table 1). The average primary particle size and the size distribution were determined using high-resolution transmission electron microscopy (TEM). The silver concentration was determined by inductively coupled plasma mass spectrometry (ICP-MS). The physical and chemical characterization data of these NPs can be found in the booklet provided by NIEHS (NCL-NIEHS201305A). We also further characterized the particle suspensions using TEM, dynamic light scattering (DLS), and zeta-potential measurements in our culture medium. The samples for TEM analysis were prepared by drying the aqueous suspension of AgSCs at room temperature on a transparent carbon foil supported on a copper grid, and the images were obtained using a JEOL 2100 microscope (JEOL Ltd, Tokyo, Japan). The diameter of 120 AgNPs were measured. The suspension of AgSCs in NMM was monitored with electro-kinetic measurements of the zeta potential (Brookhaven Instruments Corporation, ZetaPALS, Holtsville, NY). The hydrodynamic diameter distribution of AgSCs in NMM was obtained using DLS (ANALYSETTE12 DynaSizer, Idar-Oberstein, Germany).
Exposure to NPs
The AgSCs were supplied in water at a concentration of 1.0 mg/mL. The dosing suspensions were prepared in NMM for the treatments. To disperse the AgNPs in medium, different concentrations of AgSC-containing media were sonicated twice for 1 min at room temperature at 40 W to prevent agglomeration. The dosing of AgSCs was based on our previous study (Begum et al., 2016). Different AgSC mass concentrations (0.0, 0.1, 1.0, 5.0, 10, 30, and 50 μg/mL) were first used to test the apoptosis response with the Caspase 3/7 Cell Viability Kit (Thermo Fisher Scientific), and then the minimal inhibitory concentration (IC25), half maximal inhibitory concentration (IC50), and maximal inhibitory concentration (IC100) were selected as particular doses based on the administered dose-response relationship curve. Three concentrations of AgSCs (0.1, 1.0, and 5.0 µg/mL) were chosen and added to the cells, followed by a 72-h incubation to determine changes in morphology, toxicity, and the expression of specific markers (i.e., MAP2, glial fibrillary acidic protein [GFAP], synaptophysin [Syn], postsynaptic density protein 95 [PSD-95], phosphorylated glycogen synthase kinase-3 [pGSK-3], and caspase-3). Recent studies conducted on rats have shown that these silver concentrations are relevant concentrations that might be found in rat brain tissue after in vivo exposure to AgNPs (Espinosa-Cristobal et al., 2013, Lee et al., 2013, Dziendzikowska et al., 2012). The dosimetry of nanomaterials, expressed as nanomaterial mass per volume and number of particles per volume, is summarized in Table 1. Since dissolved Ag+ from AgNPs has been proposed to mediate effects of AgNPs, AgNO3 (1 ng/mL) was also used and its effects were evaluated and compared with the effects of AgNPs. The antioxidant AA (100 µM) was used to reduce the effects of ROS. The concentration we used is in the same order of magnitude as that found in the cerebral extracellular space (200–400 µM) (Covarrubias-Pinto et al., 2015)
Table 1.
Dosimetry of citrate-coated silver nanoparticles
| Nanomaterial mass per volume (µg/mL) |
Number of particles per volume (number of particles/mL) |
|---|---|
| 0.1 | 2.30 × 10⁹ |
| 1.0 | 2.30 × 10¹⁰ |
| 5.0 | 1.15 × 10¹¹ |
Evaluation of neuronal morphology and neurite outgrowth
After exposure to different substances, the cellular morphology of living cells was observed using inverted phase contrast microscopy (EVOS, Life Technologies).
Neurite outgrowth was assessed using the Molecular Probes® Neurite Outgrowth Staining Kit (Thermo Fisher Scientific). Cells in 24-well plates were washed with phosphate buffered saline, and then incubated with working stain solution for 20 min at 37°C. After incubation, the stain was removed and the working background suppression solution was applied. Cells were analyzed under a fluorescence microscope (EVOS, Life Technologies). Neurite outgrowth was monitored via bright orange staining of the outer cell membrane surfaces.
Immunocytochemistry assay
For immunocytochemistry, cells were grown on coverslips in 24-well plates. Different concentrations of AgSCs, AgSCs + AA, and AgNO3 were added to the astrocyte/neuron cell culture. Seventy-two hours later, the cells were fixed with 4% paraformaldehyde (Sigma Aldrich) for 7 min and permeabilized with 0.1% (w/v) Triton X-100 (Sigma Aldrich) for 3 min. After washing with phosphate buffered saline, cells were incubated with 5% (w/v) bovine serum albumin and 10% (v/v) normal goat serum for 30 min at room temperature to block non-specific antibody binding. Following this, cells were incubated overnight at 4°C with primary antibodies against MAP2 (Invitrogen, catalog # MA5–12826), GFAP (GeneTex, catalog # GTX16997), Syn (Invitrogen, catalog # 180130), and PSD-95 (Invitrogen, catalog # MA1–045). The next day, cells were washed three times and incubated for 4 h with the fluorescently labeled secondary antibodies Alexa Fluor 488 goat anti-mouse immunoglobulin G and Alexa Fluor 546 goat anti-rabbit immunoglobulin G (Life Technologies, catalog # A-11029 and A-11010, respectively) at room temperature. Cells were washed and coverslips were transferred onto objective glasses with Fluoromount-G mounting medium containing 4’,6-diamidino-2-phenylindole (DAPI-FG, Southern Biotech). Cells were visualized and fluorescent images were captured using a fluorescent microscope (EVOS, Life Technologies). ImageJ was used to quantify MAP2 and GFAP expression in the cells, and the astrocyte/neuron ratio was calculated by dividing the GFAP integrated density by the MAP2 integrated density (http://imagej.nih.gov/ij/). Values are presented as the mean ± the standard error of the mean (SEM). Data were compared using one-way analyses of variance followed by Tukey’s post-hoc tests. Differences were considered statistically significant at p < 0.05.
Western blot analysis
In this experiment, we used primary antibodies against GFAP (GeneTex, catalog # GTX16997), MAP2 (Invitrogen, catalog # MA5–12826), pGSK-3α and pGSK-3β (Tyr279 and Tyr216) (Invitrogen, catalog # OPA1–03083), caspase-3 (Santa Cruz, catalog # sc-7148), and pAkt (Ser473) (Cell Signaling, catalog # 9271). All data are presented as the mean ± SEM. Data were compared using one-way analyses of variance followed by Dunnett’s post-hoc tests. Differences were considered statistically significant at p < 0.05.
RESULTS
AgSC characterization
Characterization of the 20-nm colloidal AgSCs that were made by the NCL (NIEHS, USA) can be found in Supplementary Table 1. The materials were suspended in NMM and characterized via TEM, DLS, and zeta-potential measurements. The average AgSC size, as evaluated by TEM, was 19.8 nm ± 2.1 nm (Figure 1). The measured zeta-potential value in NMM was −31 mV ± 11 mV. The DLS measurements in NMM showed an average hydrodynamic diameter of 28 nm.
Figure 1. Characterization of AgSCs by TEM.
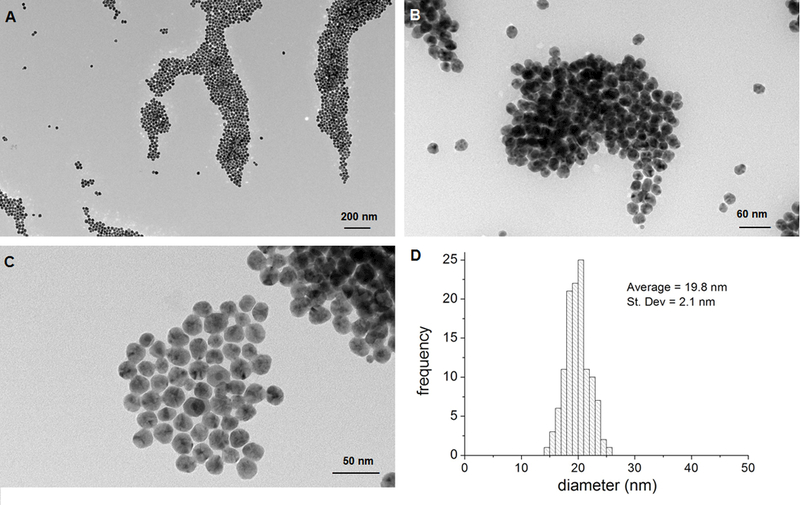
(A–C) Transmission electron micrographs of AgSCs. (D) AgSCs size distribution.
AgSCs altered the astrocyte/neuron ratio and astrocytic morphology
Using our recently developed neurodifferentiation protocol, a neuron and astrocyte network was derived from hESCs within 27 days (Begum et al., 2015). The percentage of astrocytes versus neurons was about 1:1 (Figure 2A) in the untreated cell culture. In the exposure experiment, different concentrations of AgSCs, AgSCs + AA, and AgNO3 were added to the neuronal cell culture. Seventy-two hours later, the populations of astrocytes and neurons were examined with the astrocyte marker GFAP and neuron marker MAP2 (Figure 2B–F). The astrocyte/neuron ratio was further determined via ImageJ quantification. Our results showed that AgSC at a concentration of 0.1 µg/mL elevated the astrocyte/neuron ratio from 1:1 in the untreated culture to 3:2, which indicates that low concentrations of AgSCs promote astrogenesis. In contrast, treatment with a higher concentration of AgSCs (5.0 µg/mL) significantly reduced the astrocyte/neuron ratio and changed the morphology of astrocytes compared to untreated cells.
Figure 2. Effects of AgSCs on the neuron/astrocyte ratio.
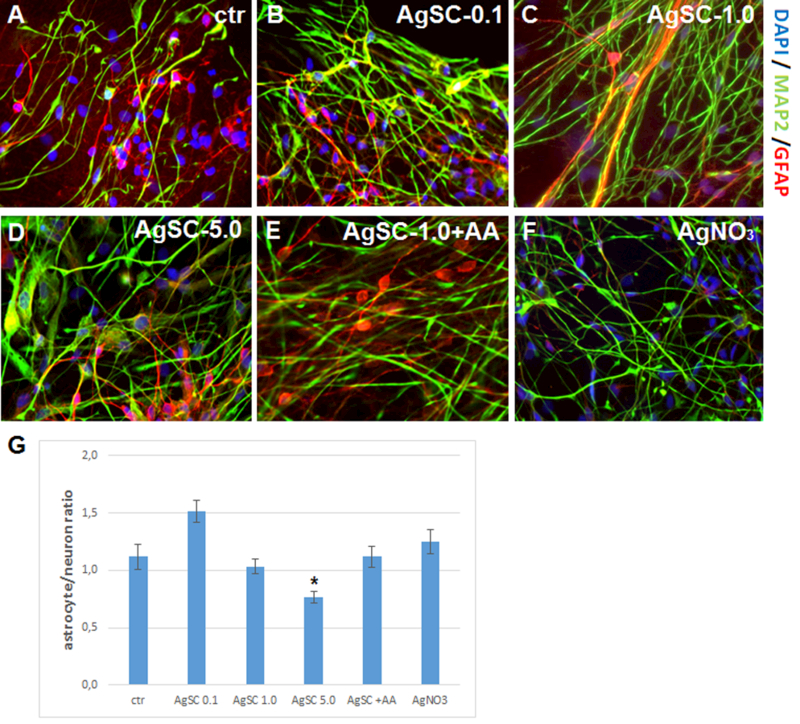
(A) Control cells expressed the mature neuron marker MAP2 (green) and astrocyte marker GFAP (red). (B) Treatment with AgSCs at a concentration of 0.1 µg/mL increased the astrocyte/neuron ratio. (C) Treatment with AgSCs at a concentration of 1.0 µg/mL had little effect on the astrocyte/neuron ratio. (D) Treatment with AgSCs at a concentration of 5.0 µg/mL decreased the astrocyte/neuron ratio. (E) Compared to cells treated with AgSCs alone (1.0 µg/mL), cells co-treated with AgSCs and AA exhibited reduced effects on the astrocyte/neuron ratio. (F) AgNO3 treatment had no significant effects on the astrocyte/neuron ratio. Scale bars: 10 µm. (G) ImageJ quantification of the astrocyte/neuron ratio calculated by dividing the GFAP integrated density by the MAP2 integrated density. Data are presented as the mean ± SEM from at least eight representative images; *p < 0.05 vs. the unexposed control group.
We examined GFAP and MAP2 expression using western blots, which showed that treatment with 0.1 and 1.0 µg/mL AgSC increased the expression of GFAP and the high molecular weight isoform of MAP2 (HMWMAP2) (Figure 3). At 1.0 µg/mL, AgSCs induced HMWMAP2 phosphorylation. However, co-treating cells with AgSCs and AA reduced the effects. Exposure to a high concentration of AgSCs (5.0 µg/mL) induced the degradation of MAP2. Our results suggest that the regulation of MAP2 expression may be an important molecular mechanism in AgSC-mediated neurotoxicity. In addition, exposure to AgNO3 (1 ng/mL) only slightly altered the astrocyte/neuron ratio and the MAP2 and GFAP expression levels compared to untreated cells.
Figure 3. AgSCs altered the expression of MAP2 isoforms and the astrocyte marker GFAP.
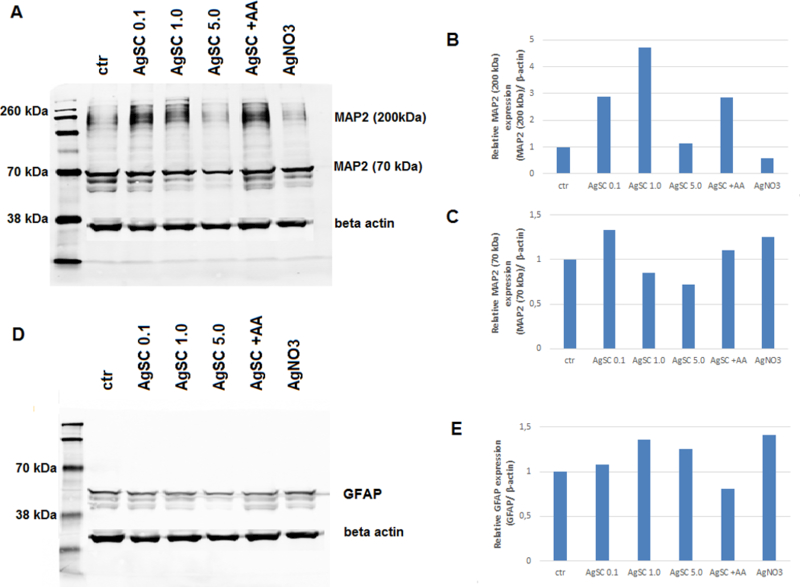
(A) Immunoblotting of MAP2 after exposure to three concentrations (0.1, 1.0, and 5.0 µg/mL) of AgSCs, AA, and AgNO3 for 72 h. (B) Exposure to AgSCs at 0.1 µg/mL and 1.0 µg/mL increased HMWMAP2 expression in comparison to the control group and the group treated with AgNO3. Co-treatment with AgSCs and AA reduced the phosphorylation of HMWMAP2 (top band). (C) Exposure to AgSCs at a concentration of 5.0 µg/mL reduced MAP2 expression due to cell death. (D, E) AgSC exposure increased GFAP protein expression. β-actin was used as the loading control.
AgSCs influenced neuronal morphology and neurite outgrowth
As studies have reported that MAP2 plays an important role in synaptic plasticity, neuronal cell death, and the outgrowth of neuronal processes, we further examined the effects of AgSCs on neuronal morphology and neurite outgrowth. The results showed that untreated neurons exhibited healthy cell bodies and a large number of long processes, which profusely branched to form an extensive network (Figure 4A). Exposing neurons to a low concentration of AgSCs (0.1 µg/mL) (Figure 4B) only slightly reduced the cell density and lowered the neurite outgrowth overlap. High-concentration AgSC exposures (1.0 and 5.0 µg/mL) yielded cells with rounded, shrunken cell bodies, retracted cellular extensions, and fragmentation of mature neurons (Figure 4C and 4D). Co-treatment with AgSCs and AA reduced the effects of AgSCs compared with cells treated with the same concentration of AgSCs alone (1.0 µg/mL) (Figure 4E). The results confirmed that AgSCs inhibited neurite outgrowth in a concentration-dependent manner and that AA treatment reduced the effects of AgSCs (Figures 4G–K). Moreover, AgNO3 (1 ng/mL) treatment only slightly reduced the cell density (Figure 4F) and lowered the neurite outgrowth overlap (Figure 4L), indicating that AgSCs and AgNO3 have different neuronal toxicity mechanisms.
Figure 4. Effects of AgSC on neuronal morphology and neurite outgrowth.
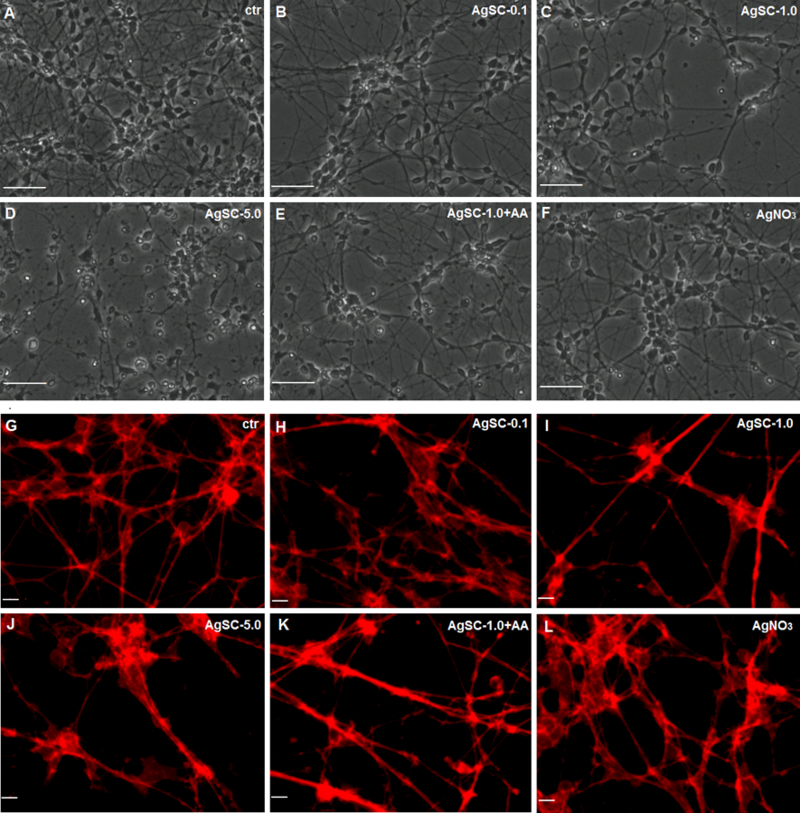
(A) The untreated control showed no cell damage. (B) Exposing cells to AgSCs at a concentration of 0.1 µg/mL resulted in slightly reduced cell density and fewer cell overlaps. (C, D) Cells treated with AgSCs at a concentration of 1.0 and 5.0 µg/mL showed rounded cell bodies, retracted cellular extensions, apoptotic bodies, and fragmentation of mature neurons. (E) Cells co-treated with AgSCs and AA exhibited fewer toxic effects than did cells treated solely with AgSCs at the same concentration. (F) Treatment with AgNO3 resulted in reduced cell density and fewer cell overlaps. Scale bars: 50 μm. (G) Untreated cells exhibited long processes that formed an extensive network. (H–J) AgSCs inhibited neurite outgrowth in a concentration-dependent manner. (K) Cells co-treated with AgSCs (1.0 µg/mL) and AA exhibited less damage in terms of cell outgrowth compared with cells treated solely with AgSCs (1.0 µg/mL). (L) AgNO3 treatment had no significant effects on the cell network. Scale bars: 10 μm.
AgSCs reduced the expression of Syn, PSD-95, and their co-localization
We next examined how AgSCs affect synaptic structural and functional components. Neurons were double stained for the presynaptic vesicle membrane protein Syn and the postsynaptic marker PSD-95 (Figure 5A–F). Untreated neurons showed extensive neuritic processes with dense labeling of Syn and PSD-95, as well as their co-localization (Figure 5A). Treatment with AgSCs at high concentrations (1.0 and 5.0 µg/mL) drastically reduced Syn and PSD-95 expression (Figure 5C and 5D) and the number of synaptic contacts. This effect was slightly reduced by the co-administration of AA with AgSCs (Figure 5E). Similar to the results for the highest AgSC concentration (5.0 µg/mL) (Figure 5D), AgNO3 drastically reduced Syn and PSD-95 expression and the number of synaptic contacts (Figure 5F).
Figure 5. AgSCs reduced the expression of the postsynaptic marker PSD-95 and the presynaptic vesicle membrane protein Syn and induced neurodegeneration through the Akt/GSK-3/caspase-3 pathway.
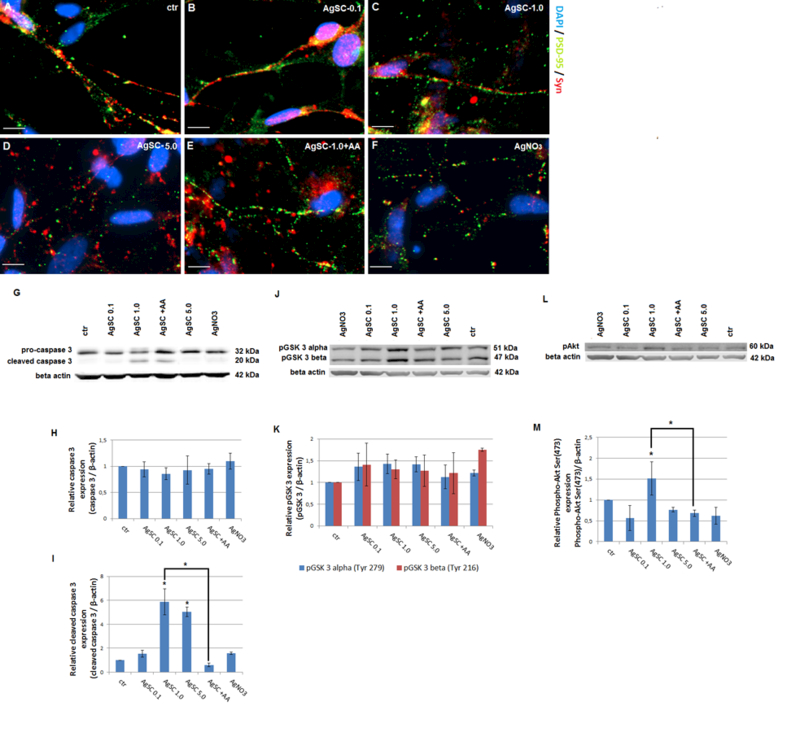
(A) Untreated control neurons showed extensive neuritic processes with dense puncta labeling of Syn and PSD-95. Co-localized spots (yellow) represent the location of potential synapses. (B–D) AgSC-treated neurons showed drastically reduced Syn and PSD-95 expression as well as fewer synapses, and these effects occurred in a concentration-dependent manner. (E) AA reduced the effects of AgSCs on synaptic protein expression. (F) AgNO3 drastically reduced Syn and PSD-95 expression. Scale bar: 10 µm. (G) Immunoblotting of pro-caspase-3 and cleaved caspase-3 after exposure to three concentrations (0.1, 1.0, and 5.0 µg/mL) of AgSCs, AA, and AgNO3 for 72 h. (H, I) Relative densitometric analysis of the bands for pro-caspase-3 and cleaved caspase-3 revealed that high concentrations of AgSCs (1.0 and 5.0 µg/mL) induced cleavage of caspase-3 in comparison to the control group. (J) Immunoblotting of phosphorylated GSK-3α/β at Tyr279/216. (K) Relative densitometric analysis of the bands for phosphorylated GSK-3α/β at Tyr279/216 showed that treatment with AgSC and AgNO3 increased phosphorylation of GSK-3α at Tyr279 and of GSK-3β at Tyr216. Co-treatment with AA reduced this phosphorylation. (L) Immunoblotting of pAkt at Ser473. (M) Relative densitometric analysis of the bands for pAkt at Ser473 displayed that pAkt levels were elevated when treated with AgSCs at a concentration of 1.0 µg/mL and reduced by AA. β-actin was used as the loading control. Data are expressed as the mean ± SEM from three independent experiments; *p < 0.05 vs. the unexposed control group.
AgSCs induced neurodegeneration through the Akt/GSK-3/caspase-3 pathway
Since AgSC exposure significantly reduced the number of neurons, we examined AgSC-induced neurodegeneration at the molecular level by detecting caspase-3 activation after AgSC exposure. Western blots (Figure 5G–M) showed that high concentrations of AgSCs (1.0 and 5.0 µg/mL) induced cleavage of caspase-3 that produced an additional band in comparison to the control group (Figure 5G). Additionally, AA suppressed the AgSC-induced activation of caspase-3. Next, we investigated whether the Akt/GSK-3/caspase-3 signaling cascade was involved in the AgSC-induced phosphorylation of MAP2 and neurodegeneration. As shown in Figure 4K, GSK-3α/β Tyr279/216 expression was slightly, but not significantly, increased after treatment with all concentrations of AgSCs or AgNO3. We also examined the phosphorylation status of Akt, an upstream protein kinase of GSK-3 that is responsible for its deactivation. The results demonstrated that the level of pAkt was elevated after exposure to AgSCs (1.0 µg/mL) and reduced by the co-administration of AgSCs and AA (Figure 5M). These data suggest that activation of the Akt/GSK-3/caspase-3 signaling pathway plays an important role in AgSC-mediated neurotoxicity in a manner that is distinct from that of AgNO3 (1 ng/mL) treatment.
DISCUSSION
Our recently developed neurosphere-based stem cell neurodifferentiation protocol can produce neuron and astrocyte networks and serves as an excellent cellular model for examining the effects of different agents, including NPs, on neurodegeneration. Using this model, the present study showed that exposure to AgSCs changed the astrocyte/neuron ratio, affected astrocytic morphology, altered MAP2 isoform expression, reduced neurite outgrowth, decreased the expression of PSD-95 and Syn, and induced neurodegeneration through the activation of GSK-3 α/β at Tyr279/216 and caspase-3. Most of these effects were less pronounced when the cell culture was co-administered with AgSCs and AA. Our results also suggest that a low concentration of AgSCs promotes astrocyte proliferation. In addition, this study provides evidence that AgNPs alone, not just dissolved Ag+ ions, have neurotoxic effects. Therefore, AgSCs and AgNO3 induce neuronal toxicity through different mechanisms.
Here, we found that AgSCs (1.0 and 5.0 µg/mL) reduced neuritic overlap and branching, caused the fragmentation of neurons in a concentration-dependent manner, and reduced astrocytic extensions. Similarly, a study on primary rat cortical cell cultures performed by Xu et al. (Xu et al., 2013), which used phase contrast imaging and a Live/Dead cell assay, revealed that AgNPs (at concentrations from 1 to 50 μg/mL) not only inhibited neurite outgrowth and reduced the cell viability of premature neurons and glial cells, but also induced degeneration of the neuronal processes of mature neurons.
Our data revealed significant degradation of both the presynaptic vesicle protein Syn and the postsynaptic receptor density protein PSD-95 when cells were treated with the highest concentration (5.0 µg/mL) of AgSC or AgNO3. Moreover, mature synaptic contacts, visible in control cells as distinct punctate co-localized spots, were already reduced at a lower AgSC concentration (1.0 µg/mL). Similar results were reported by Xu et al. (Xu et al., 2013), who found that 20-nm bare AgNPs at various concentrations (1.0, 5.0, 10, and 50 μg/mL) reduced the number of Syn and PSD-95 synaptic clusters, changed the cell morphology, and compromised cell-outgrowth integrity. It is known that MAP2 plays a critical role in regulating cytoskeleton dynamics, which is consistent with the proposed role of MAP2 in neurite outgrowth and synaptic plasticity. Previous studies reported that small injuries to cells change the expression of MAP2 isoforms. One such isoform, HMWMAP2, is primarily expressed in neuronal cell bodies, dendrites, dendritic spines, and postsynaptic densities and may be important for cell recovery. However, longer chronic or serious damage may lead to irreversible alterations in MAP2 and other cytoskeletal-associated proteins, subsequently leading to neuronal dysfunction and death. Furthermore, phosphorylation and dephosphorylation play important roles in regulating MAP2. In particular, a correlation between the activation of the Akt/GSK-3/caspase-3 signaling pathway and the phosphorylation state of MAP2 and several paradigms of synaptic plasticity have been discovered (Sanchez et al., 2000). Our study suggests that the activation of GSK-3α/β at Tyr279/216 and pAkt altered HMWMAP2 isoform expression, indicating that the MAP2 expression status might play an important role in AgSC-mediated neurotoxicity.
In the present study, we also examined the activation of GSK-3 and GSK-3-mediated apoptosis. Our analyses revealed that AgSCs elevated the Tyr279 GSK-3α and Tyr216 GSK-3β levels in all treatments, confirming the involvement of AgSC-mediated GSK-3 activation even at low exposure concentrations. In addition, we explored the activation of Akt, an upstream kinase of GSK-3, which is responsible for the phosphorylation and inactivation of GSK-3. We identified increased Ser473 Akt levels when cells were treated with 0.1 µg/mL AgSCs. On the other hand, higher concentrations of AgSCs did not increase Ser473 Akt levels. Caspase-3 activation was also assessed in terms of the amount of cleaved caspase-3 protein. Caspase-3 has been implicated as an “effector” caspase and is associated with the initiation of the “death cascade”; as such, caspase-3 is an important marker of the cell’s entry point into the apoptotic signaling pathway (Biosciences, 2010). Our western blot results showed that high concentrations of AgSCs upregulated the expression of cleaved caspase-3 compared to the control group. Similarly, in a study by Kim et al. (Kim et al., 2014), the apoptosis of cortical neuronal cells was detected as increased levels of cleaved caspase-3 after 12 and 24 h of exposure to AgNPs (10 µg/mL).
It should be noted that our analyses only evaluated the potential effects of AgSCs on the morphology and function of neurons and astrocytes, but not on the function of the network as a whole. We plan to further characterize the effects of AgNPs on the neuron and astrocyte network activity in our future study.
Our results confirm a link between the neurodegeneration process and the AA ameliorating effect, as initially suggested by Covarrubias-Pinto et al. (Covarrubias-Pinto et al., 2015). In our study, the protective effects of AA against AgSCs were most prominently observed in terms of the cell morphology and outgrowth as well as the activation of caspase-3. In mammals, the highest concentrations of AA are found in neurons in the central nervous system, with concentrations reaching up to 10 mM. The main function of intracellular AA in the central nervous system is to provide antioxidant protection against oxidative damage. It also functions as an enzymatic co-factor, participating in collagen, myelin, carnitine, tyrosine, and peptidic hormone biosynthesis; synaptic potentiation; and in the protection against glutamate toxicity. Further, imbalances in AA homeostasis have been demonstrated in neurodegenerative disorders; indeed, AA levels tend to be reduced in Alzheimer’s disease, Parkinson’s disease, Huntington’s disease, and amyotrophic lateral sclerosis. It has been suggested that increased dietary intake of AA may reduce the risk of developing neurodegenerative disorders (Covarrubias-Pinto et al., 2015, May, 2012). We assume that in our study, the protective effects of AA on neurons and astrocytes were at least partially caused by AA’s intracellular antioxidant activity. Several recent studies have evaluated the protective effects of different antioxidants against AgNPs’ toxicity using various cell lines; the results of these studies revealed that vitamin E, acetyl-L-carnitine, and N-acetyl-l-cysteine effectively block the adverse effects associated with AgNP exposure (Faedmaleki et al., 2016, Liu et al., 2015, Foldbjerg et al., 2011). Such findings support that oxidative stress is involved in AgNP-related toxicity and underlines the possibility of using antioxidants to prevent the neurotoxicity that is caused by oxidative stress-provoking substances.
The present study provides evidence that most responses to AgSC versus AgNO3 exposure are different, suggesting that the effects of AgSCs are not only caused by dissolved Ag+ ions but also by the particulate nature of AgSCs. We assume that even if AgSCs are completely dissolved, the amount of ions released would not exceed 5.9 nM (AgNO3 exposure concentration), as in the case of exposure to 0.1 µg/mL AgSCs. In the case of exposure to 1.0 µg/mL AgSCs, more than 50% of the particles would need to be dissolved to yield an Ag+ concentration of 5.9 nM, which is not a realistic scenario. As for exposure to 5.0 µg/mL AgSCs, about 10% of the particles would need to be dissolved to yield an Ag+ concentration of 5.9 nM. In all other cases except for synaptic protein expression, the effect could be ascribed to the particulate nature of AgSCs but not to dissolved ions. Several recent reports indicate that the endocytosis of AgNPs (Hsiao et al., 2016, Jiang et al., 2015) is responsible for their effects and reveal evidence of intracellular Ag+ ion dissolution (Jiang et al., 2015, Wildt et al., 2016, Veronesi et al., 2016). We therefore assume that AgSCs may be endocytosed, followed by the accelerated intracellular dissolution of NPs in the acidic endosomal-lysosomal system environment. The only exception is the effects on Syn and PSD-95 expression, as our results indicate that the effects of AgNO3 were similar to the effects of AgSCs at the highest concentration (5.0 µg/mL). Thus, it is possible that in the case of synaptic protein expression, the effects of AgSCs are mainly caused by the Ag+ ions that dissolve from particles in the suspension.
This study revealed that AgSCs only exhibited significant neurotoxic effects when cells were treated with high exposure concentrations. While low concentrations of AgSCs increased the astrocyte/neuron ratio, they did not induce major morphological changes in neurons. These findings suggest that astrocytes may exert neuroprotective effects during exposure to low concentrations of AgSCs. This is in line with other reports stating that the interaction between astrocytes and neurons is an important factor that limits the neuronal death induced by excitotoxins, oxidants, and other stressors (Chen et al., 2001). Moreover, astrocytes are suggested to protect neurons from oxidative stress. Various studies have shown that cultured neurons in the presence of astrocytes are more resistant to pro-oxidant agents such as hydrogen peroxide, nitric oxide, superoxide anion combined with nitric oxide, or iron (Covarrubias-Pinto et al., 2015). Since oxidative stress is suggested to be the major cause of AgSC-mediated neurotoxicity, we propose a mechanism whereby astrocytes mediate neuronal protection, as follows: when the neuronal network is exposed to a low concentration of AgSCs that promotes astrocyte proliferation, astrocytes prevent the AgSC cytotoxicity that is caused by elevated ROS. Higher concentrations of AgSCs that reduce the number of astrocytes consequently also accelerate neuronal apoptosis.
In summary, the findings of the present study suggest that AgSC exposure changed the astrocyte/neuron ratio, altered the morphology of astrocytes, reduced neurite outgrowth, reduced the number of synapses, and lowered Syn and PSD-95 expression. Our study also indicated that the altered isoform expression and phosphorylation status of MAP2 that is induced by the activation of GSK-3α/β at Tyr279/216 might play an important role in AgSC-mediated neurotoxicity in a manner that is distinct from that of AgNO3 (1 ng/mL) treatment. In addition, these effects can be reversed to a certain extent by the co-administration of AgSCs with AA, suggesting that oxidative stress is the major cause of AgSC-mediated neurotoxicity; thus, AA could potentially be used as an antioxidant for preventing AgSC-induced neurotoxicity.
SUPPLEMENTARY DATA DESCRIPTION
Characterization of citrate-coated silver nanoparticles.
Acknowledgments
FUNDING INFORMATION
This work was supported in part by grants from the US National Institutes of Environmental Health Sciences [1R15 ES019298–01A1 to YH] and US National Science Foundation (IOS-154173 to QQL).
Footnotes
DECLARATION OF INTEREST
The authors report no conflicts of interest.
REFERENCES
- Arora S, Jain J, Rajwade J,Paknikar K. 2008. Cellular responses induced by silver nanoparticles: in vitro studies. Toxicology letters 179: 93–100. [DOI] [PubMed] [Google Scholar]
- Begum AN, Aguilar JS, Elias L,Hong Y. 2016. Silver nanoparticles exhibit coating and dose-dependent neurotoxicity in glutamatergic neurons derived from human embryonic stem cells. NeuroToxicology 57: 45–53. [DOI] [PubMed] [Google Scholar]
- Begum AN, Guoynes C, Cho J, Hao J, Lutfy K,Hong Y. 2015. Rapid generation of sub-type, region-specific neurons and neural networks from human pluripotent stem cell-derived neurospheres. Stem cell research 15: 731–741. [DOI] [PMC free article] [PubMed] [Google Scholar]
- Bélanger M,Magistretti PJ. 2009. The role of astroglia in neuroprotection. Dialogues Clin Neurosci 11: 281–295. [DOI] [PMC free article] [PubMed] [Google Scholar]
- Biosciences B. Caspase-3 Activation-An Indicator of Apoptosis in Image-Based Assays. 2010.
- Carlson C, Hussain SM, Schrand AM, Braydich-Stolle LK, Hess KL, Jones RL,Schlager JJ. 2008. Unique cellular interaction of silver nanoparticles: size-dependent generation of reactive oxygen species. The journal of physical chemistry B 112: 13608–13619. [DOI] [PubMed] [Google Scholar]
- Chen Y, Vartiainen NE, Ying W, Chan PH, Koistinaho J,Swanson RA. 2001. Astrocytes protect neurons from nitric oxide toxicity by a glutathione‐dependent mechanism. Journal of neurochemistry 77: 1601–1610. [DOI] [PubMed] [Google Scholar]
- Covarrubias-Pinto A, Acuña AI, Beltrán FA, Torres-Díaz L,Castro MA. 2015. Old Things New View: Ascorbic Acid Protects the Brain in Neurodegenerative Disorders. International journal of molecular sciences 16: 28194–28217. [DOI] [PMC free article] [PubMed] [Google Scholar]
- Coyle JT,Puttfarcken P. 1993. Oxidative stress, glutamate, and neurodegenerative disorders. Science 262: 689–695. [DOI] [PubMed] [Google Scholar]
- Dayem AA, Kim B, Gurunathan S, Choi HY, Yang G, Saha SK, Han D, Han J, Kim K,Kim JH. 2014. Biologically synthesized silver nanoparticles induce neuronal differentiation of SH‐SY5Y cells via modulation of reactive oxygen species, phosphatases, and kinase signaling pathways. Biotechnology journal 9: 934–943. [DOI] [PubMed] [Google Scholar]
- Dziendzikowska K, Gromadzka‐Ostrowska J, Lankoff A, Oczkowski M, Krawczyńska A, Chwastowska J, Sadowska‐Bratek M, Chajduk E, Wojewodzka M,Dušinská M. 2012. Time‐dependent biodistribution and excretion of silver nanoparticles in male Wistar rats. Journal of Applied Toxicology 32: 920–928. [DOI] [PubMed] [Google Scholar]
- Espinosa-Cristobal L, Martinez-Castanon G, Loyola-Rodriguez J, Patino-Marin N, Reyes-Macias J, Vargas-Morales J,Ruiz F. 2013. Toxicity, distribution, and accumulation of silver nanoparticles in Wistar rats. Journal of nanoparticle research 15: 1–12. [Google Scholar]
- Faedmaleki F, Shirazi FH, Ejtemaeimehr S, Anjarani S, Salarian A-A, Ashtiani HA,Rastegar H. 2016. Study of Silymarin and Vitamin E Protective Effects on Silver Nanoparticle Toxicity on Mice Liver Primary Cell Culture. Acta Medica Iranica 54: 85–95. [PubMed] [Google Scholar]
- Foldbjerg R, Dang DA,Autrup H. 2011. Cytotoxicity and genotoxicity of silver nanoparticles in the human lung cancer cell line, A549. Archives of toxicology 85: 743–750. [DOI] [PubMed] [Google Scholar]
- Gajbhiye S,Sakharwade S. 2016. Silver Nanoparticles in Cosmetics. Journal of Cosmetics, Dermatological Sciences and Applications 6: 48. [Google Scholar]
- Gordon J, Amini S,White MK. 2013. General overview of neuronal cell culture. Neuronal Cell Culture: Methods and Protocols 1–8. [DOI] [PMC free article] [PubMed]
- Haase A, Rott S, Mantion A, Graf P, Plendl J, Thünemann AF, Meier WP, Taubert A, Luch A,Reiser G. 2012. Effects of silver nanoparticles on primary mixed neural cell cultures: uptake, oxidative stress and acute calcium responses. Toxicological Sciences 126: 457–468. [DOI] [PMC free article] [PubMed] [Google Scholar]
- Hsiao I-L, Bierkandt FS, Reichardt P, Luch A, Huang Y-J, Jakubowski N, Tentschert J,Haase A. 2016. Quantification and visualization of cellular uptake of TiO 2 and Ag nanoparticles: comparison of different ICP-MS techniques. Journal of Nanobiotechnology 14: 50. [DOI] [PMC free article] [PubMed] [Google Scholar]
- Ji JH, Jung JH, Kim SS, Yoon J-U, Park JD, Choi BS, Chung YH, Kwon IH, Jeong J,Han BS. 2007. Twenty-eight-day inhalation toxicity study of silver nanoparticles in Sprague-Dawley rats. Inhalation toxicology 19: 857–871. [DOI] [PubMed] [Google Scholar]
- Jiang X, Miclăuş T, Wang L, Foldbjerg R, Sutherland DS, Autrup H, Chen C,Beer C. 2015. Fast intracellular dissolution and persistent cellular uptake of silver nanoparticles in CHO-K1 cells: implication for cytotoxicity. Nanotoxicology 9: 181–189. [DOI] [PubMed] [Google Scholar]
- Kim S-H, Ko J-W, Koh S-K, Lee I-C, Son J-M, Moon C, Kim S-H, Shin D-H,Kim J-C. 2014. Silver nanoparticles induce apoptotic cell death in cultured cerebral cortical neurons. Molecular & Cellular Toxicology 10: 173–179. [Google Scholar]
- Lee JH, Kim YS, Song KS, Ryu HR, Sung JH, Park JD, Park HM, Song NW, Shin BS,Marshak D. 2013. Biopersistence of silver nanoparticles in tissues from Sprague–Dawley rats. Particle and fibre toxicology 10: 1. [DOI] [PMC free article] [PubMed] [Google Scholar]
- Lin MT,Beal MF. 2006. Mitochondrial dysfunction and oxidative stress in neurodegenerative diseases. Nature 443: 787–795. [DOI] [PubMed] [Google Scholar]
- Liu F, Mahmood M, Xu Y, Watanabe F, Biris AS, Hansen DK, Inselman A, Casciano D, Patterson TA,Paule MG. 2015. Effects of silver nanoparticles on human and rat embryonic neural stem cells. Frontiers in neuroscience 9: [DOI] [PMC free article] [PubMed] [Google Scholar]
- May JM 2012. Vitamin C transport and its role in the central nervous system. Water Soluble Vitamins Springer. [DOI] [PMC free article] [PubMed] [Google Scholar]
- Panyala NR, Peña-Méndez EM,Havel J. 2008. Silver or silver nanoparticles: a hazardous threat to the environment and human health. J Appl Biomed 6: 117–129. [Google Scholar]
- Romih T, Hočevar SB, Jemec A,Drobne D. 2016. Bismuth film electrode for anodic stripping voltammetric measurement of silver nanoparticle dissolution. Electrochimica Acta 188: 393–397. [Google Scholar]
- Simonian N,Coyle J. 1996. Oxidative stress in neurodegenerative diseases. Annual review of pharmacology and toxicology 36: 83–106. [DOI] [PubMed] [Google Scholar]
- Veronesi G, Deniaud A, Gallon T, Jouneau P-H, Villanova J, Delangle P, Carrière M, Kieffer I, Charbonnier P,Mintz E. 2016. Visualization, quantification and coordination of Ag+ ions released from silver nanoparticles in hepatocytes. Nanoscale 8: 17012–17021. [DOI] [PubMed] [Google Scholar]
- Wei L, Lu J, Xu H, Patel A, Chen Z-S,Chen G. 2015. Silver nanoparticles: synthesis, properties, and therapeutic applications. Drug discovery today 20: 595–601. [DOI] [PMC free article] [PubMed] [Google Scholar]
- Wildt BE, Celedon A, Maurer EI, Casey BJ, Nagy AM, Hussain SM,Goering PL. 2016. Intracellular accumulation and dissolution of silver nanoparticles in L-929 fibroblast cells using live cell time-lapse microscopy. Nanotoxicology 10: 710–719. [DOI] [PubMed] [Google Scholar]
- Xu F, Piett C, Farkas S, Qazzaz M,Syed NI. 2013. Silver nanoparticles (AgNPs) cause degeneration of cytoskeleton and disrupt synaptic machinery of cultured cortical neurons. Molecular brain 6: 1. [DOI] [PMC free article] [PubMed] [Google Scholar]
- Zhang X-F, Shen W,Gurunathan S. 2016. Silver Nanoparticle-Mediated Cellular Responses in Various Cell Lines: An in Vitro Model. International Journal of Molecular Sciences 17: 1603. [DOI] [PMC free article] [PubMed] [Google Scholar]
Associated Data
This section collects any data citations, data availability statements, or supplementary materials included in this article.
Supplementary Materials
Characterization of citrate-coated silver nanoparticles.