

Abstract
Advanced solid tumors are exposed to hypoxic conditions over longer periods of time as they grow. Tumor hypoxia is a major factor that induces malignant progression, but most previous studies on tumor hypoxia were performed under short‐term hypoxia for up to 72 hours and few studies have focused on tumor response to chronic hypoxic conditions. Here we show a molecular mechanism by which chronic hypoxia promotes invasive behavior in prostate cancer cells. We found that an epithelial‐mesenchymal transition (EMT)‐driving transcription factor, slug, is specifically upregulated under chronic hypoxia and promotes tumor cell migration and invasion. Unexpectedly, processes associated with EMT, such as loss of E‐cadherin, are not observed under chronic hypoxia. Instead, expression of ephrin‐B1, a ligand of Eph‐related receptor tyrosine kinases, is markedly induced by slug through E‐box motifs and promotes cell migration and invasion. Furthermore, slug and ephrin‐B1 are highly coexpressed in chronic hypoxic cells of human prostate adenocarcinoma tissues after androgen deprivation, which is known to cause tumor hypoxia. Taken together, these results indicate that chronic hypoxia‐induced slug promotes invasive behavior of prostate cancer cells by activating the expression of ephrin‐B1. In addition, ephrin‐B1 may be a novel therapeutic target in combination with androgen deprivation therapy for aggressive prostate cancer.
Keywords: androgen deprivation, chronic hypoxia, ephrin‐B1, invasion, slug
1. INTRODUCTION
The major cause of cancer deaths is metastasis.1, 2 Once epithelial tumor cells spread from the primary site of origin to other parts of the body, patients often have limited treatment options for cure. Therefore, elucidating the molecular mechanisms of metastasis and devising ways to prevent this process are critical to combat cancer.
Metastasis is a multistep process including local tumor cell invasion, intravasation, extravasation and colonization.2 At the earliest step of metastasis, tumor cells become more motile and invade through the basement membrane.3 To acquire these properties, tumor cells often undergo epithelial‐mesenchymal transition (EMT), a developmental process by which epithelial cells transdifferentiate into mesenchymal cells.4, 5 Examples of EMT in development can be observed during gastrulation and somitogenesis, as well as at the invasive edges of tumors, where this process plays a crucial role in the initiation of metastasis.4, 5, 6, 7, 8
Epithelial‐mesenchymal transition involves changes in gene expression profiles.9 During EMT, E‐cadherin, an epithelial adherens junction (AJ) protein, and cytokeratins are replaced by N‐cadherin, a mesenchymal AJ protein, and vimentin.7, 9 The replacement of E‐cadherin with N‐cadherin enables the epithelial cells to form homotypic interaction with stromal cells and it promotes their migration and invasion.10 Transcription factors of the snail family, snail and slug, and of the twist family, Twist1 and Twist2, are major drivers of EMT and are known to repress expression of the E‐cadherin gene.9
Advanced solid tumors develop regions with low oxygen concentrations (hypoxia) as they grow.11, 12 Oxygen delivery to solid tumors is reduced by deteriorating conditions for diffusion due to abnormal structure and function of the tumor microvessels and disturbed microcirculation. Tumor hypoxia is a major factor that induces malignant progression and is strongly associated with a poor clinical prognosis in a variety of cancers, including carcinoma of the head and neck,13 carcinoma of the uterine cervix,14 melanoma15 and prostate adenocarcinoma.16, 17 Several studies demonstrated that hypoxia promotes EMT by inducing the expression of EMT‐driving transcription factors by hypoxia‐inducible factor‐1α.18, 19, 20 Tumor cells in these studies were cultured under hypoxia for 18‐72 hours (acute hypoxic condition), but most solid tumors found in cancer patients are exposed to hypoxic conditions over longer periods of time (chronic hypoxic condition).11, 12 Therefore, we have investigated how chronic hypoxia affects the progression of tumors using human prostate cancer cells.21, 22, 23
In this study, we demonstrate that chronic hypoxia‐induced slug, an EMT‐driving transcription factor, promotes cell migration and invasion of prostate cancer cells by activating the expression of ephrin‐B1, a ligand of Eph‐related receptor tyrosine kinases. We further show that slug and ephrin‐B1 are coexpressed in chronic hypoxic cells in clinical samples of prostate adenocarcinoma after androgen deprivation therapy (ADT), which causes disruption of tumor blood vessels and results in tumor hypoxia.24, 25
2. MATERIAL AND METHODS
2.1. Plasmids and mutagenesis
pLenti6.3/V5‐DEST‐ephrin‐B1 and ‐slug were created by recombining the Gateway entry vectors containing the human ephrin‐B1 cDNA (FLJ80318AAAF, NITE Biological Research Center, Chiba, Japan) and slug cDNA (FLJ93051AAAF) with the destination vector pLenti6.3/V5‐DEST (Invitrogen, Carlsbad, CA, USA). The luciferase reporter plasmid pGL3‐Basic containing the human ephrin‐B1 promoter sequence from −1000 to +1 relative to the start site of transcription (pGL3‐Basic‐ephrin‐B1 promoter‐WT) was a gift from Professor Yoshimi Homma, Fukushima Medical University, Japan.26 Mutagenesis of the E‐box motifs, E‐box1 and E‐box2, in the ephrin‐B1 promoter was performed using the KOD‐Plus Mutagenesis Kit (TOYOBO, Osaka, Japan) and mutated reporter plasmids were designated as pGL3‐Basic‐ephrin‐B1 promoter‐E1m (mutation in E‐box1), −E2m (mutation in E‐box2), and −E1mE2m (mutations in both E‐box1 and 2). The sequence of forward primers used for mutagenesis were as follows: E1m: 5′‐gacaaagaccCCCGGGgcgaggccgg‐3′; E2m: 5′‐gactccgggtcCCCGGGcaagcagacag‐3′.
2.2. Cell culture
The human prostate cancer cell line LNCaP (ATCC, Rockville, MD, USA) was maintained in RPMI‐1640 (Sigma‐Aldrich, St Louis, MO, USA) supplemented with 15% heat‐inactivated fetal calf serum (FCS; Sigma‐Aldrich), 50 IU/mL penicillin, and 50 μg/mL streptomycin and cultured at 37°C in humidified cell incubators containing 5% CO2 and 95% air (in normoxia), or 5% CO2, 1% O2, and 94% N2 (in hypoxia). Acute hypoxia‐conditioned LNCaP cells (LNCaP/AH) were cultured under hypoxia for 48 hours, and chronic hypoxia‐conditioned LNCaP cells (LNCaP/CH1M and LNCaP/CH6M) were cultured for 1 and 6 months, respectively. The LNCaP/CH cells were passaged once a week with changing culture medium every 3‐4 days. The human embryonic kidney cell line 293T (ATCC CRL‐3216), the human breast cancer cell line MCF‐7 (ATCC HTB‐22), and the monkey kidney fibroblast cell line COS‐7 (ATCC CRL‐1651) were cultured in Dulbecco's modified Eagle's medium (Gibco, Grand Island, NE, USA) supplemented with 10% heat‐inactivated FCS, 50 IU/mL penicillin, and 50 μg/mL streptomycin.
2.3. Migration and invasion assays
Cell migration and invasion assays were performed under normoxic (for LNCaP/N) or hypoxic (for LNCaP/AH and LNCaP/CH) conditions using 24‐well BD BioCoat Control Insert Chambers with 8.0‐μm pore size polyethylene terephthalate membranes and BD BioCoat Matrigel Invasion Chambers, respectively (BD Biosciences, San Jose, CA, USA). Cells (5 × 10⁴ cells/well) were seeded in serum‐free RPMI‐1640 in the upper chamber and in RPMI‐1640 containing 15% heat‐inactivated FCS in the lower chamber. After 72 hours of incubation, cells that had migrated to the undersurface of the membranes were counted as previously described.22 The average number of cells was calculated from 3 independent experiments performed in triplicate.
2.4. Whole genome microarray and data analysis
Genome‐wide expression profiling was performed using the Whole Human Genome 4 × 44 K Microarray (Agilent Technologies, Tokyo, Japan) to identify differentially expressed genes among normoxia‐conditioned LNCaP cells (LNCaP/N), LNCaP/AH, and LNCaP/CH6M.23 Expression profiles of slug small interfering RNA (siRNA)‐treated LNCaP/CH6M (siSlug LNCaP/CH6M) cells and control siRNA‐treated LNCaP/CH6M (siScr LNCaP/CH6M) cells were compared to identify slug‐regulating genes. Ingenuity Pathway Analysis (IPA; Ingenuity Systems, Redwood, CA, USA) was used for the data analysis, as previously described.23
2.5. Real‐time quantitative RT‐PCR
First‐strand cDNA was synthesized from the total RNA using ThermoScript RT‐PCR System (Roche, Indianapolis, IN, USA). PCR was performed on a LightCycler system (Roche) using LightCycler FastStart DNA Master SYBR Green I reaction mix (Roche) and QuantiTect Primer Assays (QIAGEN, Hilden, Germany). The primers used were SNAI1 (snail; Hs_SNAI1_1_SG QuantiTect Primer Assay; QT00010010), SNAI2 (slug; Hs_SNAI2; QT00044128), EFNB1 (ephrin‐B1; Hs_EFNB1; QT00024143), and β‐actin (Hs_ACTB; QT00095431). β‐Actin mRNA quantification was used for normalization.
2.6. Western blotting
Cells were lysed in lysis buffer as described previously.22 Equal amounts of protein were loaded on each lane and separated on a sodium dodecylsulfate–polyacrylamide gel and transferred to PVDF membranes (Millipore, Bedford, MA, USA). The membranes were probed with the appropriate antibodies followed by the enhanced chemiluminescence Prime Western blotting detection system (Amersham, Little Chalfont, UK). The following antibodies were used: anti‐snail rabbit IgG (1:1000; Cell Signaling Technology, Beverly, MA, USA); anti‐slug rabbit IgG (1:1000; Cell Signaling); anti‐E‐cadherin rabbit IgG (1:1000; Cell Signaling); anti‐N‐cadherin (1:1000; Cell Signaling); anti‐vimentin (1:1000; Cell Signaling); anti‐β‐tubulin mouse monoclonal IgG (1:5000; Millipore); and horseradish peroxidase‐conjugated goat anti‐mouse or anti–rabbit IgG as a secondary antibody (1:2000; Promega, Madison, WI, USA).
2.7. RNAi experiments
The LNCaP/CH6M cells were transfected with siRNAs (20 nmol/L final concentration) using Lipofectamine RNAiMAX (Invitrogen). siRNA duplexes (Dharmacon, Little Chalfont, UK) used to target slug and ephrin‐B1 mRNAs were as follows: slug, 5′‐ UCUCUCCUCUUUCCGGAUA‐3′, 5′‐GCGAUGCCCAGUCUAGAAA‐3′, 5′‐ACAGCGAACUGGACACACA‐3′, 5′‐GAAUGUCUCUCCUGCACAA‐3′; ephrin‐B1, 5′‐CGACAUCAUCAUUCCCUUA‐3′, 5′‐GAAAUACGCUUUACCAUCA‐3′, 5′‐UCAAGAAGCACCAUGAUUA‐3′, 5′‐UCAAGAAGCACCAUGAUUA‐3′, 5′‐GAGACAAGCUGGACAUCAU‐3′. The negative control siRNA (siScr, Stealth RNAi Negative Control Duplexes) was from Invitrogen.
2.8. Immunofluorescence analysis
The LNCaP cells grown on chamber slides were fixed with 4% paraformaldehyde followed by permeabilization with PBS plus 0.1% Triton X‐100. The cells were incubated with anti‐E‐cadherin rabbit IgG (1:200; Cell Signaling) and anti‐vimentin mouse monoclonal IgG (1:50; Santa Cruz, Dallas, TX, USA), and subsequently stained with secondary antibodies conjugated to Alexa 488 or 594 (1:1000; Invitrogen). The nuclei were stained with DAPI. Images were photographed with a Carl Zeiss LSM‐710 laser scanning microscope. Clinical samples of prostate adenocarcinoma and healthy prostate tissues were obtained from the Department of Urology, Oita University Hospital, under approval from the Ethics Committee of Oita University Faculty of Medicine (Permission number: 1340). To analyze effects of androgen deprivation on normal prostate tissues, normal glands adjacent to the cancerous lesions were studied. The tissues were fixed with 10% buffered formalin, and paraffin‐embedded tissue sections were deparaffinized and incubated with 10% normal goat serum in PBS for 10 min, followed by incubation with anti‐ephrin‐B1 rabbit IgG (1:50; Santa Cruz), anti‐slug mouse monoclonal IgG (1:50; Santa Cruz), and anti‐carbonic anhydrase IX (CAIX) mouse monoclonal IgG (1:200; Abcam, Cambridge, MA, USA). Double staining was performed as described herein.
2.9. Production of lentivirus and generation of stable cell lines
Lentiviruses carrying pLenti6.3/V5‐DEST‐ephrin‐B1 or pLenti6.3/V5‐DEST empty (control) were packaged with 293T cells using the ViraPower Lentiviral Expression System (Invitrogen). LNCaP cells were infected with the lentiviral particles and the ephrin‐B1 control or overexpressing cell lines were selected using 10 μg/mL blasticidin (Invitrogen).
2.10. Cell transfection and luciferase reporter assays
The LNCaP cells were seeded into 6‐well plates (4 × 10⁵ cells/well) and transfected with pLenti6.3/V5‐DEST‐slug (0‐1000 ng/well) using Lipofectamine 3000 (Invitrogen). Cells were harvested for total RNA extraction 72 hours after transfection. For luciferase reporter assays, LNCaP cells were seeded in 12‐well plates (1 × 10⁵ cells/well) and transfected with 1000 ng/well reporter constructs (pGL‐Basic‐ephrin‐B1 promoter WT, E1m, E2m, or E1mE2m), 1 ng/well Renilla‐luciferase vector (pRL‐SV40, Promega), and pLenti6.3/V5‐DEST‐slug (0‐1000 ng/well) using Lipofectamine 3000. The cells were harvested 72 hours after transfection and the activity of firefly and Renilla luciferases were measured using the Dual‐Luciferase Reporter Assay System (Promega). The firefly luciferase activity was normalized to the Renilla luciferase activity.
2.11. Chromatin immunoprecipitation assays
Chromatin immunoprecipitation (ChIP) was carried out using a ChIP‐IT Express Enzymatic kit (Active Motif, Tokyo, Japan) according to manufacturer's instructions. DNA‐bound proteins extracted from the LNCaP/CH6M cells were immunoprecipitated with anti‐slug mouse monoclonal IgG (Santa Cruz) or control mouse IgG (Santa Cruz). The DNA pulled down by ChIP was subjected to PCR amplification of the ephrin‐B1 promoter regions containing E‐box1 or E‐box2. The primer sequences were as follows: E‐box1‐containing region: forward, 5′‐GGTCTGAGCTATGGGATCGAG‐3′; reverse, 5′‐GCATCCTGGACCGGAGAAG‐3′; E‐box2‐containing region: forward, 5′‐TCCCCCTCCCACTGTTCTCAC‐3′; reverse, 5′‐CCTCGTCCAGTCCCACGTAA‐3′.
2.12. Statistical analysis
Data are expressed as mean ± SD. Statistical analysis was performed using Student's t test. P < 0.05 was considered statistically significant.
3. RESULTS
3.1. Chronic hypoxia promotes prostate cancer cell migration and invasion
Chronic hypoxia has been shown to promote invasive behavior of human prostate cancer cells, LNCaP.21, 22, 23 Here, we confirmed that cell migration and invasion are increased under chronic hypoxic conditions by performing migration and invasion assays (Figure 1). Cell invasion under chronic hypoxia for >6 months (LNCaP/CH6M) was significantly increased by 24‐fold compared with normoxia (LNCaP/N), and 4‐fold compared with acute hypoxia (LNCaP/AH).
Figure 1.

Chronic hypoxia promotes migration and invasion of the prostate cancer cell, LNCaP. A, Toluidine blue staining of cells that migrated or invaded to the undersurface of the membrane under normoxic (N), acute hypoxic (AH), and chronic hypoxic (CH6M) conditions. Cell migration (upper panels) and invasion (lower panels) were analyzed using Control Insert Chambers and Matrigel Invasion Chambers respectively. B, Fold change of the number of the cells that migrated or invaded to the undersurface of the membrane. Data given as mean ± SD. *P < 0.05
3.2. Chronic hypoxia specifically upregulates the expression of an EMT‐driving transcription factor, slug
Given that EMT has been implicated in cell migration, invasion and initiation of metastasis,4, 5, 6, 7, 8 we next analyzed the expression of major EMT‐driving genes of the snail family, snail, slug, and Smuc; and of the twist family, Twist1 and Twist2.9 In our previous study, we performed the genome‐wide expression profiling to identify differentially expressed genes among LNCaP/N, LNCaP/AH, and LNCaP/CH6M.23 Using these profiling data, we found that expression of slug was specifically and strongly upregulated under chronic hypoxia in LNCaP/CH6M by 30‐fold compared with in LNCaP/N and LNCaP/AH (Figure 2A). We further confirmed that slug mRNA and protein levels were markedly enhanced in LNCaP/CH6M on quantitative RT‐PCR and western blot analysis, respectively (Figure 2B,C).
Figure 2.
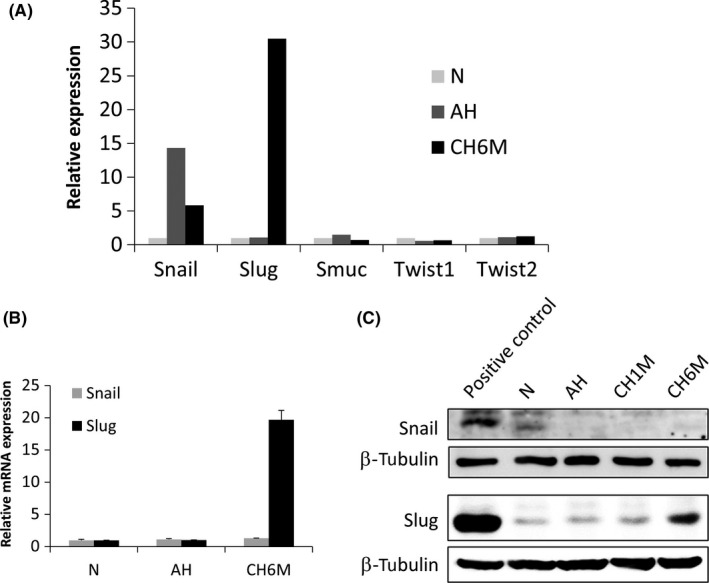
Chronic hypoxia specifically upregulates expression of an epithelial‐mesenchymal transition (EMT)‐driving transcription factor slug. A, Fold change of expression levels of EMT‐driving genes, snail, slug, Smuc, Twist1, and Twist2, in LNCaP under normoxic (N), acute hypoxic (AH), and chronic hypoxic (CH6M) conditions. B, Quantitative RT‐PCR and C, western blot analysis of expression of snail and slug in LNCaP under the same conditions. B, Data given as mean ± SD. C, Total cell lysates of COS‐7 and 293T were used as positive controls for snail and slug expression, respectively. β‐Tubulin was used as a loading control
3.3. siRNA‐mediated repression of slug strongly inhibits chronic hypoxia‐induced cell migration and invasion
To demonstrate whether the upregulation of slug is required for chronic hypoxia‐induced enhancement of cell migration and invasion, siRNA‐mediated repression of slug was performed in LNCaP/CH6M cells. We first confirmed that there was reduced expression of slug in the slug siRNA‐transfected LNCaP/CH6M cells (siSlug; Figure 3A). Knockdown of slug strongly inhibited migration and invasion of LNCaP/CH6M (siSlug) compared with non‐targeting control siRNA‐transfected cells (siScr; Figure 3B,C). This suggests that slug plays a crucial role in increasing cell migration and invasion, which is induced by chronic hypoxia.
Figure 3.
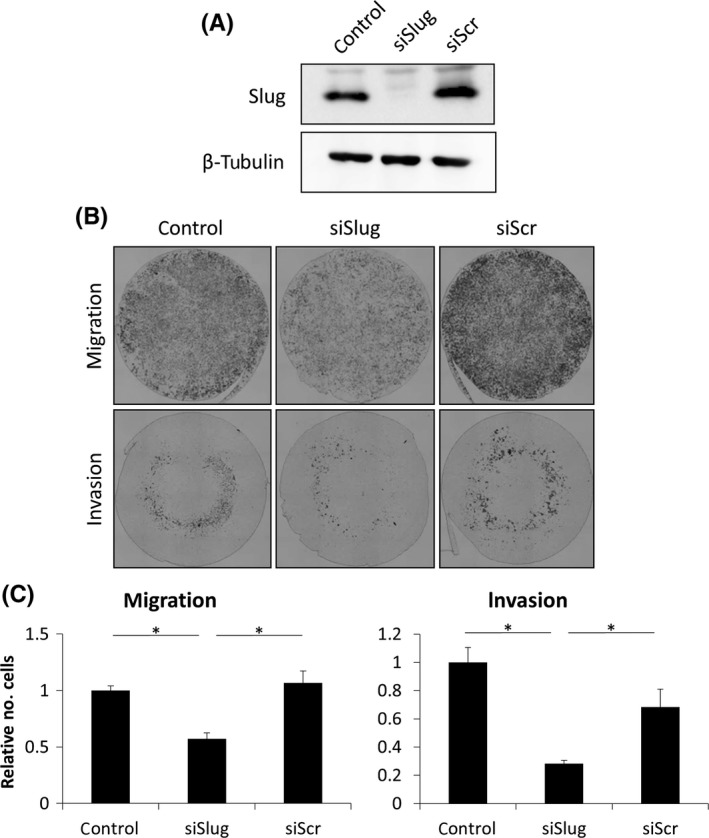
Knockdown of slug inhibits chronic hypoxia‐induced cell migration and invasion. A, Western blot analysis of slug expression in the non‐transfected (control), slug siRNA‐transfected (siSlug), and control siRNA‐transfected (siScr) LNCaP/CH6M cells. β‐Tubulin was used as a loading control. B, Toluidine blue staining of the siRNA‐transfected (control, siSlug, and siScr) LNCaP/CH6M cells that migrated to the undersurface of the membrane. C, Fold change of the number of cells that migrated or invaded to the undersurface of the membrane (n = 4). Data given as mean ± SD. *P < 0.05
3.4. Neither loss of E‐cadherin expression nor induction of mesenchymal markers is observed in the LNCaP/CH6M cells
As mentioned herein, slug is a well‐known EMT‐driving transcription factor.9 Therefore, to confirm that the EMT process was actually activated by chronic hypoxia‐induced slug, we investigated whether there is loss of E‐cadherin and increase in expression of N‐cadherin, an event considered one of the hallmarks of EMT,4, 5 on western blot analysis. Unexpectedly, we found that the expression of E‐cadherin was almost unchanged between normoxic and hypoxic conditions and neither N‐cadherin nor vimentin, a mesenchymal intermediate filament component,9 was induced by chronic hypoxia (Figure 4A). Furthermore, on light microscopy the LNCaP/CH6M cells were not dispersed and did not show fibroblast‐like shapes that are characteristic of mesenchymal cells.4, 5 In addition, on immunocytochemistry the E‐cadherin expression was sustained and vimentin expression was not induced in LNCaP/CH6M, consistent with the western blot results (Figure 4B). This suggests that chronic hypoxia‐induced slug enhances invasive behavior without inducing EMT‐like features such as repression of E‐cadherin, and it appears to be promoting cell migration and invasion through alternative pathways.
Figure 4.
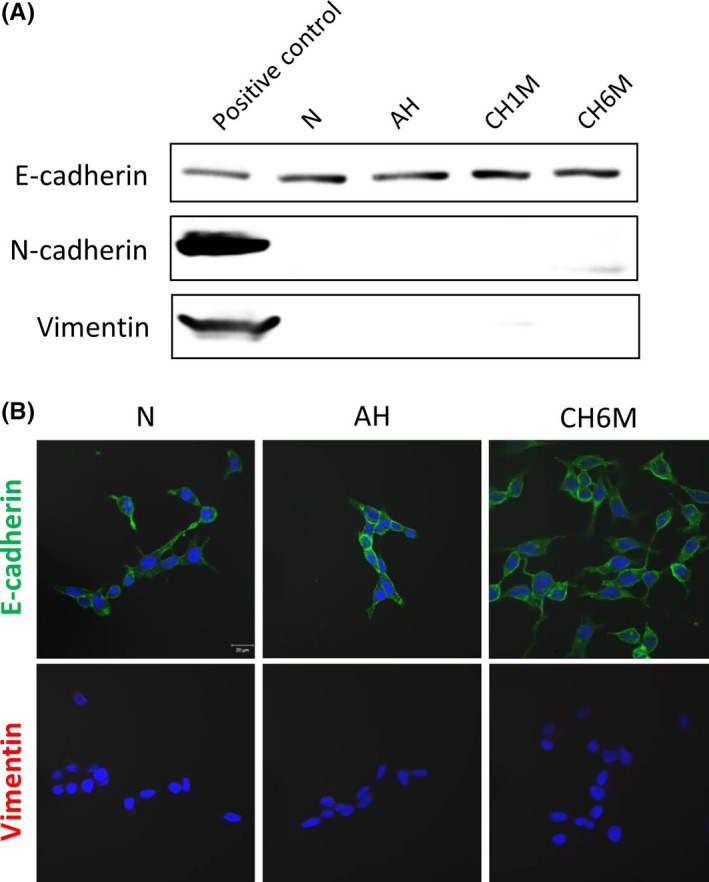
Chronic hypoxia does not show epithelial‐mesenchymal transition‐like features such as loss of E‐cadherin. A, Western blot analysis of expression of E‐cadherin, N‐cadherin and vimentin in LNCaP cells under normoxic (N), acute hypoxic (AH), and chronic hypoxic (CH1M and CH6M) conditions. Total cell lysates of MCF7, 293T, and COS‐7 were used as positive controls for E‐cadherin, N‐cadherin, and vimentin expression, respectively. B, Immunofluorescence staining of E‐cadherin (green) and vimentin (red) in LNCaP cells under the same conditions. DAPI was used to stain nuclei (blue)
3.5. Identification of chronic hypoxia‐induced slug‐upregulated genes associated with cell migration and invasion
We compared expression profiles of slug siRNA‐treated LNCaP/CH6M (siSlug LNCaP/CH6M) with those of control siRNA‐treated LNCaP/CH6M (siScr LNCaP/CH6M) and identified genes that had their expression significantly downregulated in siSlug LNCaP/CH6M (>50% reduction). In other words, these genes correspond to the genes upregulated by chronic hypoxia‐induced slug. We also chose genes specifically upregulated by chronic hypoxia (>2‐fold increase) by comparing the gene expression microarray data of LNCaP/N with that of LNCaP/CH6M.23 From the list of the genes upregulated by slug as well as chronic hypoxia, we then selected genes known to be associated with cell migration and invasion using IPA (Table 1).
Table 1.
Chronic hypoxia‐induced slug‐upregulated genes associated with cell migration and invasion
| Gene symbol | Gene name |
|---|---|
| PGC | Progastricsin (pepsinogen C) |
| PLEKHA6 | Pleckstrin homology domain containing, family A member 6 |
| LAMC1 | Laminin, gamma 1 (formerly LAMB2) |
| RNF182 | Ring finger protein 182 (RNF182) |
| C2orf72 | Chromosome 2 open reading frame 72 |
| APOL3 | Apolipoprotein L, 3 |
| ZNF577 | Zinc finger protein 577 |
| CA12 | Carbonic anhydrase XII |
| KRT19 | Keratin 19 |
| ASB2 | Ankyrin repeat and SOCS box‐containing 2 |
| TLR3 | Toll‐like receptor 3 |
| C1orf21 | Chromosome 1 open reading frame 21 |
| NLGN4X | Neuroligin 4, X‐linked |
| DPYSL2 | Dihydropyrimidinase‐like 2 |
| FAM189A2 | Family with sequence similarity 189, member A2 |
| KIAA1683 | KIAA1683 |
| GPR162 | G protein‐coupled receptor 162 |
| TNNT1 | Troponin T type 1 (skeletal, slow) |
| PPFIA4 | Protein tyrosine phosphatase, receptor type, f polypeptide (PTPRF), interacting protein (liprin), alpha 4 |
| LHFPL2 | Lipoma HMGIC fusion partner‐like 2 |
| TGFBR3 | Transforming growth factor, beta receptor III |
| FHL2 | Four and a half LIM domains 2 |
| TMEM45A | Transmembrane protein 45A |
| SLC24A3 | Solute carrier family 24 (sodium/potassium/calcium exchanger), member 3 |
| CLEC3B | C‐type lectin domain family 3, member B |
| SDC3 | Syndecan 3 |
| HES2 | Hairy and enhancer of split 2 (Drosophila) |
| EFNB1 | Ephrin‐B1 |
| AP1S2 | Adaptor‐related protein complex 1, sigma 2 subunit |
| RASSF2 SCNN1G | Ras association (RalGDS/AF‐6) domain family member 2 sodium channel, non‐voltage‐gated 1, gamma |
| STMN4 | Stathmin‐like 4 |
| HTR5A | 5‐hydroxytryptamine (serotonin) receptor 5A |
| MDGA1 | MAM domain containing glycosylphosphatidylinositol anchor 1 |
| PFKFB4 | 6‐phosphofructo‐2‐kinase/fructose‐2,6‐biphosphatase 4 |
| ATP11C | ATPase, class VI, type 11C |
| ANK1 | Ankyrin 1, erythrocytic |
| TECPR2 | Tectonin beta‐propeller repeat containing 2 |
| HSPA6 | Heat shock 70 kDa protein 6 (HSP70B’) |
3.6. Chronic hypoxia‐induced ephrin‐B1 promotes cell migration and invasion
Given that elevated expression of B‐type ephrin (a ligand of Eph‐related receptor tyrosine kinases) has been known to correlate with progression and metastasis in various cancers27, 28, 29 and recent work suggests that the B‐type ephrin‐mediated signaling acts as a regulator of prostate development,30 we decided to focus on EFNB1, which encodes an ephrin‐B1 ligand (Table 1). First we confirmed that expression of ephrin‐B1 is strongly upregulated under chronic hypoxia in LNCaP/CH6M (Figure 5A). EphB1, 2, 3, 4, and 6 are known to work as ephrin‐B1 receptors.31 We found that EphB2, 3, and 4 are preferentially expressed in LNCaP/CH6M and that expression of EphB4 is markedly induced under chronic hypoxia (Figure S1). Second, to investigate whether the upregulation of ephrin‐B1 promotes cell migration and invasion under chronic hypoxia, siRNA‐mediated repression of ephrin‐B1 was performed in LNCaP/CH6M. We confirmed that there was reduced expression of ephrin‐B1 in the ephrin‐B1 siRNA‐transfected LNCaP/CH6M cells (siEphrin‐B1; Figure 5B). Knockdown of ephrin‐B1 strongly inhibited migration and invasion of LNCaP/CH6M (siEphrin‐B1 LNCaP/CH6M) (>75% reduction) compared with control siRNA‐transfected cells (siScr LNCaP/CH6M; Figure 5C,D). Furthermore, forced expression of ephrin‐B1 in LNCaP/N significantly enhanced cell migration and invasion (Figure 5E,F,G), indicating that chronic hypoxia‐induced ephrin‐B1 promotes cell migration and invasion.
Figure 5.
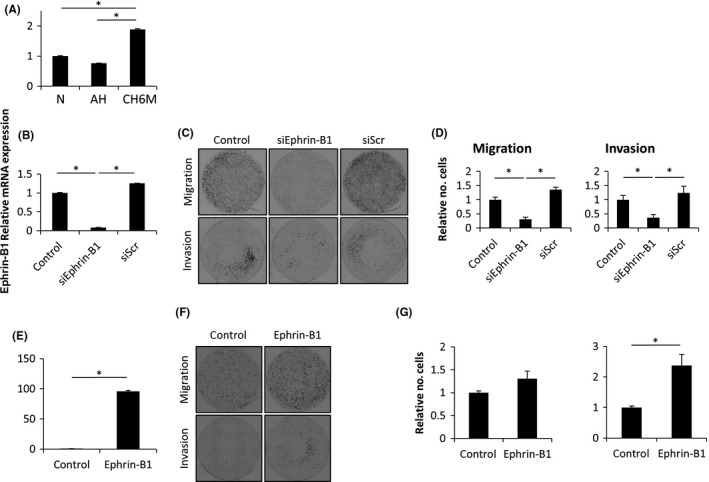
Chronic hypoxia‐induced ephrin‐B1 promotes cell migration and invasion. A, Relative expression of ephrin‐B1 mRNA in LNCaP under normoxic (N), acute hypoxic (AH), and chronic hypoxic (CH6M) conditions. B, Relative expression of ephrin‐B1 mRNA in non‐transfected (control), ephrin‐B1 siRNA‐transfected (siEphrin‐B1) and control siRNA‐transfected (siScr) LNCaP/CH6M cells. C, Toluidine blue staining of the siRNA‐transfected (control, siEphrin‐B1, and siScr) LNCaP/CH6M cells that migrated to the undersurface of the membrane. D, Fold change of the number of the cells that migrated or invaded to the undersurface of the membrane. E, Relative expression of ephrin‐B1 mRNA in the stably ephrin‐B1‐overexpressing LNCaP/N cells (ephrin‐B1) and empty vector‐overexpressing LNCaP/N cells (control). F, Toluidine blue staining of the ephrin‐B1 control and overexpressing LNCaP/N cells that migrated or invaded to the undersurface of the membrane. G, Fold change of the number of the cells that migrated or invaded to the undersurface of the membrane. Data given as mean ± SD. *P < 0.05
3.7. Chronic hypoxia‐induced slug activates expression of ephrin‐B1 through E‐box motifs
We next examined whether expression of the ephrin‐B1 gene is actually activated by chronic hypoxia‐induced slug in LNCaP/CH6M. Slug siRNA‐transfected LNCaP/CH6M cells had a significantly decreased ephrin‐B1 mRNA level (>50% reduction), while control siRNA had no detectable effect on ephrin‐B1 mRNA level (Figure 6A). We further confirmed that ephrin‐B1 mRNA was upregulated by forced expression of slug in a dose‐dependent manner in LNCaP/N (Figure 6B). Slug functions either as an activator20, 32, 33, 34 or a repressor34, 35, 36, 37 by binding to an E‐box, a sequence containing the CANNTG motif, in its target gene promoters.20, 32, 35, 36, 37 We found 2 E‐boxes at positions at −877 (E1) and −483 (E2) relative to the transcription start site (+1) of the ephrin‐B1 gene (Figure 6C). To confirm that the E‐boxes in the ephrin‐B1 promoter are essential for the slug‐mediated transactivation of ephrin‐B1, we used the luciferase reporter plasmid containing the ephrin‐B1 promoter sequence (from −1000 to +1 relative to the transcription start site, WT) and introduced mutations in either E‐box1 or E‐box2 as well as both E‐box1 and 2 (E1m, E2m, and E1mE2m, respectively) in the promoter (Figure 6C).26 The LNCaP/N cells were co‐transfected with the WT reporter plasmid and various amounts of the slug expression vector. As expected, slug increased the ephrin‐B1 promoter activity in a dose‐dependent manner (Figure 6D). Mutations of E‐boxes in the promoter, E1m, E2m, and E1mE2m, led to an almost complete loss of slug‐mediated activation of the ephrin‐B1 promoter (Figure 6E). Furthermore, we performed ChIP assays to investigate whether endogenous slug could be recruited to the E‐box motifs in the ephrin‐B1 promoter. As shown in Figure 6F, slug indeed bound to both E‐box‐containing regions, but predominantly bound to the E‐box1. Taken together, these results demonstrated that chronic hypoxia‐induced slug activates the expression of ephrin‐B1 through E‐box motifs.
Figure 6.
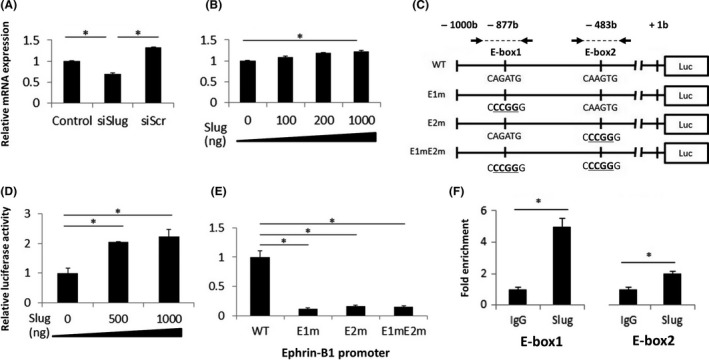
Chronic hypoxia‐induced slug activates expression of ephrin‐B1 through E‐box motifs. A, Relative expression of ephrin‐B1 mRNA in non‐transfected (control), slug siRNA‐transfected (siSlug) and control siRNA‐transfected (siScr) LNCaP/CH6M cells. B, Relative expression of ephrin‐B1 mRNA in the LNCaP/N cells transfected with various amounts of the slug‐expression vector, pLenti6.3/V5‐DEST‐slug (0‐1000 ng). C, Schematic diagram of luciferase reporter constructs containing wild‐type human ephrin‐B1 promoter (pGL‐Basic‐ephrin‐B1 promoter WT), E‐box1 (E1m) or E‐box2 (E2m) mutations, or double mutations (E1mE2m). Arrows, primer pairs flanking E‐box motifs used for chromatin immunoprecipitation (ChIP) analysis. D, Effect of slug overexpression on the wild‐type ephrin‐B1 promoter activity. LNCaP/N cells were transfected with 1000 ng pGL‐Basic‐ephrin‐B1 promoter WT and various amounts of the slug‐expression vector, pLenti6.3/V5‐DEST‐slug (0‐1000 ng). Firefly luciferase activity was normalized to Renilla luciferase activity. E, Mutational analysis of the E‐box motifs in the ephrin‐B1 promoter. LNCaP/N cells were transfected with 1000 ng pLenti6.3/V5‐DEST‐slug, and 1000 ng pGL‐Basic‐ephrin‐B1 promoter WT, E1m, E2m, or E1mE2m. F, ChIP analysis of slug on the E‐box regions in the ephrin‐B1 promoter. Soluble chromatin extracted from LNCaP/CH6M cells was immunoprecipitated with anti‐slug and control IgG antibodies. ChIP was analyzed on quantitative PCR using primers flanking the E‐box motifs, E‐box1 and E‐box2, shown in (C). Fold change compared with control IgG‐enriched DNA fragments was measured. Data given as mean ± SD. *P < 0.05
3.8. Coexpression of slug and ephrin‐B1 is strongly induced in human prostate adenocarcinoma cells by ADT
We next examined slug and ephrin‐B1 expression levels and patterns in 24 prostate adenocarcinoma (12 cases of high‐grade or poorly differentiated cancer with Gleason score ≥ 7 and 12 cases of low‐grade or well‐differentiated cancer with Gleason score < 7) and 12 healthy prostate tissues. As shown in Figure 7A, most of the healthy prostate tissue and prostate adenocarcinoma cells barely expressed slug and ephrin‐B1. In some cases of prostate adenocarcinoma (1 of 12 low‐grade cases and 1 of 12 high‐grade cases), slug and ephrin‐B1 were obviously coexpressed in the same cells, but their expression levels did not correlate with tumor histological grade. Given that androgen deprivation has been shown to cause tumor hypoxia over a prolonged period of time by a marked loss of tumor‐associated microvessels in the human prostate tumor xenograft models,24, 25 we next investigated their expression levels and patterns in the adenocarcinoma and normal glands adjacent to the cancerous lesions after ADT. Intriguingly, a strong induction of both slug and ephrin‐B1 expression was observed in the adenocarcinoma cells after ADT (7 of 12 high‐grade cases), while ADT did not induce expression of slug or ephrin‐B1 in most healthy prostate tissues (11 of 12 cases). Higher magnification view of the high‐grade prostate cancer sample after ADT showed that slug and ephrin‐B1 are preferentially accumulated in the cytoplasm. This observation is consistent with previous reports on the cytoplasmic expression of slug and ephrin‐B1 in various cancers with poor prognosis.28, 38, 39, 40 Furthermore, the expression of ephrin‐B1 was induced in the cells expressing an endogenous marker of prolonged chronic hypoxia, carbonic anhydrase IX (CAIX)41, 42 in adenocarcinoma tissues after ADT (Figure 7B). This suggests that coexpression of slug and ephrin‐B1 is markedly induced in human prostate adenocarcinoma cells under the chronic hypoxic conditions caused by androgen deprivation.
Figure 7.
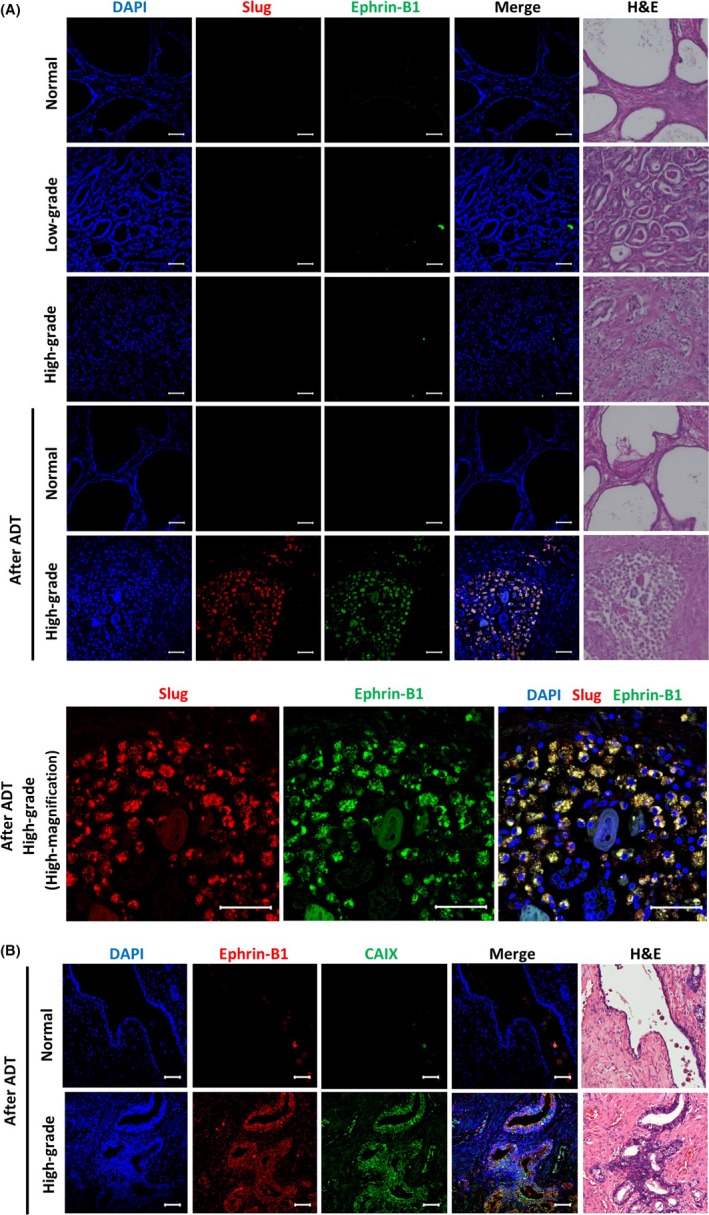
Slug and ephrin‐B1 are coexpressed at a high level in human prostate adenocarcinoma cells after androgen deprivation therapy (ADT). A, Immunofluorescence of healthy and adenocarcinoma prostate tissues shows red staining for slug, green staining for ephrin‐B1, and yellow fluorescence in the merged pictures for coexpression of slug and ephrin‐B1. The tissues were counterstained with H&E and with DAPI. Representative immunofluorescence images of normal prostate tissues, low‐grade and high‐grade prostate adenocarcinomas, adenocarcinoma tissues and normal tissues adjacent to the cancerous region after ADT. Scale bar, 50 μm. B, Immunofluorescence of high‐grade prostate adenocarcinoma tissues and normal tissues adjacent to the cancerous region after ADT shows red staining for ephrin‐B1, green staining for carbonic anhydrase IX (CAIX), and yellow fluorescence in the merged pictures for coexpression of ephrin‐B1 and CAIX. Scale bars, 50 μm
4. DISCUSSION
Solid tumors are exposed to hypoxic conditions over longer periods of time as they grow.11, 12 The hypoxic condition contributes to the acquisition of the malignant phenotype including cell invasive behavior, but the effects of hypoxia on malignant progression have been mainly studied using tumor cells cultured under acute hypoxic conditions.13, 14, 15, 16, 17 In this study, we demonstrated that chronic hypoxia promotes prostate cancer cell migration and invasion by upregulating the expression of an EMT‐driving transcription factor, slug. Slug is widely known to work as a direct E‐cadherin repressor,36, 37 and its dysregulated expression correlates with poor clinical outcome in various types of cancers.43, 44, 45, 46 We found that prostate cancer cells under chronic hypoxia shows neither loss of E‐cadherin expression nor induction of mesenchymal markers; instead, expression of ephrin‐B1 is markedly induced by slug and promotes cell migration and invasion.
Mechanisms through which slug is upregulated under chronic hypoxia and slug‐overexpressing cells survive under chronic hypoxia by evading apoptosis have not been elucidated. Huang et al demonstrated that slug expression is activated by acute hypoxia‐induced HIF‐1α.20 Indeed, our genome‐wide expression profiling showed that the expression of HIF‐1α is elevated under acute hypoxia, but it decreases to that observed under normoxia in the chronic hypoxic condition (unpublished data). Therefore, we speculate that upregulation of slug under chronic hypoxia may be controlled by transcription factors specifically induced under chronic hypoxia, rather than directly and solely by HIF‐1α. We have found that knockdown of slug in the LNCaP/CH6M cells decreases the expression of a mitochondrial antioxidant, peroxiredoxin‐3 (Prdx3), suggesting that Prdx3 expression is upregulated by chronic hypoxia‐induced slug (unpublished data). Overexpression of peroxiredoxins including Prdx3 has been reported in various cancers.47 Furthermore, increased expression of Prdx3 has been known to protect cells from hypoxia‐induced apoptosis.48 Thus, it is presumed that overexpression of Prdx3 activated by chronic hypoxia‐induced slug could confer anti‐apoptotic properties to prostate cancer cells under chronic hypoxia.
Given that the growth of prostate cancer cells depends on androgens and androgen receptor (AR) signaling, ADT is widely used for the treatment of locally advanced and metastatic disease. ADT initially controls the growth of androgen‐dependent tumors, but eventually the majority of these tumors progress to more aggressive and metastatic castration‐resistant tumors.49, 50 Docetaxel has been used as the standard chemotherapeutic drug for metastatic castration‐resistant cancers, but resistance eventually occurs through a number of mechanisms, including activation of prosurvival signaling, increased drug‐efflux, and overexpression of β‐tubulin isoforms and inflammation‐associated molecules.51, 52 Although many novel agents designed to overcome chemoresistance are currently under development, the prognosis of castration‐resistant cancers remains poor.53 It is noteworthy that ephrin‐B1 expression is strongly induced after ADT of prostate adenocarcinoma cells and, perhaps more importantly, ADT does not induce ephrin‐B1 expression in normal tissue adjacent to the cancerous region. This suggests that ephrin‐B1 may be a novel promising therapeutic target with a low risk of local toxicity in healthy tissue, in combination with ADT or as adjuvant treatment after ADT for aggressive prostate cancers.
CONFLICT OF INTEREST
The authors declare no conflicts of interest.
Supporting information
ACKNOWLEDGMENTS
We thank Professor Homma for the plasmid, Drs Mayumi Hamada and Stephen Forster for helpful discussion, and Ms Mami Kimoto for technical assistance. This work was supported by the Discretion of the President of Oita University.
Iwasaki K, Ninomiya R, Shin T, et al. Chronic hypoxia‐induced slug promotes invasive behavior of prostate cancer cells by activating expression of ephrin‐B1. Cancer Sci. 2018;109:3159–3170. 10.1111/cas.13754
REFERENCES
- 1. Gupta GP, Massagué J. Cancer metastasis: building a framework. Cell. 2006;127:679‐695. [DOI] [PubMed] [Google Scholar]
- 2. Valastyan S, Weinberg RA. Tumor metastasis: molecular insights and evolving paradigms. Cell. 2011;147:275‐292. [DOI] [PMC free article] [PubMed] [Google Scholar]
- 3. Friedl P, Alexander S. Cancer invasion and the microenvironment: plasticity and reciprocity. Cell. 2011;147:992‐1009. [DOI] [PubMed] [Google Scholar]
- 4. Thiery JP, Acloque H, Huang RY, et al. Epithelial‐mesenchymal transitions in development and disease. Cell. 2009;139:871‐890. [DOI] [PubMed] [Google Scholar]
- 5. Lim J, Thiery JP. Epithelial‐mesenchymal transitions: insights from development. Development. 2012;139:3471‐3486. [DOI] [PubMed] [Google Scholar]
- 6. Talbot LJ, Bhattacharya SD, Kuo PC. Epithelial‐mesenchymal transition, the tumor microenvironment, and metastatic behavior of epithelial malignancies. Int J Biochem Mol Biol. 2012;3:117‐136. [PMC free article] [PubMed] [Google Scholar]
- 7. Yang J, Mani SA, Donaher JL, et al. Twist, a master regulator of morphogenesis, plays an essential role in tumor metastasis. Cell. 2004;117:927‐939. [DOI] [PubMed] [Google Scholar]
- 8. Herzig M, Savarese F, Novatchkova M, et al. Tumor progression induced by the loss of E‐cadherin independent of beta‐catenin/Tcf‐mediated Wnt signaling. Oncogene. 2007;26:2290‐2298. [DOI] [PubMed] [Google Scholar]
- 9. Lamouille S, Xu J, Derynck R. Molecular mechanisms of epithelial‐mesenchymal transition. Nat Rev Mol Cell Biol. 2014;15:178‐196. [DOI] [PMC free article] [PubMed] [Google Scholar]
- 10. Haass NK, Smalley KS, Herlyn M. The role of altered cell‐cell communication in melanoma progression. J Mol Histol. 2004;35:309‐318. [DOI] [PubMed] [Google Scholar]
- 11. Brown JM, Wilson WR. Exploiting tumour hypoxia in cancer treatment. Nat Rev Cancer. 2004;4:437‐447. [DOI] [PubMed] [Google Scholar]
- 12. Vaupel P, Mayer A. Hypoxia in cancer: significance and impact on clinical outcome. Cancer Metastasis Rev. 2007;26:225‐239. [DOI] [PubMed] [Google Scholar]
- 13. Brizel DM, Sibley GS, Prosnitz LR, et al. Tumor hypoxia adversely affects the prognosis of carcinoma of the head and neck. Int J Radiat Oncol Biol Phys. 1997;38:285‐289. [DOI] [PubMed] [Google Scholar]
- 14. Hockel M, Schlenger K, Aral B, et al. Association between tumor hypoxia and malignant progression in advanced cancer of the uterine cervix. Cancer Res. 1996;56:4509‐4515. [PubMed] [Google Scholar]
- 15. Lartigau E, Randrianarivelo H, Avril MF, et al. Intratumoral oxygen tension in metastatic melanoma. Melanoma Res. 1997;7:400‐406. [DOI] [PubMed] [Google Scholar]
- 16. Movsas B, Chapman JD, Greenberg RE, et al. Increasing levels of hypoxia in prostate carcinoma correlate significantly with increasing clinical stage and patient age: an Eppendorf pO(2) study. Cancer. 2000;89:2018‐2024. [DOI] [PubMed] [Google Scholar]
- 17. Movsas B, Chapman JD, Horwitz EM, et al. Hypoxic regions exist in human prostate carcinoma. Urology. 1999;53:11‐18. [DOI] [PubMed] [Google Scholar]
- 18. Yang MH, Wu MZ, Chiou SH, et al. Direct regulation of TWIST by HIF‐1alpha promotes metastasis. Nat Cell Biol. 2008;10:295‐305. [DOI] [PubMed] [Google Scholar]
- 19. Zhang L, Huang G, Li X, et al. Hypoxia induces epithelial‐mesenchymal transition via activation of SNAI1 by hypoxia‐inducible factor‐1alpha in hepatocellular carcinoma. BMC Cancer. 2013;13:108. [DOI] [PMC free article] [PubMed] [Google Scholar]
- 20. Huang CH, Yang WH, Chang SY, et al. Regulation of membrane‐type 4 matrix metalloproteinase by SLUG contributes to hypoxia‐mediated metastasis. Neoplasia. 2009;11:1371‐1382. [DOI] [PMC free article] [PubMed] [Google Scholar]
- 21. Yamasaki M, Nomura T, Sato F, et al. Chronic hypoxia induces androgen‐independent and invasive behavior in LNCaP human prostate cancer cells. Urol Oncol. 2013;31:1124‐1131. [DOI] [PubMed] [Google Scholar]
- 22. Nomura T, Yamasaki M, Hirai K, et al. Targeting the Vav3 oncogene enhances docetaxel‐induced apoptosis through the inhibition of androgen receptor phosphorylation in LNCaP prostate cancer cells under chronic hypoxia. Mol Cancer. 2013;12:27. [DOI] [PMC free article] [PubMed] [Google Scholar]
- 23. Hirai K, Nomura T, Yamasaki M, et al. The Vav3 oncogene enhances the malignant potential of prostate cancer cells under chronic hypoxia. Urol Oncol. 2014;32:101‐109. [DOI] [PubMed] [Google Scholar]
- 24. Byrne NM, Nesbitt H, Ming L, et al. Androgen deprivation in LNCaP prostate tumour xenografts induces vascular changes and hypoxic stress, resulting in promotion of epithelial‐to‐mesenchymal transition. Br J Cancer. 2016;114:659‐668. [DOI] [PMC free article] [PubMed] [Google Scholar]
- 25. Ming L, Byrne NM, Camac SN, et al. Androgen deprivation results in time‐dependent hypoxia in LNCaP prostate tumours: informed scheduling of the bioreductive drug AQ4N improves treatment response. Int J Cancer. 2013;132:1323‐1332. [DOI] [PubMed] [Google Scholar]
- 26. Kitamura T, Kabuyama Y, Kamataki A, et al. Enhancement of lymphocyte migration and cytokine production by ephrinB1 system in rheumatoid arthritis. Am J Physiol Cell Physiol. 2008;294:C189‐C196. [DOI] [PubMed] [Google Scholar]
- 27. Kataoka H, Tanaka M, Kanamori M, et al. Expression profile of EFNB1, EFNB2, two ligands of EPHB2 in human gastric cancer. J Cancer Res Clin Oncol. 2002;128:343‐348. [DOI] [PubMed] [Google Scholar]
- 28. Varelias A, Koblar SA, Cowled PA, et al. Human osteosarcoma express specific ephrin profiles: implications for tumorigenicity and prognosis. Cancer. 2002;95:862‐869. [DOI] [PubMed] [Google Scholar]
- 29. Meyer S, Hafner C, Guba M, et al. Ephrin‐B2 overexpression enhances integrin‐mediated ECM‐attachment and migration of B16 melanoma cells. Int J Oncol. 2005;27:1197‐1206. [PubMed] [Google Scholar]
- 30. Ashley GR, Grace OC, Vanpoucke G, et al. Identification of EphrinB1 expression in prostatic mesenchyme and a role for EphB‐EphrinB signalling in prostate development. Differentiation. 2010;80:89‐98. [DOI] [PubMed] [Google Scholar]
- 31. Coulthard MG, Morgan M, Woodruff TM, et al. Eph/Ephrin signaling in injury and inflammation. Am J Pathol. 2012;181:1493‐1503. [DOI] [PubMed] [Google Scholar]
- 32. Wels C, Joshi S, Koefinger P, et al. Transcriptional activation of ZEB1 by Slug leads to cooperative regulation of the epithelial‐mesenchymal transition‐like phenotype in melanoma. J Invest Dermatol. 2011;131:1877‐1885. [DOI] [PMC free article] [PubMed] [Google Scholar]
- 33. Uygur B, Wu WS. SLUG promotes prostate cancer cell migration and invasion via CXCR4/CXCL12 axis. Mol Cancer. 2011;10:139. [DOI] [PMC free article] [PubMed] [Google Scholar]
- 34. Moreno‐Bueno G, Cubillo E, Sarrio D, et al. Genetic profiling of epithelial cells expressing E‐cadherin repressors reveals a distinct role for snail, slug, and E47 factors in epithelial‐mesenchymal transition. Cancer Res. 2006;66:9543‐9556. [DOI] [PubMed] [Google Scholar]
- 35. Martinez‐Estrada OM, Culleres A, Soriano FX, et al. The transcription factors slug and snail act as repressors of claudin‐1 expression in epithelial cells. Biochem J. 2006;394:449‐457. [DOI] [PMC free article] [PubMed] [Google Scholar]
- 36. Bolos V, Peinado H, Perez‐Moreno MA, et al. The transcription factor slug represses E‐cadherin expression and induces epithelial to mesenchymal transitions: a comparison with snail and E47 repressors. J Cell Sci. 2003;116:499‐511. [DOI] [PubMed] [Google Scholar]
- 37. Hajra KM, Chen DY, Fearon ER. The SLUG zinc‐finger protein represses E‐cadherin in breast cancer. Cancer Res. 2002;62:1613‐1618. [PubMed] [Google Scholar]
- 38. Luanpitpong S, Li J, Manke A, et al. SLUG is required for SOX9 stabilization and functions to promote cancer stem cells and metastasis in human lung carcinoma. Oncogene. 2016;35:2824‐2833. [DOI] [PMC free article] [PubMed] [Google Scholar]
- 39. Hasan MR, Sharma R, Saraya A, et al. Slug is a predictor of poor prognosis in esophageal squamous cell carcinoma patients. PLoS ONE. 2013;8:e82846. [DOI] [PMC free article] [PubMed] [Google Scholar]
- 40. Sawai Y, Tamura S, Fukui K, et al. Expression of ephrin‐B1 in hepatocellular carcinoma: possible involvement in neovascularization. J Hepatol.2003;39:991‐996. [DOI] [PubMed] [Google Scholar]
- 41. Vordermark D, Kaffer A, Riedl S, et al. Characterization of carbonic anhydrase IX (CA IX) as an endogenous marker of chronic hypoxia in live human tumor cells. Int J Radiat Oncol Biol Phys. 2005;61:1197‐1207. [DOI] [PubMed] [Google Scholar]
- 42. Rademakers SE, Lok J, van der Kogel AJ, et al. Metabolic markers in relation to hypoxia; staining patterns and colocalization of pimonidazole, HIF‐1α, CAIX, LDH‐5, GLUT‐1, MCT1 and MCT4. BMC Cancer. 2011;11:167. [DOI] [PMC free article] [PubMed] [Google Scholar]
- 43. Shih JY, Tsai MF, Chang TH, et al. Transcription repressor slug promotes carcinoma invasion and predicts outcome of patients with lung adenocarcinoma. Clin Cancer Res. 2005;11:8070‐8078. [DOI] [PubMed] [Google Scholar]
- 44. Liu T, Zhang X, Shang M, et al. Dysregulated expression of Slug, vimentin, and E‐cadherin correlates with poor clinical outcome in patients with basal‐like breast cancer. J Surg Oncol. 2013;107:188‐194. [DOI] [PubMed] [Google Scholar]
- 45. Merikallio H, Turpeenniemi‐HujanenT T, Pääkkö P, et al. Slug is associated with poor survival in squamous cell carcinoma of the lung. Int J Clin Exp Pathol. 2014;7:5846‐5854. [PMC free article] [PubMed] [Google Scholar]
- 46. Shioiri M, Shida T, Koda K, et al. Slug expression is an independent prognostic parameter for poor survival in colorectal carcinoma patients. Br J Cancer. 2006;94:1816‐1822. [DOI] [PMC free article] [PubMed] [Google Scholar]
- 47. Hanschmann EM, Godoy JR, Berndt C, et al.Thioredoxins, glutaredoxins, and peroxiredoxins–molecular mechanisms and health significance: from cofactors to antioxidants to redox signaling. Antioxid Redox Signal. 2013;19:1539‐1605. [DOI] [PMC free article] [PubMed] [Google Scholar]
- 48. Nonn L, Berggren M, Powis G. Increased expression of mitochondrial peroxiredoxin‐3 (thioredoxin peroxidase‐2) protects cancer cells against hypoxia and drug‐induced hydrogen peroxide‐dependent apoptosis. Mol Cancer Res. 2003;1:682‐689. [PubMed] [Google Scholar]
- 49. Nakazawa M, Paller C, Kyprianou N. Mechanisms of therapeutic resistance in prostate cancer. Curr Oncol Rep. 2017;19:13. [DOI] [PMC free article] [PubMed] [Google Scholar]
- 50. Kumar SS, Pacey S. The role of chemotherapy and new targeted agents in the management of primary prostate cancer. J Clin Urol. 2017;9(2 suppl):30‐37. [DOI] [PMC free article] [PubMed] [Google Scholar]
- 51. Armstrong CM, Gao AC. Drug resistance in castration resistant prostate cancer: resistance mechanisms and emerging treatment strategies.Am J Clin Exp Urol. 2015;3:64‐76. [PMC free article] [PubMed] [Google Scholar]
- 52. Chandrasekar T, Yang JC, Gao AC, et al. Mechanisms of resistance in castration‐resistant prostate cancer (CRPC). Transl Androl Urol.2015;4:365‐380. [DOI] [PMC free article] [PubMed] [Google Scholar]
- 53. Lohiya V, Aragon‐Ching JB, Sonpavde G. Role of chemotherapy and mechanisms of resistance to chemotherapy in metastatic castration‐resistant prostate cancer. Clin Med Insights Oncol. 2016;10(suppl 1):57‐66. [DOI] [PMC free article] [PubMed] [Google Scholar]
Associated Data
This section collects any data citations, data availability statements, or supplementary materials included in this article.
Supplementary Materials