Abstract
Clear cell renal cell carcinoma (ccRCC) is one of the most common malignant carcinomas and its molecular mechanisms remain unclear. Long noncoding RNA (lncRNA) could bind sites of miRNA which affect the expression of mRNA according to the competing endogenous (ceRNA) theory. The aim of the present study was to construct a ceRNA network and to identify key lncRNA to predict survival prognosis. We identified differentially expressed mRNA, lncRNA and miRNA between tumor tissues and normal tissues from The Cancer Genome Atlas database. Then, using bioinformatics tools, we explored the connection of 89 lncRNA, 10 miRNA and 22 mRNA, and we constructed the ceRNA network. Furthermore, we analyzed the functions and pathways of 22 differentially expressed mRNA. Then, univariate and multivariate Cox regression analyses of these 89 lncRNA and overall survival were explored. Nine lncRNA were finally screened out in the training group. The patients were divided into high‐risk and low‐risk groups according to the 9 lncRNA and low‐risk scores having better clinical overall survival (P < .01). Furthermore, the receiver operating characteristic curve demonstrates the predicted role of the 9 lncRNA. The 9‐lncRNA signature was successfully proved in the testing group and the entire group. Finally, multivariate Cox regression analysis and stratification analysis further proved that the 9‐lncRNA signature was an independent factor to predict survival. In summary, the present study provides a deeper understanding of the lncRNA‐related ceRNA network in ccRCC and suggests that the 9‐lncRNA signature could serve as an independent biomarker to predict survival in ccRCC patients.
Keywords: biomarker, competing endogenous RNA network, long non‐coding RNA, renal cell carcinoma, The Cancer Genome Atlas
1. INTRODUCTION
Renal cancer is one of the most common malignant cancers.1 Despite the continuous progress in medical treatment, the incidence of the disease has increased year by year.2 There are many types of renal cancer according to histopathologic and cell features. Among them, clear cell renal cell carcinoma (ccRCC) is the most common type.3 The main and most effective treatment for ccRCC is radical nephrectomy. However, 30% of patients experience recurrence and advanced stage reduces the likelihood of survival.4 Moreover, regional or distant metastases leads to a high rate of death.5 Furthermore, ccRCC is resistant to chemotherapy and radiation therapy, so there is an urgent need to better understand the molecular mechanisms of the disease to find a new target for treatment.
Long noncoding RNA (lncRNA) are a subtype of non‐coding RNA (ncRNA) with no protein‐coding function. LncRNA are 200 nucleotides to 100 kb in length and regulate the expression of target genes transcriptionally and post‐transcriptionally.6 The expression of lncRNA is different in tumors compared with normal tissues and plays a key role in the development of cancers.7 Furthermore, lncRNA could be used as early diagnosis and prognosis cancer biomarkers due to their stronger tissue specificity.8 For example, in lung adenocarcinoma, lncRNA could be biomarkers for diagnosis and prognosis.9 MicroRNA (miRNA) are a class of small, single‐stranded, endogenous non‐coding RNA consisting of 19‐25 nucleotides that interact with the 3′‐untranslated region of the mRNA of target genes to promote mRNA degradation and/or inhibit protein translation.10, 11 Abnormal expression of miRNA can regulate the biological process by activating or inhibiting oncogenic genes, tumor suppressor genes or target proteins.12, 13
Several recently published studies report that lncRNA can have the effect of sponging miRNA, which weakens the impact of miRNA on mRNA according to the theories about RNA regulation by competitive endogenous RNA (ceRNA).14, 15 The primary theory is that RNA could interact with miRNA response elements (MRE).16 Then, different genes compete for the identical miRNA, which forms a complex network of RNA regulation, thus affecting pathway and function.17 In a study of hepatocellular cell carcinoma, Zhang explored lncRNA profiles and constructed an lncRNA‐miRNA‐mRNA network.18 In addition, Xue et al constructed a ceRNA network of esophageal cancer.19 In papillary renal cell carcinoma, a ceRNA network was also constructed.20 However, studies of large‐scale samples and microarray detection in ccRCC are still rare and the relationship between lncRNA and prognosis is unclear and urgently needs to be defined. Therefore, the construction of a ceRNA network has an important role in therapeutic decisions, prognosis prediction and therapeutic targeting to improve the overall survival of ccRCC patients.
In the present study, we obtained the lncRNA, miRNA and mRNA expression profiles of ccRCC normal tissue and tumor tissue from The Cancer Genome Atlas (TCGA). Furthermore, an lncRNA‐miRNA‐mRNA ceRNA network was constructed for ccRCC through integrated analysis, which can help in finding new targets and pathways to improve survival for patients. Finally, we put significant lncRNA into a prognosis analysis and found biomarkers to predict survival in ccRCC.
2. MATERIALS AND METHODS
2.1. Data collection
The clinical data for age, sex and TNM stage were obtained from the TCGA database (2018.04.01). The exclusion criteria were that: (i) the histological diagnosis was not ccRCC; and (ii) there was not enough information for clinical characteristics (including age, gender, stage, survival status and survival time). Altogether, there were 519 ccRCC patients enrolled in the study. The numbers of stage I, II, III and IV patients were 263, 55, 119 and 82, respectively. In addition, 17 patients had received neoadjuvant treatment; the others had not. The number of patients aged <62 years was 277, and the other 242 patients were ≥62 years old. A total of 335 patients were male, and the other 184 patients were female. The number of ccRCC with tumor grades 1, 2, 3 and 4 were 14 (2.7%), 225 (43.4%), 206 (39.7%) and 74 (14.3%), respectively. Furthermore, the numbers of patients who were Asian, black or African American, white and not available were 8, 52, 452 and 7, respectively. Level 3 RNA expression data were collected from the TCGA Data Portal and normalized.21
2.2. Explore the differentially expressed genes
The RNA sequencing (RNA‐Seq) data were derived from the TCGA data portal. There are 539 ccRCC tumor tissues and 72 adjacent normal tissues with available mRNASeq and lncRNASeq. Furthermore, there are 545 ccRCC tumor tissues and 71 adjacent normal tissues with available miRNASeq. We used the R and Bioconductor package of edgeR to explore the significantly differentially expressed mRNA (DEmiRNA), lncRNA (DElncRNA) and miRNA (DEmRNA) between cancer tissues and normal tissues.22 The genes that were not registered in GENCODE were abandoned to maximize data reliability. The cut‐off value was |log2FC| > 2 and FDR < .01 (FC, fold change; FDR, false discovery rate).
2.3. Construct the competitive endogenous RNA network
We constructed the network based on the network among lncRNA, miRNA and mRNA. The interaction between lncRNA and miRNA or mRNA and miRNA could be predicted. Therefore, we used miRcode (http://www.mircode.org/) to predict lncRNA and miRNA interactions. Then, miRDB (http://www.mirdb.org/), TargetScan (http://www.targetscan.org/vert_71/) and miRanda (http://www.targetscan.org/vert/) databases were used to predict miRNA and mRNA interactions. The interactions of results were used to construct the lncRNA‐miRNA‐mRNA network applying the Cytoscape software.23
2.4. Function and pathway enrichment
To better understand the underlying function of aberrantly expressed genes, the gene ontology (GO) was needed. Therefore, we used the Database for Annotation Visualization and Integrated Discovery 6.8 (DAVID) (https://david.ncifcrf.gov/) to perform the functional analyses.24 Then, we used KOBAS 3.0 (http://kobas.cbi.pku.edu.cn/anno_iden.php) to construct Kyoto Encyclopedia of Genes and Genomes (KEGG) pathways.25
2.5. Identification and selection of prognosis‐related lncRNA in the training set
All 519 patients were randomly grouped into a training set (n = 259) and a testing set (n = 260; as shown in Table 1). We used the univariate Cox proportional hazards regression to explore the differentially expressed lncRNA and estimated the expression of lncRNA with overall survival (OS) by R with the survival package. Then, we identified some lncRNA whose expression is significantly correlated with OS in univariate Cox proportional hazards regression analysis, which were used for multivariate analysis. We calculated the prognostic risk score as explncRNA1 * βlncRNA1 + explncRNA2 * βlncRNA2 + explncRNAn * βlncRNAn (exp, expression level, β, the regression coefficient derived from the multivariate Cox regression model).26 The median risk score was 1.087797. All the patients were divided into low‐risk and high‐risk groups based on the median risk score. Kaplan‐Meier survival curves were further used to calculate the OS of the different risk groups. A time‐dependent receiver operating characteristic (ROC) curve analysis with 5 years as the defining point was performed with the R package “survival‐ROC” to evaluate the predictive value of the risk score.27
Table 1.
519 clear cell renal cell carcinoma patient characteristics and clinical data
| Characteristics | Entire dataset N (%) | Training dataset N (%) | Testing dataset N (%) | P |
|---|---|---|---|---|
| N | 519 | 259 (49.9) | 260 (50.1) | |
| Age (year) (mean ± SD) | 61.03 ± 12.17 | |||
| <62 | 277 (53.4) | 141 (54.4) | 136 (52.3) | .626 |
| ≧62 | 242 (46.6) | 118 (45.6) | 124 (47.7) | |
| Sex | ||||
| Male | 335 (64.5) | 167 (64.5) | 168 (64.6) | .974 |
| Female | 184 (35.5) | 92 (35.5) | 92 (33.4) | |
| Race | ||||
| Asian | 8 (1.5) | 3 (1.2) | 5 (1.9) | .704 |
| Black or African American | 52 (10.0) | 28 (10.8) | 24 (9.2) | |
| White | 452 (87.1) | 223 (86.1) | 229 (88.1) | |
| Not available | 7 (1.3) | 5 (1.9) | 2 (1) | |
| Neoadjuvant treatment | ||||
| Yes | 17 (3.3) | 6 (2.3) | 11 (4) | .221 |
| No | 502 (96.7) | 253 (97.7) | 249 (95.8) | |
| Tumor grade | ||||
| 1 | 14 (2.7) | 8 (3.1) | 6 (2.3) | .917 |
| 2 | 225 (43.4) | 117 (45.2) | 108 (41.5) | |
| 3 | 206 (39.7) | 97 (37.5) | 99 (38.1) | |
| 4 | 74 (14.3) | 37 (14.3) | 37 (14.2) | |
| Tumor stage | ||||
| I | 263 (50.7) | 133 (51.4) | 130 (50) | .45 |
| II | 55 (10.6) | 22 (8.5) | 33 (12.7) | |
| III | 119 (22.9) | 63 (24.3) | 56 (21.5) | |
| IV | 82 (15.8) | 41 (15.8) | 41 (15.8) | |
2.6. The prognostic lncRNA in the testing and the entire dataset
The prognostic lncRNA in the training set were further explored in the testing and entire dataset. Patients were also divided into high‐risk and low‐risk groups according to the risk score. The ROC curve and survival were analyzed in the 2 datasets.
2.7. The prognostic factors of clinical features
We carried out the univariate Cox regression analysis between clinical features (age, gender, race, neoadjuvant treatment, the histologic grade, the pathologic stage and the risk) and OS using SPSS 22.0 software. The significant value was further explored in the multivariate Cox regression analysis.
2.8. Statistical analysis
An unpaired t test was used to identify differentially expressed genes between tumor tissues and normal tissues. To further identify the gene associated‐competing endogenous RNA, we combined the clinical data of ccRCC patients. The survival package in R was used to plot the survival curves.
3. RESULTS
3.1. Clinical characteristics of clear cell renal cell carcinoma patients
There were 519 tumor patients enrolled in the study. The mean age of all the patients was 61.03 ± 12.17. The number of patients aged <62 years was 277, and the other 242 patients were ≥62 years old. A total of 335 patients were male, and the other 184 patients were female. The number of ccRCC with tumor grades 1, 2, 3 and 4 were 14 (2.7%), 225 (43.4%), 206 (39.7%) and 74 (14.3%), respectively. A total of 17 patients underwent neoadjuvant therapy; the others did not. In addition, the number of tumors of TNM stage I, II, III and IV were 263 (50.7%), 55 (10.6%), 119 (22.9%) and 82 (15.8%), respectively. All the patients were randomly divided into the training set and the testing set. There was no correlation between the 2 groups (P > .05). The results are listed in Table 1.
3.2. Differentially expressed lncRNA, miRNA and mRNA
The differential expression (DE) of mRNA and lncRNA between tumor tissues and normal tissues was explored. Absolute fold change >2 and FDR value <.01 of genes were considered as discriminatively expressed. The analysis identified 2331 mRNA (1569 elevated and 762 downregulated; Figure 1A) and 1518 lncRNA (1059 elevated and 459 downregulated; Figure 1B). Filtering analysis with the above criteria (absolute fold change >2 and FDR value <.01) identified 54 miRNA (33 elevated and 21 downregulated; Figure 1C) between normal tissues and cancer tissues. The results suggested that the expression of these genes can distinguish ccRCC from normal tissues.
Figure 1.
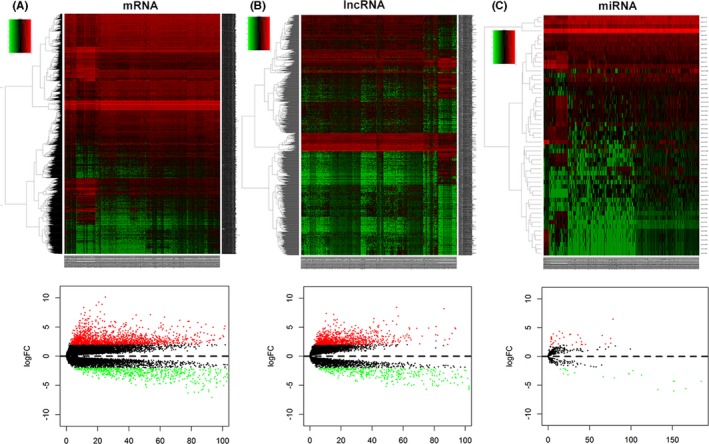
Heatmap and volcano map of the differential expression of genes in clear cell renal cell carcinoma (ccRCC) between 519 tumor tissues and 72 normal tissues. Ascending normalized expression level is colored from green to red. A, mRNA; B, lncRNA; C, miRNA
3.3. Competitive endogenous RNA network in clear cell renal cell carcinoma
Next, the potential interactions among the above genes were predicted according to the ceRNA hypothesis. A total of 89 DElncRNA were predicted to interact with 10 DEmiRNA by miRcode online tools (Table S1). Furthermore, we combined miRDB, TargetScan and miRanda to predict the candidate mRNA targets of DEmiRNA (Table 2). The 22 target DEmRNA that were also involved in the 2331 differential mRNA were enrolled in the ceRNA network (Figure 2). In total, there were 89 DElncRNA, 10 DEmiRNA and 22 DEmRNA in the ceRNA network. Furthermore, Cytoscape software was used to construct the interactions among DElncRNA, DEmiRNA and DEmRNA (Figure 3).
Table 2.
MiRNA that may target mRNA in clear cell renal cell carcinoma
| miRNA | mRNA |
|---|---|
| miR‐200c | NTRK2,NOG,LRP1B,GATA4,ERMP1,VEGFA |
| miR‐122 | GALNT3 |
| miR‐155 | PCDH9,GPM6B,ITK,ZNF98,TYRP1,CD36,ZIC3,SPI1,ERMP1 |
| miR‐216b | COL4A4 |
| miR‐506 | SLC16A1,VIM |
| miR‐141 | PRELID2 |
| miR‐21 | CCL20,TGFBI,FASLG |
Figure 2.
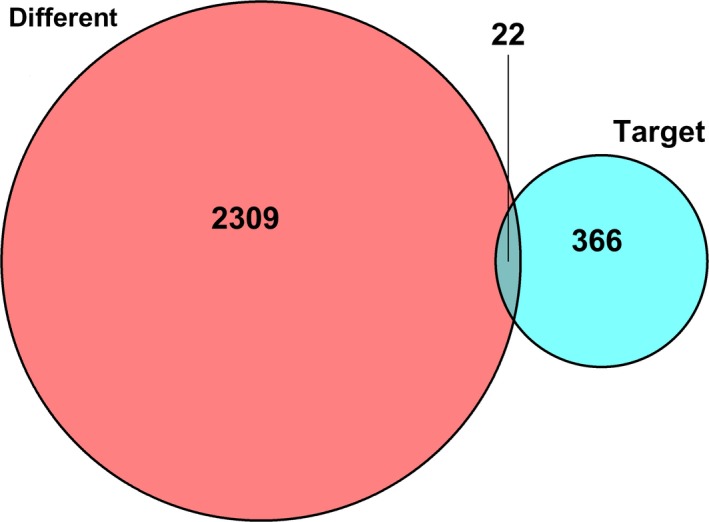
The 22 target DEmRNA that were also involved in the 2331 different mRNA were enrolled in the ceRNA network
Figure 3.
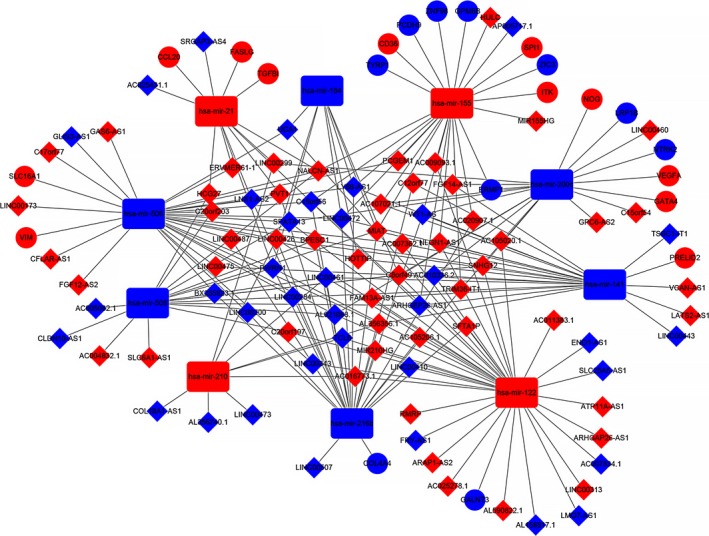
The lncRNA‐miRNA‐mRNA ceRNA network. The blue diamonds are downregulated lncRNA and the red diamonds are upregulated lncRNA. The blue rectangles are downregulated miRNA and the red rectangles are upregulated miRNA. The blue balls are downregulated mRNA and the red balls are upregulated mRNA
3.4. DEmRNA in the competitive endogenous RNA network
The functions and KEGG pathways of 22 DEmRNA in the ceRNA network were analyzed with DAVID and KOBAS. The results showed 4 GO terms (P < .01) and 13 KEGG pathways (corrected P‐value < .05). The results of GO terms are shown in Table 3 and Figure 4. The KEGG pathways of DEmRNA are shown in Table 4. Furthermore, we imported the above data into Cytoscape to calculate the characteristics of the network (Figure 5). Next, the relationship between the 22 DEmRNA and OS was also explored. The results showed that patients with high expression of COL4A4, ERMP1 and PRELID2 had a better OS (P < .05). In addition, patients with low expression of NOG, SPI1, TGFβ1, TYRP1 and VIM had better OS (P < .05; Figure 6).
Table 3.
GO terms of DEmRNA in clear cell renal cell carcinoma
| ID | Term | Genes | Count | P |
|---|---|---|---|---|
| GO:0035019 | Stem cell population maintenance | NOG, SPI1, ZIC3 | 3 | .002954723 |
| GO:0010628 | Positive regulation of gene expression | NOG, VIM, VEGFA, NTRK2 | 4 | .004056413 |
| GO:0051525 | NFAT protein binding | GATA4, SPI1 | 2 | .005910498 |
| GO:0042803 | Protein homodimerization activity | SLC16A1, TYRP1, NOG, VEGFA, NTRK2 | 5 | .009660452 |
Figure 4.
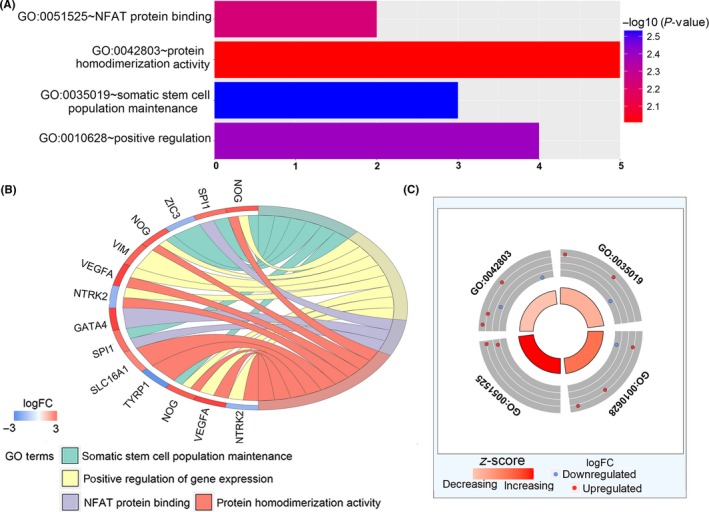
The functions of DEmRNA in the ceRNA network were analyzed with DAVID. A, GO enrichment significance items of DEmRNA in different functional groups. B and C, Distribution of DEmRNA in clear cell renal cell carcinoma (ccRCC) for different GO‐enriched functions. DEmRNA, differentially expressed mRNA; GO, gene ontology
Table 4.
KEGG pathway of DEmRNA in clear cell renal cell carcinoma
| ID | Term | Genes | Count | Corrected P‐value |
|---|---|---|---|---|
| hsa05200 | Pathways in cancer | COL4A4,VEGFA,SPI1,FASLG | 4 | .00405917615921 |
| hsa04060 | Cytokine‐cytokine receptor interaction | CCL20,VEGFA,FASLG | 3 | .0133388641347 |
| hsa04151 | PI3K‐Akt signaling pathway | VEGFA,COL4A4,FASLG | 3 | .005910498 |
| hsa04512 | ECM‐receptor interaction | COL4A4,CD36 | 2 | .009660452 |
| hsa05323 | Rheumatoid arthritis | CCL20,VEGFA | 2 | .015264 |
| hsa04933 | AGE‐RAGE signaling pathway in diabetic complications | COL4A4,VEGFA | 2 | .015566 |
| hsa04722 | Neurotrophin signaling pathway | NTRK2,FASLG | 2 | .018629 |
| hsa04062 | Chemokine signaling pathway | CCL20,ITK | 2 | .033286 |
| hsa04510 | Focal adhesion | COL4A4,VEGFA | 2 | .033286 |
| hsa05169 | Epstein‐Barr virus infection | SPI1,VIM | 2 | .033286 |
| hsa05205 | Proteoglycans in cancer | FASLG,VEGFA | 2 | .033286 |
| hsa04014 | Ras signaling pathway | FASLG,VEGFA | 2 | .0374 |
| hsa04010 | MAPK signaling pathway | FASLG,NTRK2 | 2 | .042737 |
Figure 5.
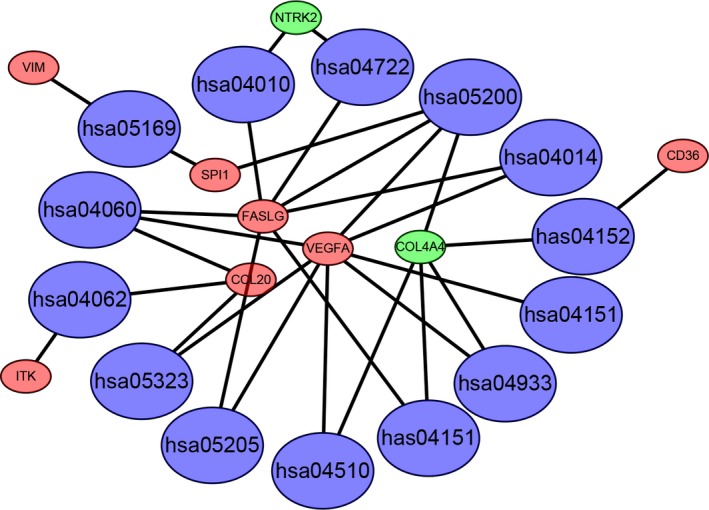
Signifcant pathway enrichment of DEmRNA. Red represents the upregulated DEmRNA. Green represents the downregulated DEmRNA. Blue represents signaling pathway. DEmRNA, differentially expressed mRNA
Figure 6.
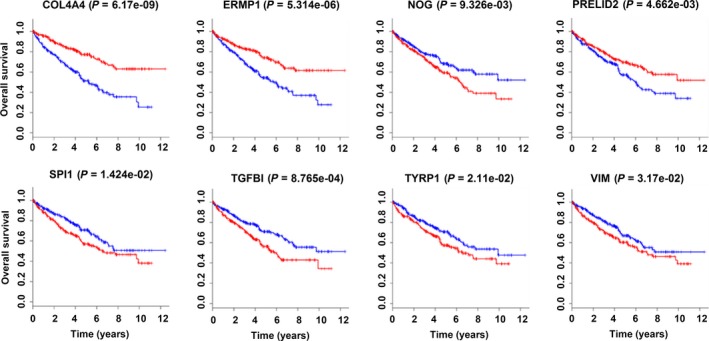
The results showed the patients with high expression of COL4A4, ERMP1 and PRELID2 had a better overall survival (OS) (P < .05). In contrast, patients with low expression of NOG, SPI1, TGFβ1, TYRP1 and VIM had better overall survival (P < .05). (
 ) High expression.
3.5. DElncRNA in relation to overall survival in the training set
To further analyze the function of DElncRNA, we calculated the relationship between the 89 DElncRNA in the network and overall survival using the Cox proportional hazards regression model in the training set. The results showed that 22 DElncRNA were closely related with overall survival in the univariate analysis (P < .01). Then, the 22 DElncRNA were analyzed by multivariate Cox regression. The results showed 9 DElncRNA, SLC25A5‐AS1, COL18A1‐AS1, WT1‐AS, AC016773.1, LINC00460, LINC00313, HOTTIP, FGF14‐AS1 and AC105020.1 to be independent influencing factors of survival time (P < .001; Table 5). The risk score was imputed as follows: the expression of SLC25A5‐AS1 * (−.005539) + the expression of COL18A1‐AS1 * (−.011813) + the expression of WT1‐AS * .005503 + the expression of AC016773.1 * .014487 + the expression of LINC00460 * .001143 + the expression of LINC00313 * .015264 + the expression of HOTTIP * .008013 + the expression of FGF14‐AS1 * (−.193023) + the expression of AC105020.1 * .001524. Among the 9 lncRNA, the coefficients in Cox regression of SLC25A5‐AS1, COL18A1‐AS1 and FGF14‐AS1 were negative. In contrast, the coefficients in the Cox regression of WT1‐AS, AC016773.1, LINC00460, LINC00313, HOTTIP and AC105020.1 were positive.
Table 5.
Multivarite analysis of DElncRNA for overall survival
| Gene | Ensembl ID | Coefficient | Exp (coefficient) | SE (coefficient) | Z | P |
|---|---|---|---|---|---|---|
| SLC25A5‐AS1 | ENSG00000224281 | −.005539 | .994476 | .003704 | −1.50 | .13481 |
| COL18A1‐AS1 | ENSG00000183535 | −.011813 | .988257 | .007592 | −1.56 | .11973 |
| WT1‐AS | ENSG00000183242 | .005503 | 1.005518 | .002349 | 2.34 | .01915 |
| AC016773.1 | ENSG00000270195 | .014487 | 1.014592 | .003947 | 3.67 | .00024 |
| LINC00460 | ENSG00000233532 | .001143 | 1.001144 | .000679 | 1.68 | .09203 |
| LINC00313 | ENSG00000185186 | .015264 | 1.015381 | .008925 | 1.71 | .08723 |
| HOTTIP | ENSG00000243766 | .008013 | 1.008045 | .004220 | 1.90 | .05762 |
| FGF14‐AS1 | ENSG00000234445 | −.193023 | .824463 | .109902 | −1.76 | .07903 |
| AC10502.1 | ENSG00000203392 | .001524 | 1.001525 | .000806 | 1.89 | .05871 |
Next, we calculated the 9 lncRNA expression‐based survival risk score of the 259 patients. The median risk score was 1.087797. All the patients were divided into low‐risk and high‐risk groups based on the median risk score. The survival of 2 different groups was calculated using Kaplan‐Meier curves, and the results showed that the risk was closed correlated with OS. Patients with high‐risk scores had poorer OS than patients with low‐risk scores (P < .001; Figure 7A). The 5‐year OS of the low‐risk and high‐risk groups were 86.7 (95%CI = .798‐.943) and 42.9 (95%CI = .3377‐.546), respectively. Furthermore, we evaluated the 9‐lncRNA signature using the area under ROC curve (AUC) of the ROC curve. The result showed that the value of AUC was .786 (Figure 7B). The distributions of the risk score, survival state and expression of 9 lncRNA in the training set are shown in Figure 7C.
Figure 7.
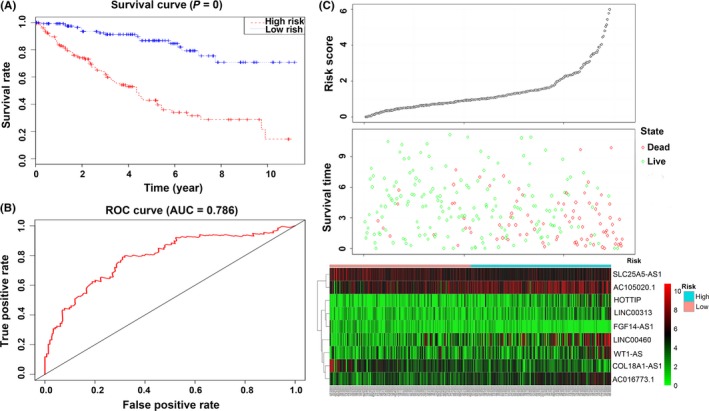
Identification and performance evaluation of the 9‐lncRNA signature in the training dataset. A, Kaplan‐Meier survival curve analysis for overall survival of clear cell renal cell carcinoma patients using the 9‐lncRNA signature in the training dataset; B, ROC curve analysis of the 9‐lncRNA signature in the training dataset; C, The distributions of the RSlncRNA, survival status and expression profiles of the 9 lncRNA of patients in the training dataset
3.6. The 9‐lncRNA signature for survival prediction in the testing and the entire set
Next, to further evaluate the 9‐lncRNA signature for survival prediction in ccRCC patients, we tested it in the testing and entire sets. The predictive model and cut‐off point used were the same as for the training set. The testing set was divided into a low‐risk group (n = 131) and a high‐risk group (n = 129). The survival of the 2 risk groups was calculated by Kaplan‐Meier survival curves as in the training set. Patients with high‐risk scores had poorer OS than patients with low‐risk scores (P < .001, Figure 8A). The 5‐year OS of the low‐risk and high‐risk groups were 82.1 (95%CI = .747‐.902) and 45.9 (95%CI = .369‐.57), respectively. The AUC in the ROC curve was .722 (Figure 8B). The distributions of the risk score, survival state and expression of 9 lncRNA in the testing set are shown in Figure 8C.
Figure 8.
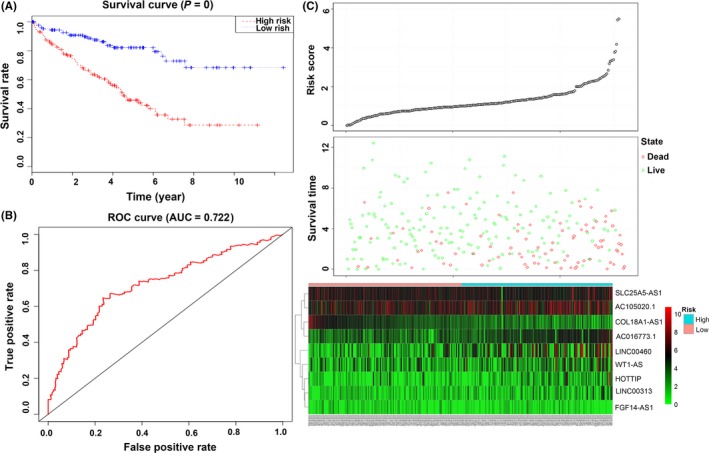
Evaluation of the 9‐lncRNA signature in the testing dataset. A, Kaplan‐Meier survival curve analysis for overall survival of clear cell renal cell carcinoma patients using the 9‐lncRNA signature in the testing dataset; B, receiver operating characteristic curve analysis of the 9‐lncRNA signature in the testing dataset; C, the distributions of the RSlncRNA, survival status and expression profiles of the 9 lncRNA of patients in the testing dataset
The results for the entire set were similar. The patients with high‐risk scores had poorer OS than patients with low‐risk scores (P < .001; Figure 9A). The 5‐year OS of the low‐risk and high‐risk groups were 83.3 (95%CI = .779‐.89) and 48 (95%CI = .415‐.555), respectively. The AUC in the ROC curve was .74 (Figure 9B). The distributions of the risk score, survival state and expression of 9 lncRNA in the entire set are shown in Figure 9C.
Figure 9.
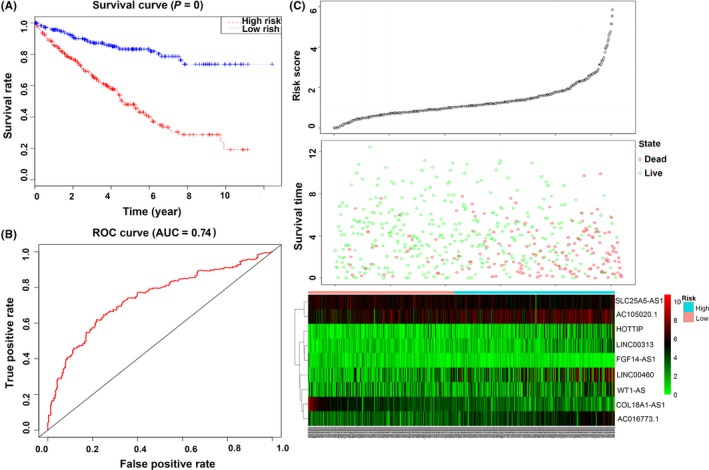
Evaluation of the 9‐lncRNA signature in the entire dataset. A, Kaplan‐Meier survival curve analysis for overall survival of clear cell renal cell carcinoma patients using the 9‐lncRNA signature in the entire dataset; B, receiver operating characteristic curve analysis of the 9‐lncRNA signature in the entire dataset; C, the distributions of the RSlncRNA, survival status and expression profiles of the 9 lncRNA of patients in the entire dataset
3.7. The prognostic factors of clinical features
The clinical factors of 519 ccRCC patients were further evaluated using SPSS 22 software. The univariate Cox regression analysis showed that age, neoadjuvant treatment, histologic grade, pathologic stage and risk were factors affecting survival. However, in the multivariate COX regression analysis, age, histologic grade, pathologic stage and risk were independent prognostic indictors in ccRCC (Table 6). The survival curves were drawn using the Kaplan‐Meier method, and the factors age, histologic grade, pathologic stage and risk were associated with OS (P = .001, <.001, <.001 and <.001; Figure 10). Furthermore, age, histologic grade and pathologic stage were also significant risk factors affecting survival. Therefore, we undertook a stratification analysis to further explore the signature of the 9 lncRNA within the same clinical factor.
Table 6.
519 patients characteristics and clinical data
| Characteristic | Value (%) | Univariate | Multivariate | ||
|---|---|---|---|---|---|
| HR(95% CI) | P | HR(95% CI) | P | ||
| Age, years (mean ± SD) | |||||
| <62 | 277 (53.4) | ||||
| ≧62 | 242 (46.6) | 1.707 (1.258‐2.316) | .001 | 1.475 (1.086‐2.004) | .013 |
| Sex | |||||
| Male | 335 (64.5) | ||||
| Female | 184 (35.5) | .962 (.704‐1.314) | .809 | ||
| Neoadjuvant treatment | |||||
| Yes | 17 (3.3) | ||||
| No | 502 (96.7) | .468 (.247‐.888) | .02 | .565 (.296‐1.078) | .083 |
| Race | |||||
| Asian | 8 (1.5) | ||||
| Black or African American | 52 (10.0) | ||||
| White | 452 (87.1) | ||||
| Not available | 7 (1.3) | 1.075 (.819‐1.411) | .604 | ||
| Grade | |||||
| 1‐2 | 239 (46.1) | ||||
| 3‐4 | 280 (53.9) | 2.643 (1.875‐3.725) | <.001 | 1.703 (1.186‐2.446) | .004 |
| Tumor stage | |||||
| I + II | 318 (61.3) | ||||
| III + IV | 201 (38.7) | 3.741 (2.721‐5.143) | <.001 | 2.486 (1.771‐3.49) | <.001 |
| Risk | |||||
| Low‐risk | 247 (47.6) | ||||
| High‐risk | 272 (52.4) | 3.995 (2.762‐5.777) | <.001 | 2.953 (2.021‐4.315) | <.001 |
Figure 10.

The prognostic value of different clinical features for overall survival of clear cell renal cell carcinoma patients. Kaplan‐Meier curves of 3 independent prognostic indictors
First, we placed all 519 patients into a younger group (age < 62; n = 277) or an older group (age > 62; n = 242). The log‐rank test result showed that the low‐risk patients (n = 136) had a better OS than high‐risk (n = 141) patients in the younger group (P < .001). The result in the older group was similar (Figure 11A). The low‐risk patients (n = 111) had a better OS than the high‐risk patients (n = 131; P < .001). Then, the patients were divided into an early stage (I + II; n = 315) group and a late‐stage (III + IV) group. In the early stage group, the low‐risk patients (n = 184) had a better OS than the high‐risk patients (n = 131; P < .001). In the late‐stage group, the result was similar (P < .001; Figure 11B). Finally, we placed patients into a low‐grade group (n = 239) or a high‐grade group (n = 280). In the low‐grade group, the low‐risk patients (n = 141) had a better OS than the high‐risk patients (n = 98; P < .001). In the high‐grade group, the result was similar (P < .001; Figure 11C).
Figure 11.
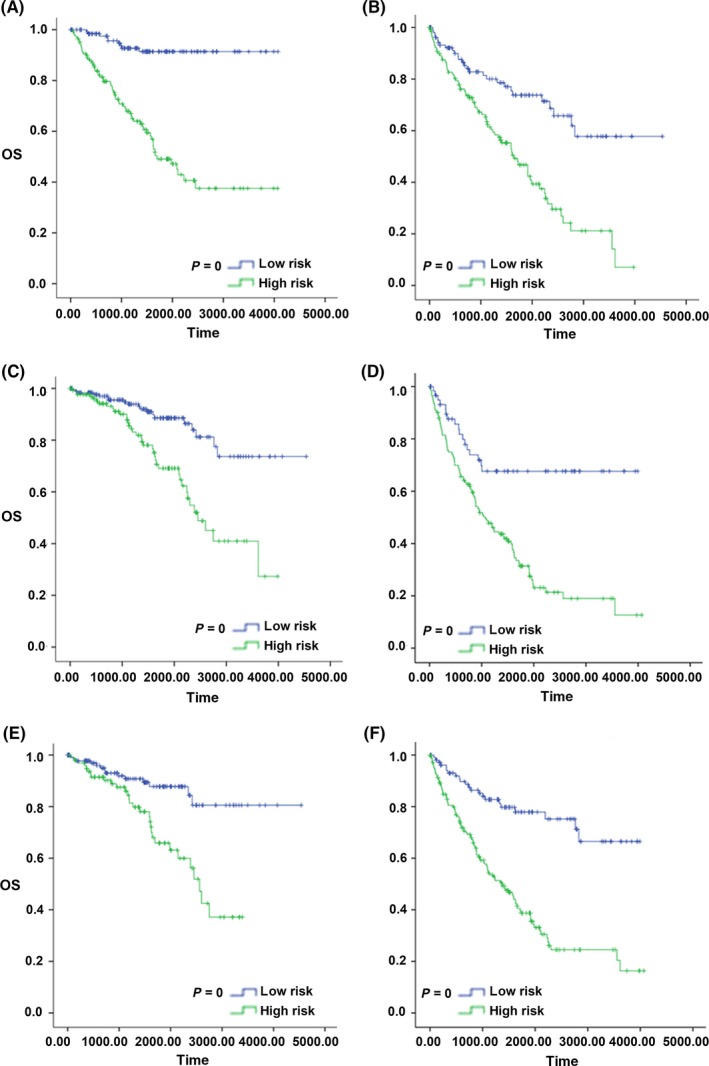
Kaplan‐Meier survival curve analysis for overall survival of patients stratified by age, stage and grade using the 9‐lncRNA signature in the entire dataset. A, Kaplan‐Meier survival curves of the younger patients group; B, Kaplan‐Meier survival curves of the older patient group; C, Kaplan‐Meier survival curves of the early stage patients group; D, Kaplan‐Meier survival curves of the late‐stage patients group; E, Kaplan‐Meier survival curves of the low‐grade patients group; F, Kaplan‐Meier survival curves of the high‐grade patients group
4. DISCUSSION
Renal cell carcinoma is one of the most common malignant carcinomas in the world and has a high incidence and mortality rate.28 In a previous study, we identified biomarkers of papillary renal cell carcinoma associated with pathological stage by weighted gene co‐expression network analysis.29 CcRCC is the most common type of renal cancer, and there is an urgent need to explore the mechanism of the disease. LncRNA play important roles in tumor progression and may be biomarkers for clinical diagnosis and prognosis according to recent studies. For example, in colorectal cancer, the lncRNA AB073614 induced epithelial mesenchymal transition.30 In cervical cancer, lncRNA SNHG20 promoted cell proliferation and invasion.31
Furthermore, lncRNA were able to compete with mRNA for the binding sites of miRNA which affect the expression of mRNA through MRE. For example, the lncRNA UICLM acted as a ceRNA for miR‐215 to regulate ZEB2 expression in colorectal cancer.32 In gastric cancer, the lncRNA BC0032469 upregulated hTERT expression by sponging miR‐1207, which promoted proliferation.33 In hepatocellular cancer, the lncRNA SNHG6‐003 also functions as a ceRNA to promote tumor progression.34 Therefore, constructing a ceRNA network is important to explore the mechanism of the disease.
There are many studies on ceRNA networks in numerous cancers; however, few of them are on ccRCC. In addition, the sample sizes have not been large enough. Therefore, in the present study, we explored the interactions among lncRNA, miRNA and mRNA by constructing a ceRNA network in ccRCC by means of TCGA databases. First, we identified differentially expressed mRNA, lncRNA and miRNA between tumor tissues and normal tissues. Then, using bioinformatics tools, we explored 89 DElncRNA, 10 DEmiRNA and 22 DEmRNA and constructed a ceRNA network. Furthermore, we analyzed the GO functions and KEGG pathways of 22 DEmRNA. The GO enrichment results revealed that the main functions are stem cell population maintenance, positive regulation of gene expression, NFAT protein binding and protein homodimerization activity. The KEGG pathway enrichment results identified that pathways in cancer, cytokine receptor interaction and PI3K‐Akt signaling pathways are the main affected pathways. In rectal cancer, the main DEmRNA‐associated pathways were PI3K‐Akt, WNT, AMPK and cGMP‐PKG signaling pathways, as well as cell adhesion molecules. In thyroid cancer, the main pathways were pathways in cancer and cytokine receptor interaction. Therefore, the ceRNA network played an important role in the cancer progression.
LncRNA played a vital role in cancer and could be used to predict the survival prognosis. The lncRNA FMO6P and PRR26 were identified to construct a risk score to predict the prognostic value in lung cancer.35 In pancreatic ductal adenocarcinoma, a 5‐lncRNA signature (C9orf139, MIR600HG, RP5‐965G21.4, RP11‐436K8.1 and CTC‐327F10.4) could be used to make prognoses for patients.36 In ER‐positive breast cancer, a 6‐lncRNA (HAGLR, STK4‐AS1, DLEU7‐AS1, LINC00957, LINC01614 and ITPR1‐AS1) signature was a potential prognostic marker for survival prediction.37 In esophageal squamous cell cancer, a 3‐lncRNA signature could predict overall survival.38 In our study, we explored the correlation between survival and 89 DElncRNA in the training dataset. The 9 lncRNA, SLC25A5‐AS1, COL18A1‐AS1, WT1‐AS, AC016773.1, LINC00460, LINC00313, HOTTIP, FGF14‐AS1 and AC105020.1, showed a significant prognostic value for the survival of ccRCC patients by multivariate Cox proportional hazards regression analysis. Then, we explored the risk score by combining the 9 lncRNA and found that this 9‐lncRNA signature independently predicted survival in ccRCC patients. The 9 lncRNA were further proved in the testing group and the entire group, which demonstrated good reproducibility. Furthermore, multivariate Cox regression and further analysis proved that the 9‐lncRNA signature was an independent prognostic factor to predict survival in ccRCC patients. Specifically, to our knowledge, this is the first study combining a ceRNA network constructed by TCGA databases and constructing an lncRNA risk score in ccRCC.
However, there are several limitations to our study. The main method in our study was bioinformatics technology, which appears as a promising tool to understand the function of gene and protein interactions, pathways and networks. However, the functions and networks of lncRNA are complex. In our study, the network was constructed only by means of the ceRNA theory. Moreover, a longer follow‐up is needed to validate our findings. Finally, other databases still need to be used to verify the findings.
In conclusion, our study performed a comprehensive analysis of mRNA, miRNA and lncRNA expression profiles and clinical data of ccRCC patients in the TCGA database. We constructed a ceRNA network and identified a 9‐lncRNA signature that is closely associated with overall survival to predict prognosis. The 9 lncRNA were further proved to predict the survival risk in the testing and entire sets. Furthermore, multivariate analysis proved the 9‐lncRNA signature to be an independent factor affecting survival and other clinical factors. Therefore, the current study not only provided the ceRNA molecular mechanisms, but also explored the potential of a novel 9‐lncRNA signature as a candidate biomarker for ccRCC patients.
CONFLICT OF INTEREST
The authors declare that the research was conducted in the absence of any commercial or financial relationships that could be construed as a potential conflict of interest.
Supporting information
ACKNOWLEDGMENTS
We are grateful for free access to the TCGA databases.
Yin H, Wang X, Zhang X, et al. Integrated analysis of long noncoding RNA associated‐competing endogenous RNA as prognostic biomarkers in clear cell renal carcinoma. Cancer Sci. 2018;109:3336–3349. 10.1111/cas.13778
Funding information
This research was funded by the National Natural Science Foundation of China (81472799).
REFERENCES
- 1. Siegel RL, Miller KD, Jemal A. Cancer statistics, 2018. CA Cancer J Clin. 2018;68:7‐30. [DOI] [PubMed] [Google Scholar]
- 2. Barata PC, Rini BI. Treatment of renal cell carcinoma: current status and future directions. CA Cancer J Clin. 2017;67:507‐524. [DOI] [PubMed] [Google Scholar]
- 3. Jonasch E, Gao J, Rathmell WK. Renal cell carcinoma. BMJ. 2014;349:g4797. [DOI] [PMC free article] [PubMed] [Google Scholar]
- 4. Lane BR, Kattan MW. Prognostic models and algorithms in renal cell carcinoma. Urol Clin North Am 2008;35:613‐625; vii. [DOI] [PubMed] [Google Scholar]
- 5. Caceres W, Cruz‐Chacon A. Renal cell carcinoma: molecularly targeted therapy. P R Health Sci J. 2011;30:73‐77. [PubMed] [Google Scholar]
- 6. Mendell JT. Targeting a long noncoding RNA in breast cancer. N Engl J Med. 2016;374:2287‐2289. [DOI] [PubMed] [Google Scholar]
- 7. Kretz M, Siprashvili Z, Chu C, et al. Control of somatic tissue differentiation by the long non‐coding RNA TINCR. Nature. 2013;493:231‐235. [DOI] [PMC free article] [PubMed] [Google Scholar]
- 8. Hung T, Chang HY. Long noncoding RNA in genome regulation: prospects and mechanisms. RNA Biol. 2010;7:582‐585. [DOI] [PMC free article] [PubMed] [Google Scholar]
- 9. Sui J, Li YH, Zhang YQ, et al. Integrated analysis of long non‐coding RNAassociated ceRNA network reveals potential lncRNA biomarkers in human lung adenocarcinoma. Int J Oncol. 2016;49:2023‐2036. [DOI] [PubMed] [Google Scholar]
- 10. Wang X, Chen X, Meng Q, et al. MiR‐181b regulates cisplatin chemosensitivity and metastasis by targeting TGFbetaR1/Smad signaling pathway in NSCLC. Sci Rep. 2015;5:17618. [DOI] [PMC free article] [PubMed] [Google Scholar]
- 11. Wang X, Yin H, Zhang H, et al. NF‐kappaB‐driven improvement of EHD1 contributes to erlotinib resistance in EGFR‐mutant lung cancers. Cell Death Dis. 2018;9:418. [DOI] [PMC free article] [PubMed] [Google Scholar]
- 12. Berindan‐Neagoe I, Monroig Pdel C, Pasculli B, Calin GA. MicroRNAome genome: a treasure for cancer diagnosis and therapy. CA Cancer J Clin. 2014;64:311‐336. [DOI] [PMC free article] [PubMed] [Google Scholar]
- 13. Wu D, Niu X, Pan H, et al. Tumor‐suppressing effects of microRNA‐429 in human renal cell carcinoma via the downregulation of Sp1. Oncol Lett. 2016;12:2906‐2911. [DOI] [PMC free article] [PubMed] [Google Scholar]
- 14. Tay Y, Rinn J, Pandolfi PP. The multilayered complexity of ceRNA crosstalk and competition. Nature 2014;505:344‐352. [DOI] [PMC free article] [PubMed] [Google Scholar]
- 15. Thomson DW, Dinger ME. Endogenous microRNA sponges: evidence and controversy. Nat Rev Genet. 2016;17:272‐283. [DOI] [PubMed] [Google Scholar]
- 16. Denzler R, McGeary SE, Title AC, Agarwal V, Bartel DP, Stoffel M. Impact of microRNA levels, target‐site complementarity, and cooperativity on competing endogenous RNA‐regulated gene expression. Mol Cell. 2016;64:565‐579. [DOI] [PMC free article] [PubMed] [Google Scholar]
- 17. Cesana M, Cacchiarelli D, Legnini I, et al. A long noncoding RNA controls muscle differentiation by functioning as a competing endogenous RNA. Cell. 2011;147:358‐369. [DOI] [PMC free article] [PubMed] [Google Scholar]
- 18. Zhang J, Fan D, Jian Z, Chen GG, Lai PB. Cancer specific long noncoding RNAs show differential expression patterns and competing endogenous RNA potential in hepatocellular carcinoma. PLoS ONE. 2015;10:e0141042. [DOI] [PMC free article] [PubMed] [Google Scholar]
- 19. Xue WH, Fan ZR, Li LF, et al. Construction of an oesophageal cancer‐specific ceRNA network based on miRNA, lncRNA, and mRNA expression data. World J Gastroenterol. 2018;24:23‐34. [DOI] [PMC free article] [PubMed] [Google Scholar]
- 20. Huang C, Yuan N, Wu L, et al. An integrated analysis for long noncoding RNAs and microRNAs with the mediated competing endogenous RNA network in papillary renal cell carcinoma. Oncol Targets Ther. 2017;10:4037‐4050. [DOI] [PMC free article] [PubMed] [Google Scholar]
- 21. Zhao Y, Simon R. BRB‐ArrayTools Data Archive for human cancer gene expression: a unique and efficient data sharing resource. Cancer Inform. 2008;6:9‐15. [DOI] [PMC free article] [PubMed] [Google Scholar]
- 22. Leek JT, Monsen E, Dabney AR, Storey JD. EDGE: extraction and analysis of differential gene expression. Bioinformatics. 2006;22:507‐508. [DOI] [PubMed] [Google Scholar]
- 23. Shannon P, Markiel A, Ozier O, et al. Cytoscape: a software environment for integrated models of biomolecular interaction networks. Genome Res. 2003;13:2498‐2504. [DOI] [PMC free article] [PubMed] [Google Scholar]
- 24. da Huang W, Sherman BT, Lempicki RA. Systematic and integrative analysis of large gene lists using DAVID bioinformatics resources. Nat Protoc. 2009;4:44‐57. [DOI] [PubMed] [Google Scholar]
- 25. Xie C, Mao X, Huang J, et al. KOBAS 2.0: a web server for annotation and identification of enriched pathways and diseases. Nucleic Acids Res. 2011;39:W316‐W322. [DOI] [PMC free article] [PubMed] [Google Scholar]
- 26. Zeng JH, Liang L, He RQ, et al. Comprehensive investigation of a novel differentially expressed lncRNA expression profile signature to assess the survival of patients with colorectal adenocarcinoma. Oncotarget. 2017;8:16811‐16828. [DOI] [PMC free article] [PubMed] [Google Scholar]
- 27. Heagerty PJ, Lumley T, Pepe MS. Time‐dependent ROC curves for censored survival data and a diagnostic marker. Biometrics. 2000;56:337‐344. [DOI] [PubMed] [Google Scholar]
- 28. Hes O, Comperat EM, Rioux‐Leclercq N. Clear cell papillary renal cell carcinoma, renal angiomyoadenomatous tumor, and renal cell carcinoma with leiomyomatous stroma relationship of 3 types of renal tumors: a review. Ann Diagn Pathol. 2016;21:59‐64. [DOI] [PubMed] [Google Scholar]
- 29. He Z, Sun M, Ke Y, et al. Identifying biomarkers of papillary renal cell carcinoma associated with pathological stage by weighted gene co‐expression network analysis. Oncotarget. 2017;8:27904‐27914. [DOI] [PMC free article] [PubMed] [Google Scholar]
- 30. Xue J, Liao L, Yin F, Kuang H, Zhou X, Wang Y. LncRNA AB073614 induces epithelial‐ mesenchymal transition of colorectal cancer cells via regulating the JAK/STAT3 pathway. Cancer Biomark. 2018;21:849‐858. [DOI] [PubMed] [Google Scholar]
- 31. Guo H, Yang S, Li S, Yan M, Li L, Zhang H. LncRNA SNHG20 promotes cell proliferation and invasion via miR‐140‐5p‐ADAM10 axis in cervical cancer. Biomed Pharmacother. 2018;102:749‐757. [DOI] [PubMed] [Google Scholar]
- 32. Chen DL, Lu YX, Zhang JX, et al. Long non‐coding RNA UICLM promotes colorectal cancer liver metastasis by acting as a ceRNA for microRNA‐215 to regulate ZEB2 expression. Theranostics. 2017;7:4836‐4849. [DOI] [PMC free article] [PubMed] [Google Scholar]
- 33. Lu MH, Tang B, Zeng S, et al. Long noncoding RNA BC032469, a novel competing endogenous RNA, upregulates hTERT expression by sponging miR‐1207‐5p and promotes proliferation in gastric cancer. Oncogene. 2016;35:3524‐3534. [DOI] [PubMed] [Google Scholar]
- 34. Cao C, Zhang T, Zhang D, et al. The long non‐coding RNA, SNHG6‐003, functions as a competing endogenous RNA to promote the progression of hepatocellular carcinoma. Oncogene. 2017;36:1112‐1122. [DOI] [PubMed] [Google Scholar]
- 35. Sui J, Xu SY, Han J, et al. Integrated analysis of competing endogenous RNA network revealing lncRNAs as potential prognostic biomarkers in human lung squamous cell carcinoma. Oncotarget. 2017;8:65997‐66018. [DOI] [PMC free article] [PubMed] [Google Scholar]
- 36. Song J, Xu Q, Zhang H, et al. Five key lncRNAs considered as prognostic targets for predicting pancreatic ductal adenocarcinoma. J Cell Biochem. 2017;119:4559‐4869. [DOI] [PMC free article] [PubMed] [Google Scholar]
- 37. Zhong L, Lou G, Zhou X, Qin Y, Liu L, Jiang W. A six‐long non‐coding RNAs signature as a potential prognostic marker for survival prediction of ER‐positive breast cancer patients. Oncotarget. 2017;8:67861‐67870. [DOI] [PMC free article] [PubMed] [Google Scholar]
- 38. Huang GW, Xue YJ, Wu ZY, et al. A three‐lncRNA signature predicts overall survival and disease‐free survival in patients with esophageal squamous cell carcinoma. BMC Cancer. 2018;18:147. [DOI] [PMC free article] [PubMed] [Google Scholar]
Associated Data
This section collects any data citations, data availability statements, or supplementary materials included in this article.
Supplementary Materials


