

Abstract
Trastuzumab‐emtansine (T‐DM1) is an antibody‐drug conjugate that has been approved for the treatment of human epidermal growth factor receptor 2 (HER2)‐positive metastatic breast cancer. Despite the remarkable efficacy of T‐DM1 in many patients, resistance to this therapeutic has emerged as a significant clinical problem. In the current study, we used BT‐474/KR cells, a T‐DM1‐resistant cell line established from HER2‐positive BT‐474 breast cancer cells, as a model to investigate mechanisms of T‐DM1 resistance and explore effective therapeutic regimens. We show here for the first time that activation of signal transducer and activator of transcription 3 (STAT3) mediated by leukemia inhibitory factor receptor (LIFR) overexpression confers resistance to T‐DM1. Moreover, secreted factors induced by activated STAT3 in resistant cells limit the responsiveness of cells that were originally sensitive to T‐DM1. Importantly, STAT3 inhibition sensitizes resistant cells to T‐DM1, both in vitro and in vivo, suggesting that the combination T‐DM1 with STAT3‐targeted therapy is a potential treatment for T‐DM1‐refractory patients.
Keywords: drug resistance, leukemia inhibitory factor receptor, secreted factor, STAT3, trastuzumab‐emtansine
Abbreviations
- ADC
antibody‐drug conjugate
- CM
conditioned media
- DM1
mertansine
- LIFR
leukemia inhibitory factor receptor
- P‐gp
P‐glycoprotein
- STAT3
signal transducer and activator of transcription 3
- T‐DM1
trastuzumab emtansine
- TGI
tumor growth inhibition
1. INTRODUCTION
Breast cancer is the most common cancer in women worldwide, and the prognosis for patients with this disease is poor.1 Human epidermal growth factor receptor 2 (HER2) is amplified in up to 20% of primary breast cancers and is associated with aggressive tumor features.2 The anti‐HER2 monoclonal antibodies trastuzumab and pertuzumab, as well as the kinase inhibitor lapatinib, which targets epidermal growth factor receptor (EGFR) and HER2, have been approved for HER2‐positive breast cancer and have been shown to provide clinical benefits,3, 4 but primary and acquired resistance to these drugs is common.5
Trastuzumab‐emtansine (T‐DM1), an antibody‐drug conjugate (ADC) comprising the antibody trastuzumab and the cytotoxic moiety DM1 (a derivative of maytansine), was developed to overcome drug resistance in HER2‐positive breast cancer. T‐DM1 possesses the HER2‐targeting action of trastuzumab plus the anti‐microtubule activity of DM1. After the binding of T‐DM1 to HER2 on the cell surface, the HER2‐T‐DM1 complex enters the cell via receptor‐mediated endocytosis.6, 7 DM1 is then released from lysosomes and inhibits microtubule assembly, causing mitotic arrest and apoptosis.8, 9 T‐DM1 is recommended in the clinic as a second‐line treatment for HER2‐positive, advanced breast cancer that has progressed during or after first‐line HER2‐targeted therapy (trastuzumab, pertuzumab, or taxane).10 Although the clinical results with T‐DM1 are impressive, some patients do not respond to the drug or relapse after an initial response.11 Unlike mechanisms underlying resistance to trastuzumab, pertuzumab or lapatinib, which are generally well understood, however, the mechanisms responsible for T‐DM1 resistance are poorly characterized. Among the known mechanisms of T‐DM1 resistance are hindrance of trastuzumab binding to HER2 caused by mucin 4 (MUC4) expression,12 defects in intracellular metabolism of T‐DM1 owing to impaired lysosomal proteolytic activity,13, 14 and efflux of DM1 as a result of the expression of multidrug resistance (MDR) transporters.15, 16 Clearly, additional effort is required to understand and overcome T‐DM1 resistance.
To address this problem, we modeled the development of acquired resistance in patients by establishing the monoclonal T‐DM1‐resistant cell line, BT‐474/KR, from parental HER2‐overexpressing BT‐474 human breast cancer cells. Using this model, we sought to gain a better understanding of the mechanisms that confer T‐DM1 resistance, and, more importantly, to develop effective regimens to overcome this resistance.
2. MATERIALS AND METHODS
2.1. Reagents and antibodies
The T‐DM1 and trastuzumab were purchased from F. Hoffmann‐La Roche (Basel, Switzerland). Napabucasin and DM1 were purchased from Meilunbio Inc. (Dalian, China). LysoTracker Deep Red and DyLight 488 NHS ester were purchased from Thermo‐Fisher Scientific (Waltham, MA, USA). Propidium iodide, sulforhodamine B, and the antibody against β‐tubulin were purchased from Sigma‐Aldrich (St Louis, MO, USA). Antibodies against HER2, P‐glycoprotein (P‐gp), phospho‐STAT1 (Tyr701), STAT1, phospho‐STAT3 (Tyr705), STAT3, phospho‐STAT5 (Tyr694), STAT5, phospho‐EGFR (Tyr845), phospho‐HER3 (Tyr1289), phospho‐c‐MET (Tyr1234/1235), phospho‐FGFR1 (Tyr653/654), phospho‐histone H3 (Ser10), PARP and c‐Myc were purchased from Cell Signaling Technology (Beverly, MA, USA). Antibodies against leukemia inhibitory factor receptor (LIFR), interleukin‐6 receptor (IL‐6R), granulocyte‐macrophage colony‐stimulating factor receptor (GM‐CSFR), β‐actin, and caspase‐3 were purchased from Santa Cruz Biotechnology (Santa Cruz, CA, USA).
2.2. Cell culture and treatment
The human BT‐474 and MDA‐MB‐231 cell lines were obtained from the American Type Culture Collection (ATCC, Manassas, VA, USA) and were cultured according to instructions provided by the ATCC. The human KB and KBV200 cell lines were kindly provided by Professor Liwu Fu (Sun Yat‐sen University, Guangzhou) and were cultured in RPMI‐1640 medium supplemented with 10% fetal bovine serum. Acquired T‐DM1‐resistant cells (BT‐474/KR) were established by exposing parental BT‐474 cells to increasing concentrations of T‐DM1 (from 10 ng/mL to 1 μg/mL) for 12 months and selecting clones through the limiting dilution method.
2.3. Cell proliferation assay
Cell growth inhibition was determined using a sulforhodamine B assay, as described previously.17 Briefly, approximately 24 hours after plating, cells were treated with different concentrations of drugs, alone or in combination, as indicated. At least 3 independent experiments were performed, and results are presented as mean ± SD.
2.4. Western blot analysis
Cells were lysed in sodium dodecyl sulfate (SDS) sample buffer and boiled for 10 minutes. Western blot analysis was conducted as previously described,17 and the levels of cellular proteins were visualized using the Western blot Imaging System (Clinx Science Instruments, Shanghai, China). Results were quantified on densitometry and normalized to β‐tubulin level.
2.5. RNA isolation and quantitative reverse transcription‐polymerase chain reaction
The RNA was isolated using the TRIzol reagent system and reverse transcribed using the PrimeScript Reverse Transcription reagent Kit (Takara, Dalian, China). Quantitative real‐time polymerase chain reaction (qRT‐PCR) was performed on a StepOnePlus Real‐Time PCR System (Thermo‐Fisher Scientific, Sunnyvale, CA, USA) according to the instructions for the SYBR Premix Ex Taq II kit (Takara, Dalian, China). The sequences of primers used for qRT‐PCR were as follows: LIFR, 5′‐TGG AAC GAC AGG GGT TCA GT‐3′ (forward) and 5′‐GAG TTG TGT TGT GGG TCA CTA A‐3′ (reverse); LIF, 5′‐CAC AAC AAC CTC ATG AAC CAG‐3′ (forward) and 5′‐CCA CAT AGC TTG TCC AGG TTG‐3′ (reverse); IL‐6, 5′‐AAC CTG AAC CTT CCA AAG ATG G‐3′ (forward) and 5′‐TCT GGC TTG TTC CTC ACT ACT‐3′ (reverse); GAPDH, 5′‐GGG GAA GGT GAA GGT CGG AGT C‐3′ (forward) and 5′‐CAA GCT TCC CGT TCT CAG CCT T‐3′ (reverse). mRNA was quantified using the 2−ΔΔCT method, and target mRNA level was normalized to those of the housekeeping gene, GAPDH.
2.6. Cell cycle analysis
Cells were fixed in ethanol and stained with propidium iodide (PI) following standard methods. The cell cycle was analyzed on fluorescence‐activated cell sorting (FACS) using a FACScan flow cytometer (BD Biosciences, San Jose, CA, USA).
2.7. Polymeric tubulin fraction assay
Polymeric tubulin was determined as described previously.18 Briefly, cells were lysed by incubating with a buffer consisting of 80 mmol/L MES‐KOH (pH 6.8), 1 mmol/L MgC12, 1 mmol/L EGTA, 0.1% Triton X‐100 and 10% glycerol for 3 minutes at 30°C, after which detergent‐insoluble polymerized cytoskeleton was measured on western blotting.
2.8. Binding assay
Cells were incubated with DyLight 488 NHS‐ester‐linked T‐DM1 (1 μg/mL) on ice for 1 hour and analyzed for binding affinity on flow cytometry.
2.9. Endocytosis assay
Cells were incubated with DyLight 488 NHS‐ester‐linked T‐DM1 (1 μg/mL) in growth medium at 37°C and then incubated on ice for 15 minutes with stripping buffer consisting of 0.05 mol/L glycine (pH 2.45) and 0.1 mol/L NaCl. Internalized fluorescence was analyzed immediately on flow cytometry.
2.10. Fluorescence microscopy
Cells were incubated with DyLight 488 NHS‐ester‐linked T‐DM1 (1 μg/mL) for 24 hours at 37°C; the lysosome fluorescent probe Lyso‐Tracker Red (50 nmol/L) was added 1 hour prior to fixation. Or cells were incubated with Lyso‐Tracker Red (50 nmol/L) for 1 hour at 37°C, then incubated with labeled T‐DM1 (1 μg/mL) for 1 hour at 4°C. Cells were fixed with 4% paraformaldehyde for 15 minutes and imaged with an Olympus FV1000 confocal microscope (Tokyo, Japan).
2.11. siRNA transfection
Cells were transfected with small interfering RNA (siRNA) duplexes using Lipofectamine 2000 (Thermo Fisher Scientific, Waltham, MA, USA) according to the manufacturer's instructions. siRNA with the following sequences were obtained from GenePharma (Shanghai, China): siSTAT3#1, 5′‐CCA CUU UGG UGU UUC AUA A‐3′; siSTAT3#2, 5′‐GGA GAA GCA UCG UGA GUG A‐3′; siLIFR#1, 5′‐CCA CAC CGC UCA AAU GUU A‐3′; siLIFR#2, 5′‐GAA CAA AAC GUU UCC UUA A‐3′.
2.12. ELISA
Cells were seeded in 6‐well plates at 106 cells per well. After 96 hours, the supernatants were collected. IL‐6 secretion was evaluated with enzyme‐linked immunosorbent assay (ELISA) kit (Dakewe Biotech, Shenzhen, China) according to the manufacturer's instructions. The absorbance was read at 450 nm.
2.13. Clonogenic assay
Cells were seeded in 6‐well plates at 200 cells per well. After 24 hours, cells were incubated with or without T‐DM1 in conditioned media from BT‐474 or BT‐474/KR cells, with changes in fresh media and T‐DM1 every 4 days. Twenty days later, colonies were fixed with methanol/acetic acid (3:1), stained with crystal violet, and counted.
2.14. In vivo study
Female Balb/cA‐nude mice (5‐6 weeks old) were purchased from Shanghai SLAC Laboratory Animal Co. (Shanghai, China). Human tumor xenografts of BT‐474 and BT‐474/KR cells were established by s.c. inoculation of cells into nude mice. Tumor‐bearing mice were randomized into groups, and dosing was started when average tumor volume reached approximately 100‐200 mm3. For single‐agent T‐DM1 treatment, vehicle or T‐DM1 (5 mg/kg) was given i.v. once weekly. In experiments evaluating changes in molecular signaling, napabucasin (50 mg/kg, i.p.) was given 48 hours before tumors were excised. In experiments evaluating the efficacy of T‐DM1 combined with napabucasin, T‐DM1 (3 mg/kg, i.v.) was given once weekly, and vehicle and napabucasin (20 mg/kg, i.p.) were given every other day. Tumor volume was calculated as (length × width2)/2, and bodyweight was monitored as an indicator of general health. Tumor growth inhibition (TGI; %) was calculated as 100−(T t−T 0)/(C t−C 0) × 100. When T t < T 0 or C t < C 0, TGI (%) was calculated as 100−(T t−T 0)/T 0 × 100. T t, mean tumor volume of treated group at time t; T 0, mean tumor volume of treated group at time 0; C t, mean tumor volume of control at time t and C 0, mean tumor volume of control at time 0. All animal experiments were carried out in accordance with guidelines of the Institutional Animal Care and Use Committee at the Shanghai Institute of Materia Medica, Chinese Academy of Sciences (Shanghai, China).
2.15. Immunohistochemistry
Immunohistochemistry was conducted as previously described.17 LIFR‐positive sites were visualized using a SABC kit and a DAB kit.
2.16. Statistical analysis
Data were analyzed using GraphPad Prism (GraphPad Software Inc., La Jolla, CA, USA). Non‐linear regression analysis was performed to generate dose‐response curves and calculate 50% inhibitory concentration (IC50). Two‐tailed Student's t test was used to determine the statistical significance of differences between 2 groups. P < .05 was considered statistically significant.
3. RESULTS
3.1. BT‐474/KR cells are resistant to T‐DM1 both in vitro and in vivo
The HER2‐overexpressing BT‐474 breast cancer cells were treated with increasing concentrations of T‐DM1 for 12 months, yielding the T‐DM1‐resistant subline BT‐474/KR. Cell growth assays for BT‐474 and BT‐474/KR cells were performed in the presence of different concentrations of T‐DM1. The IC50 for T‐DM1 in BT‐474/KR cells (1167.5 ± 16.3 ng/mL) was approximately 12‐fold higher than that in BT‐474 cells (97.4 ± 16.0 ng/mL), indicating that BT‐474/KR cells were significantly resistant to T‐DM1 (Figure 1A). We further assessed the response of BT‐474 and BT‐474/KR xenografts to T‐DM1 in vivo. As shown in Figure 1B, T‐DM1 (5 mg/kg) inhibited the growth of BT‐474 xenografts by 119%, but inhibited BT‐474/KR xenografts by only 58%, indicating that BT‐474/KR cells are also resistant to T‐DM1 in vivo.
Figure 1.
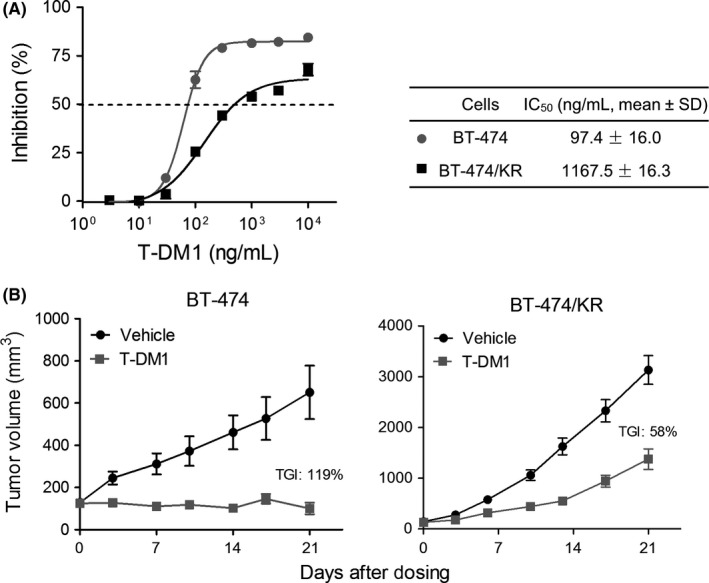
BT‐474/KR cells are resistant to trastuzumab‐emtansine (T‐DM1) both in vitro and in vivo. A, BT‐474 and BT‐474/KR cells were treated with different concentrations of T‐DM1 for 120 h, and cell survival was measured using sulforhodamine B assay. Data represent mean ± SD of 3 independent experiments. B, Nude mice bearing BT‐474 or BT‐474/KR xenograft tumors were treated with vehicle or 5 mg/kg T‐DM1 weekly for 21 days. Tumor volume was measured on the indicated days, and tumor growth inhibition (TGI) was calculated. IC50, 50% inhibitory concentration
3.2. T‐DM1 trafficking, microtubule dynamics, and drug efflux are not involved in T‐DM1 resistance in BT‐474/KR cells
The drug release mechanism for T‐DM1 consists of several key steps, including binding to HER2, internalization into cells, and release of DM1 through degradation of the T‐DM1 conjugate.19 Factors that affect these steps could conceivably play a role in T‐DM1 resistance. To test this, we first assessed HER2 status in BT‐474/KR cells. As shown in Figure 2A, HER2 level in BT‐474/KR cells was similar to that in BT‐474 cells. Moreover, the binding, internalization, and location of T‐DM1 were also the same in BT‐474 and BT‐474/KR cells (Figure 2B‐D). Because T‐DM1 is degraded after internalization, thereby yielding DM1‐containing catabolites that disrupt microtubule assembly,8 we next measured microtubule polymerization. As shown in Figure 2E, T‐DM1 decreased polymerization of tubulin to the same extent in both BT‐474/KR and BT‐474 cells, indicating that microtubule dynamics and release of DM1 through proteolytic degradation were not defective in BT‐474/KR cells. P‐gp overexpression is a major obstacle that limits the treatment efficacy of most antimicrotubule agents,20 but no increase in P‐gp expression was detected in BT‐474/KR cells (Figure 2F). Collectively, these results indicate that the resistance to T‐DM1 in BT‐474/KR cells is not attributable to HER2 expression; binding, internalization or lysosome‐mediated proteolytic degradation of T‐DM1; microtubule dynamics; or drug efflux.
Figure 2.
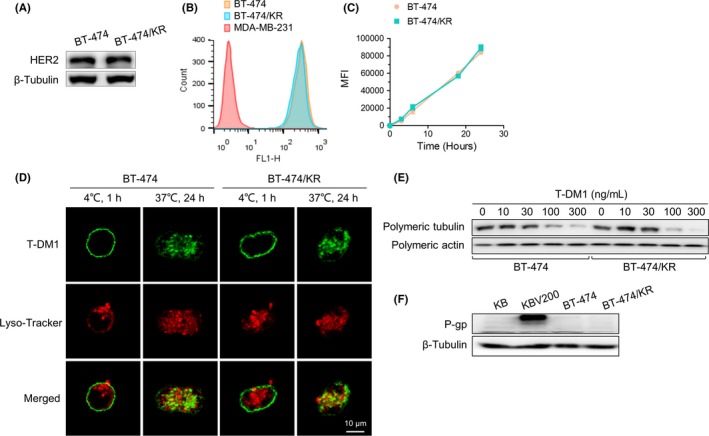
Trastuzumab‐emtansine (T‐DM1) trafficking, microtubule dynamics, and drug efflux are not significantly different between BT‐474 and BT‐474/KR cells. A, Human epidermal growth factor receptor 2 (HER2) status. Western blotting of HER2 in BT‐474 and BT‐474/KR cells. B, T‐DM1 binding. BT‐474 and BT‐474/KR cells were incubated with DyLight 488 NHS‐ester‐labeled T‐DM1 (1 μg/mL) on ice for 1 h, and binding of T‐DM1 to cells was analyzed on flow cytometry. C, T‐DM1 endocytosis. BT‐474 and BT‐474/KR cells were incubated with DyLight 488 NHS‐ester‐linked T‐DM1 (1 μg/mL) at 37°C for the indicated times, and surface fluorescence was quenched using stripping buffer. T‐DM1 endocytosis was analyzed on flow cytometry and indicated as mean fluorescence intensity (MFI). D, Co‐localization of T‐DM1 (green) with lysosomes (red). BT‐474 and BT‐474/KR cells were incubated with DyLight 488 NHS‐ester‐labeled T‐DM1 (1 μg/mL), and lysosomes were labeled with Lyso‐Tracker Red. Samples were analyzed on confocal microscopy. E, Microtubule polymerization. BT‐474 and BT‐474/KR cells were treated with the indicated concentrations of T‐DM1 for 48 h, and polymeric tubulin was measured on western blotting. F, P‐glycoprotein (P‐gp) expression on western blotting
3.3. T‐DM1 does not induce apoptosis of BT‐474/KR cells
The microtubule‐disrupting action of T‐DM1 results in cell cycle arrest in M‐phase and, ultimately, induces apoptosis.21, 22 Thus, we next analyzed the effect of T‐DM1 on the cell cycle and apoptosis. As expected, T‐DM1 arrested the cell cycle in M‐phase in BT‐474 cells, as evidenced by the accumulation of cells in G2/M‐phase (Figure 3A) and increased phosphorylation of histone H3 (Figure 3B). T‐DM1 also induced apoptosis in BT‐474 cells, as reflected in the appearance of a sub‐G1 cell population (Figure 3A) and the cleavage of caspase‐3 (Figure 3B). Unlike its effects in BT‐474 cells, however, T‐DM1 induced significantly greater M‐phase arrest, but no apoptosis, in BT‐474/KR cells (Figure 3A,B). Taken together, these results indicate that T‐DM1 arrests the cell cycle in M phase in BT‐474/KR cells, but the subsequent apoptosis is blocked, causing non‐apoptotic cells to accumulate in M phase, giving rise to the resistant phenotype.
Figure 3.
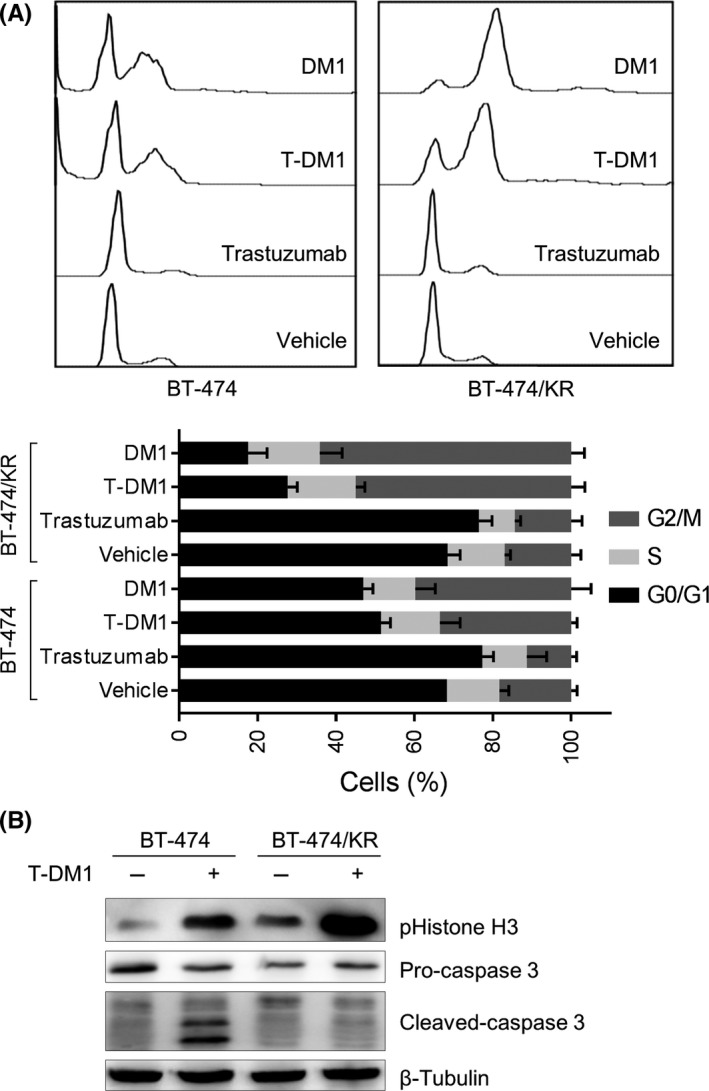
Trastuzumab‐emtansine (T‐DM1) arrested the cell cycle at M‐phase in BT‐474/KR cells, but did not induce apoptosis. A, BT‐474 and BT‐474/KR cells were treated with T‐DM1, trastuzumab or mertansine (DM1) for 48 h, and cell cycle distribution was analyzed on flow cytometry. Upper, representative images; lower, data from 3 separate experiments expressed as mean ± SD. B, BT‐474 and BT‐474/KR cells were treated with 1 μg/mL T‐DM1 for 48 h. Phospho‐histone H3 and cleaved caspase‐3 were measured on western blotting
3.4. Aberrantly activated STAT3 confers T‐DM1 resistance in BT‐474/KR cells
To determine which upstream event in BT‐474/KR cells was responsible for apoptotic resistance, we tested various inhibitors in an effort to identify targets whose inhibition restored sensitivity to T‐DM1 treatment. During these screenings, we discovered that napabucasin, an inhibitor of STAT3,23 restored significant T‐DM1 sensitivity in BT‐474/KR cells (Figure 4A). The STAT3 inhibition effect of napabucasin was verified (Figure 4B). In a subsequent analysis of related signaling pathways, phosphorylated (activated) STAT3 (pSTAT3) and total STAT3 were selectively increased in BT‐474/KR cells compared with other STAT family members (Figure 4C). To further explore the role of STAT3 in resistance to T‐DM1, we transfected BT‐474/KR cells with siRNA targeting STAT3 prior to T‐DM1 treatment and assessed cell apoptosis. Treatment of STAT3‐knockdown BT‐474/KR cells with T‐DM1 induced BT‐474/KR apoptosis, whereas no significant apoptosis was observed in control BT‐474/KR cells treated with T‐DM1 (Figure 4D). Taken together, these results highlight a critical role for aberrantly activated STAT3 in the regulation of T‐DM1 resistance.
Figure 4.
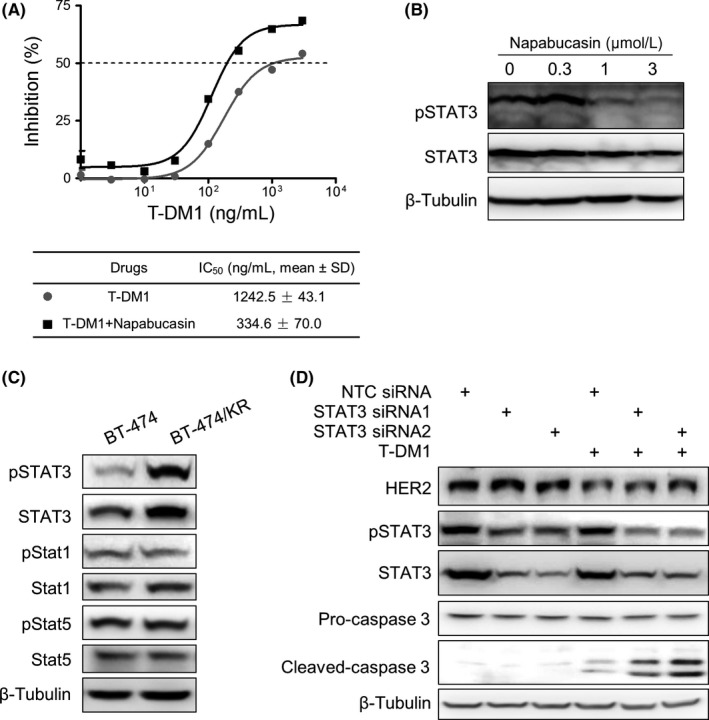
Signal transducer and activator of transcription 3 (STAT3) activation mediates trastuzumab‐emtansine (T‐DM1) resistance in BT‐474/KR cells. A, Growth inhibitory effects of T‐DM1, alone or in combination with 0.3 μmol/L napabucasin, on BT‐474/KR cells. Cell growth was measured using the sulforhodamine B assay. Data shown represent mean ± SD of 3 independent experiments. B, BT‐474/KR cells were treated with napabucasin for 24 h. STAT3 activation was detected on western blotting. C, Phosphorylated and total STAT1, STAT3, and STAT5 in BT‐474 and BT‐474/KR cells on western blotting. D, BT‐474/KR cells transfected with either non‐targeting control (NTC) or STAT3 small interfering RNA (siRNA) for 48 h were exposed to T‐DM1 (1 μg/mL) for an additional 72 h. Human epidermal growth factor receptor 2 (HER2), STAT3 and cleaved caspase 3 were detected on western blotting. IC50, 50% inhibitory concentration
3.5. LIFR overexpression induces STAT3 activation in BT‐474/KR cells
The STAT signaling is mainly activated by growth factor receptors and cytokine receptors in the plasma membrane.24 Accordingly, we next sought to determine which receptor was responsible for STAT3 activation in BT‐474/KR cells by assessing the phosphorylation (activation) status of various growth factor receptors. None, however, of the receptors tested—EGFR, HER3, c‐Met, and FGFR1—was activated in BT‐474/KR cells (Figure 5A). The absence of a role for growth factor receptors suggested that STAT3 activation might be attributable to the upregulation of cytokine receptors. Consistent with this possibility, an examination of STAT3 signaling‐associated cytokine receptors showed that LIFR protein level was increased in BT‐474/KR cells, whereas IL‐6R and GM‐CSFR, 2 cytokine receptors involved in cancer progression,25, 26 were almost unchanged (Figure 5A). LIFR overexpression was also detected at the mRNA level, despite little change in the expression of the receptor ligand, LIF (Figure 5B). To determine the relationship between overexpressed LIFR and aberrant STAT3 activation, we knocked down LIFR using 2 independent siRNAs. siRNA‐mediated LIFR knockdown significantly inhibited STAT3 activation (Figure 5C) and sensitized BT‐474/KR cells to T‐DM1 treatment (Figure 5D). Collectively, this suggests that T‐DM1 resistance is due, at least in part, to overexpression of LIFR and subsequent STAT3 activation.
Figure 5.
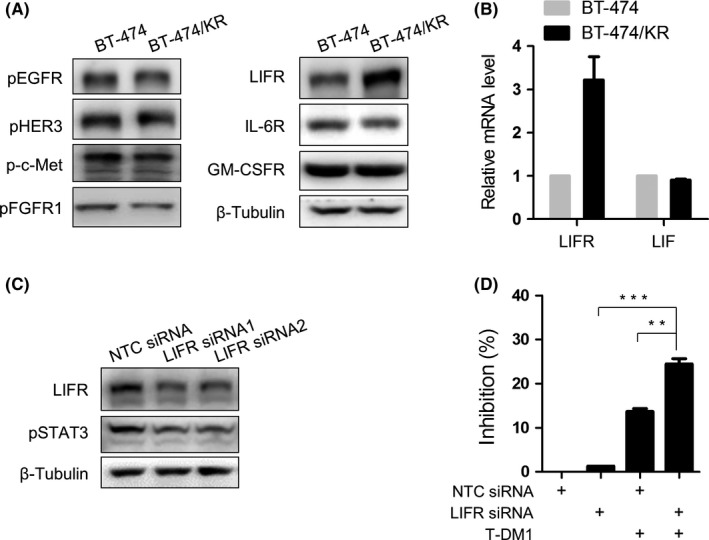
Leukemia inhibitory factor receptor (LIFR) overexpression leads to signal transducer and activator of transcription 3 (STAT3) activation and limits the anticancer effect of trastuzumab‐emtansine (T‐DM1). A, Phosphorylation of growth factor receptors and expression of cytokine receptors in BT‐474 and BT‐474/KR cells on western blotting. B, mRNA of LIFR and LIF in BT‐474 and BT‐474/KR cells on quantitative reverse transcription‐polymerase chain reaction. C, BT‐474/KR cells were transfected with either non‐targeting control (NTC) small interfering RNA (siRNA) or LIFR siRNA for 48 h. LIFR knockdown efficiency and STAT3 activation were measured on western blotting. D, BT‐474/KR cells were transfected with the indicated siRNA for 48 h, followed by treatment with T‐DM1 (0.1 μg/mL) for an additional 96 h. Cell survival was analyzed on sulforhodamine B assay. Error bars represent mean ± SD from triplicates. **P < .01, ***P < .001. GM‐CSFR, granulocyte‐macrophage colony‐stimulating factor receptor; IL‐6R, interleukin‐6 receptor; pEGFR, phospho‐EGFR; pFGFR1, phospho‐FGFR1; pHER3, phospho‐HER3
3.6. Factors secreted by BT‐474/KR cells confer resistance in BT‐474 cells
Signal transducer and activator of transcription 3 induces the expression of several cytokines and growth factors. Given that IL‐6 is a well‐known factor induced by STAT3,24 we analyzed IL‐6 expression as an indicator. On analysis of IL‐6 secretion on ELISA (Figure 6A) and of IL‐6 mRNA on real‐time PCR (Figure 6B), IL‐6 was increased in BT‐474/KR cells, indicating that secreted factors were induced in resistant cells. Because secreted factors induced by STAT3 could, in turn, activate STAT3, we incubated BT‐474 cells with conditioned media (CM) from BT‐474 or BT‐474/KR cells. CM from BT‐474/KR cells significantly induced phosphorylation of STAT3 in BT‐474 cells (Figure 6C). To extend these findings to a co‐culture context, we cultured BT‐474 and BT‐474/KR cells separately or as a 1:1 co‐culture. Lysates of BT‐474 and BT‐474/KR cultured separately were then mixed at 1:1 ratio, and the effect of this mixture on STAT3 activation was compared with that of lysates from co‐cultured cells. STAT3 phosphorylation in co‐cultured cells was remarkably higher than that in the mixture of cells cultured separately, consistent with a role for secreted factors in the activation of STAT3 in BT‐474/KR cells (Figure 6D). We further tested whether factors secreted by BT‐474/KR cells could cause acquired resistance to T‐DM1 in parental BT‐474 cells. As shown in Figure 6E,F, incubation of BT‐474 cells with CM from BT‐474/KR cells increased the number of T‐DM1‐resistant clones, highlighting a role for BT‐474/KR cell‐secreted factors in promoting drug resistance. This suggests that STAT3 activation in BT‐474/KR cells induces the expression and secretion of factors that lead to drug resistance in originally sensitive cells.
Figure 6.
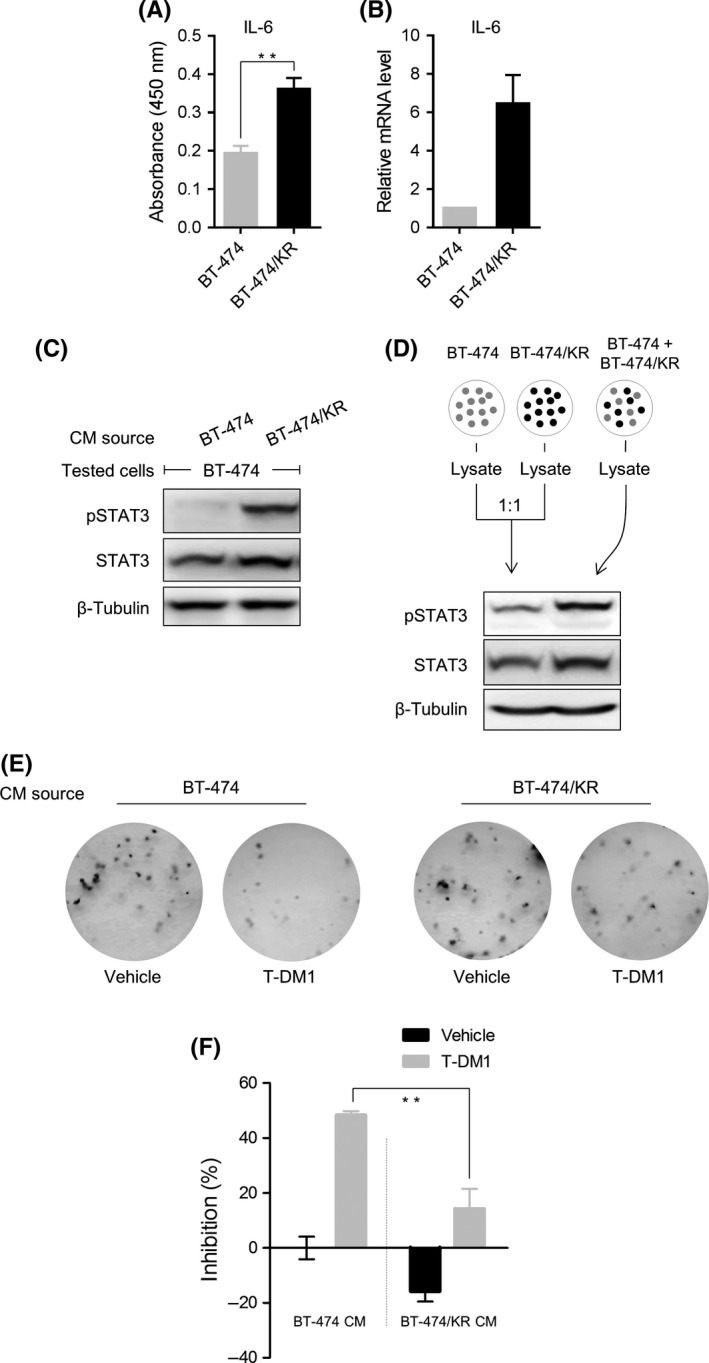
Factors secreted by BT‐474/KR cells confer resistance on BT‐474 cells. A, BT‐474 and BT‐474/KR cells were cultured for 96 h. Interleukin‐6 (IL‐6) level in the supernatants was analyzed on ELISA. B, mRNA level of IL‐6 in BT‐474 and BT‐474/KR cells was analyzed on quantitative reverse transcription‐polymerase chain reaction. C, BT‐474 cells were incubated with conditioned media (CM) from BT‐474 or BT‐474/KR cells for 24 h. Signal transducer and activator of transcription 3 (STAT3) activation was measured on western blotting. D, BT‐474 and BT‐474/KR cells were cultured separately, and lysates were mixed at a 1:1 ratio, or BT‐474 and BT‐474/KR cells were co‐cultured at a 1:1 ratio. STAT3 activation was measured on western blotting. E, BT‐474 cells were incubated in CM from BT‐474 or BT‐474/KR cells, with or without trastuzumab‐emtansine (T‐DM1; 30 ng/mL). Colonies were stained with crystal violet. F, The number of colonies formed in (E) was quantified; percent inhibition is expressed relative to colonies formed following incubation in CM from BT‐474 cells without T‐DM1 exposure. Error bars represent mean ± SD from triplicates. **P < .01
3.7. STAT3 inhibition overcomes T‐DM1 resistance in vivo
To extend these in vitro findings to an in vivo setting, we further performed xenograft studies. We first verified that the LIFR‐STAT3 pathway was enhanced in BT‐474/KR tumors compared with BT‐474 tumors. On immunohistochemistry, LIFR was overexpressed in BT‐474/KR tumors (Figure 7A). Moreover, pSTAT3 and its downstream effector c‐Myc27 were also significantly increased in BT‐474/KR tumors (Figure 7B). Notably, phospho‐STAT3 in BT‐474/KR tumors was significantly higher than in an equal amount of BT‐474/KR cells cultured in vitro, possibly owing to the persistent secretion of factors in vivo (Figure 7C). We then tested the ability of napabucasin to suppress STAT3 signaling in BT‐474/KR xenografts. We found that treatment with napabucasin effectively suppressed pSTAT3 and its downstream effector c‐Myc (Figure 7D), as previously reported.23 Finally, we tested whether inhibition of STAT3 with napabucasin was capable of overcoming T‐DM1 resistance in vivo. As shown in Figure 7E, mono‐treatment with either T‐DM1 (3 mg/kg) or napabucasin (20 mg/kg) led to only modest inhibition of tumor growth (20% and 19%, respectively), whereas combined treatment with both agents significantly improved tumor growth inhibition (52%). Collectively, these data confirm aberrant STAT3 activation in BT‐474/KR tumors and show that inhibition of STAT3 with napabucasin sensitizes BT‐474/KR tumors to T‐DM1 in vivo.
Figure 7.
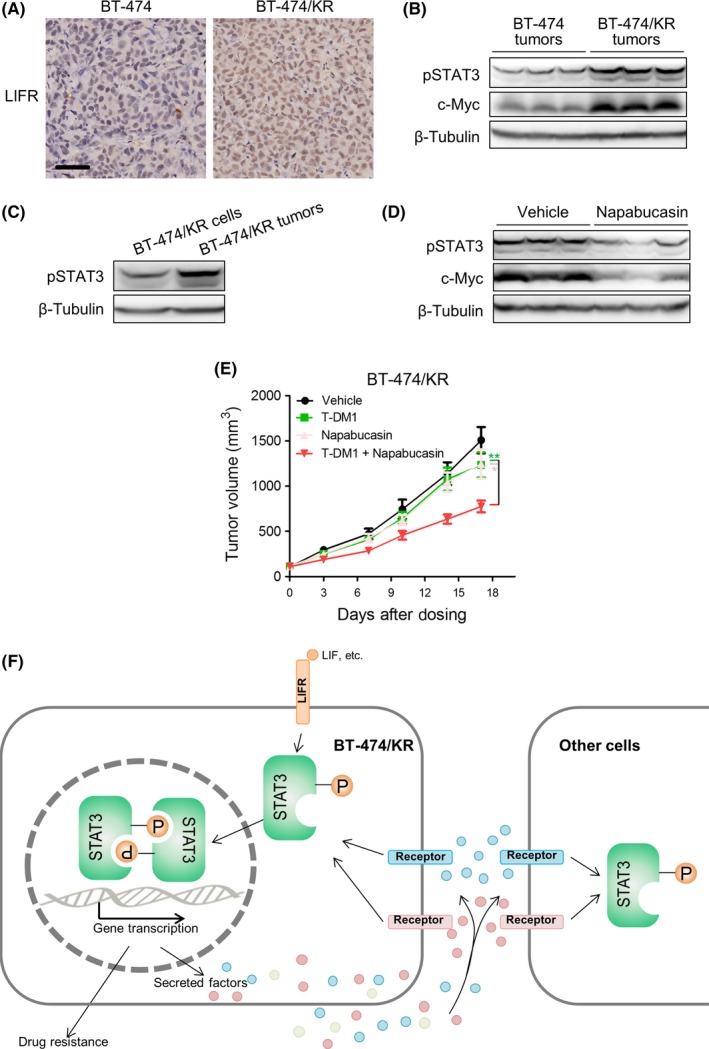
Signal transducer and activator of transcription 3 (STAT3) inhibition overcomes trastuzumab‐emtansine (T‐DM1) resistance in vivo. A, Leukemia inhibitory factor receptor (LIFR) expression was detected on immunohistochemistry. Scale bar, 50 μm. B, BT‐474 and BT‐474/KR xenograft tumors were lysed. C, BT‐474/KR xenograft tumors and an equal amount of BT‐474/KR cells were lysed. D, Mice bearing BT‐474/KR xenograft tumors were treated with vehicle or napabucasin. Tumors were isolated and lysed. B‐D, Phosphorylated (activated) STAT3 (pSTAT3) was measured on western blotting. E, Nude mice bearing BT‐474/KR xenograft tumors were treated with T‐DM1, napabucasin, or a combination of T‐DM1 and napabucasin for 17 days. Tumor volume was measured on the indicated days. Error bars represent mean ± SD. n = 8. *P < .05, **P < .01. F, Proposed model of T‐DM1 resistance in human epidermal growth factor receptor 2 (HER2)‐positive breast cancer
4. DISCUSSION
Trastuzumab‐emtansine shows remarkable activity in HER2‐positive breast cancers, but drug resistance inevitably occurs after long‐term treatment in most patients, highlighting the importance of understanding the mechanism underlying resistance to T‐DM1 and of developing new strategies to overcome it. Here, we modeled the development of acquired resistance in patients using the T‐DM1‐resistant cell line, BT‐474/KR, developed by exposing HER2‐overexpressing BT‐474 breast cancer cells to increasing concentrations of T‐DM1. We show for the first time that activated STAT3 mediated by LIFR overexpression confers resistance to T‐DM1. Notably, secreted factors induced by activated STAT3 in resistant cells limited responses to T‐DM1 in originally sensitive cells. The resistance to T‐DM1 could be overcome by napabucasin, a STAT3 inhibitor, both in vitro and in vivo (Figure 7F). These findings may facilitate the development of rational strategies to overcome T‐DM1 resistance in the clinic.
The LIF/LIFR axis is involved in a variety of biological responses, including growth promotion, cell differentiation, bone metabolism, and inflammation.28 Unlike receptor tyrosine kinases, LIFR is not self‐activated; its activation requires ligands such as LIF, ciliary neurotrophic factor, oncostatin M, cardiotrophin 1, and cardiotrophin‐like cytokine.29 On kinetic analysis, LIF‐LIFR interactions exhibit a near diffusion‐limited on‐rate and an extremely slow off‐rate, suggesting that the amount of LIFR expressed is the rate‐limiting factor for this process.30, 31 Notably, there is a growing appreciation of the importance of LIFR upregulation in limiting the potency of targeted therapies. For example, a recent study found that feedback activation of LIFR limits the response to histone deacetylase inhibitors in breast cancer.31 The present study adds to evidence supporting LIFR involvement in mediating resistance by demonstrating that overexpression of LIFR leads to STAT3 activation and confers resistance to T‐DM1 in HER2‐positive breast cancer cells. LIFR expression is regulated by many complex mechanisms, such as gene copy number changes, histone acetylation or methylation at the LIFR gene promoter, microRNA and so on.31, 32, 33 We found that the gene copy number of LIFR was not changed in BT‐474/KR cells (Figure S1), and the exact mechanisms underlining LIFR overexpression in BT‐474/KR cells needed further research.
Increasing evidence supports the critical role of STAT3 signaling in drug resistance. STAT3 activation upregulates several anti‐apoptotic proteins, including Bcl‐xL, Bcl‐2, survivin and Mcl‐1, and leads to apoptosis resistance.34 STAT3 activation was also found in HER2‐overexpressing breast cancer to promote epithelial‐mesenchymal transition (EMT) and cancer stem cell traits.35 Aberrant STAT3 activation has been implicated in trastuzumab resistance in HER2‐positive breast and gastric cancers.36 Moreover, STAT3 is involved in resistance to antimicrotubule agents, and the combination of taxane and a STAT3 inhibitor was showed to exert enhanced cytotoxicity towards STAT3‐dependent cell lines.37, 38 The present study first showed that STAT3 is aberrantly activated in cells exposed to long‐term treatment with T‐DM1 and confers cells resistance. Because T‐DM1 is an ADC consisting of trastuzumab and DM1, resistance of trastuzumab and antimicrotubule agents may both contribute to the resistance of T‐DM1. The FDA granted orphan drug designation to the STAT3 inhibitor napabucasin for the treatment of gastric and gastroesophageal junction cancer, and to SBT‐100, a novel anti‐STAT3 B VHH13 single‐domain antibody, for the treatment of pancreatic cancer in 2016. The present findings may facilitate the development of a combined STAT3 inhibitor and T‐DM1 therapy for HER2‐positive breast cancer.
Many STAT3‐regulated genes encode cytokines and growth factors,24 which in turn activate STAT3, promote cancer progression, and confer resistance to chemotherapeutic treatments.39 We found that STAT3 phosphorylation was significantly induced in BT‐474 cells following culture with CM from BT‐474/KR cells or co‐culture with BT‐474/KR cells. Notably, phospho‐STAT3 in BT‐474/KR tumors was remarkably higher than in an equal number of BT‐474/KR cells cultured in vitro, possibly reflecting the sustained secretion of factors in vivo. In addition, following inoculation of the same number of cells (1 × 10⁷ cells/mouse) into nude mice, BT‐474/KR cells formed tumors (100‐200 mm3) in nude mice in as few as 10 days, but BT‐474 cells required approximately 1 month to do so. Furthermore, BT‐474/KR tumors grew remarkably faster than BT‐474 tumors. This tumorigenic propensity of BT‐474/KR cells may be related to their sustained secretion of factors in vivo. Indeed, several factors induced by STAT3 activation, such as IL‐6, IL‐8, IL‐11, IL‐17 and IL‐23, were reported to promote tumor growth.24 The mechanisms include direct effects of secreted factors on cancer cells, for example, promoting cancer cell survival, regulating the self‐renewal of cancer stem cells, and inducing an EMT,40 and indirect effects, for example, promoting tumor angiogenesis,41 and perturbing immunosurveillance.42 In clinic, high IL‐6 has been correlated with poor survival in breast cancer patients, including those with HER2‐amplified breast tumors.43 Cancer cells are extremely heterogeneous, even in the same tumor.44 The present study has shown that, in a heterogeneous breast tumor, resistant cells with activated STAT3 might confer acquired resistance to originally sensitive cells by secreting cytokines and growth factors.
In conclusion, we report a novel mechanism in which LIFR overexpression activates STAT3, which in turn mediates T‐DM1 resistance in HER2‐positive breast cancer cells and induces the secretion of cytokines and growth factors. This further suggests that combining T‐DM1 with STAT3‐targeted therapy could be a promising treatment strategy for HER2‐positive breast cancer that progresses after T‐DM1.
CONFLICT OF INTEREST
The authors declare no conflicts of interest.
Supporting information
ACKNOWLEDGMENTS
This work was supported by grants from the National Natural Science Foundation of China (no. 81502636) and the Shanghai Science and Technology Committee (no. 14DZ2294100).
Wang L, Wang Q, Gao M, et al. STAT3 activation confers trastuzumab‐emtansine (T‐DM1) resistance in HER2‐positive breast cancer. Cancer Sci. 2018;109:3305–3315. 10.1111/cas.13761
REFERENCES
- 1. Ferlay J, Shin HR, Bray F, Forman D, Mathers C, Parkin DM. Estimates of worldwide burden of cancer in 2008: GLOBOCAN 2008. Int J Cancer. 2010;127:2893‐2917. [DOI] [PubMed] [Google Scholar]
- 2. Ponde N, Brandao M, El‐Hachem G, Werbrouck E, Piccart M. Treatment of advanced HER2‐positive breast cancer: 2018 and beyond. Cancer Treat Rev. 2018;67:10‐20. [DOI] [PubMed] [Google Scholar]
- 3. Ryan Q, Ibrahim A, Cohen MH, et al. FDA drug approval summary: lapatinib in combination with capecitabine for previously treated metastatic breast cancer that overexpresses HER‐2. Oncologist. 2008;13:1114‐1119. [DOI] [PubMed] [Google Scholar]
- 4. Fornier M, Esteva FJ, Seidman AD. Trastuzumab in combination with chemotherapy for the treatment of metastatic breast cancer. Semin Oncol. 2000;27:38‐45; discussion 92‐100. [PubMed] [Google Scholar]
- 5. Madrid‐Paredes A, Canadas‐Garre M, Sanchez‐Pozo A, Calleja‐Hernandez MA. Non‐HER2 signaling pathways activated in resistance to anti‐HER2 therapy in breast cancer. Breast Cancer Res Treat. 2015;153:493‐505. [DOI] [PubMed] [Google Scholar]
- 6. Martinez MT, Perez‐Fidalgo JA, Martin‐Martorell P, et al. Treatment of HER2 positive advanced breast cancer with T‐DM1: a review of the literature. Crit Rev Oncol Hematol. 2016;97:96‐106. [DOI] [PubMed] [Google Scholar]
- 7. Ritchie M, Tchistiakova L, Scott N. Implications of receptor‐mediated endocytosis and intracellular trafficking dynamics in the development of antibody drug conjugates. mAbs. 2013;5:13‐21. [DOI] [PMC free article] [PubMed] [Google Scholar]
- 8. Erickson HK, Park PU, Widdison WC, et al. Antibody‐maytansinoid conjugates are activated in targeted cancer cells by lysosomal degradation and linker‐dependent intracellular processing. Cancer Res. 2006;66:4426‐4433. [DOI] [PubMed] [Google Scholar]
- 9. Chari RV. Targeted cancer therapy: conferring specificity to cytotoxic drugs. Acc Chem Res. 2008;41:98‐107. [DOI] [PubMed] [Google Scholar]
- 10. Giordano SH, Temin S, Davidson NE. Systemic therapy for patients with advanced human epidermal growth factor receptor 2‐positive breast cancer: ASCO clinical practice guideline update summary. J Oncol Pract 2018;14:501‐504. [DOI] [PubMed] [Google Scholar]
- 11. Barok M, Joensuu H, Isola J. Trastuzumab emtansine: mechanisms of action and drug resistance. Breast Cancer Res. 2014;16:209. [DOI] [PMC free article] [PubMed] [Google Scholar]
- 12. Mercogliano MF, De Martino M, Venturutti L, et al. TNFalpha‐induced mucin 4 expression elicits trastuzumab resistance in HER2‐positive breast cancer. Clin Cancer Res. 2017;23:636‐648. [DOI] [PubMed] [Google Scholar]
- 13. Wang H, Wang W, Xu Y, et al. Aberrant intracellular metabolism of T‐DM1 confers T‐DM1 resistance in human epidermal growth factor receptor 2‐positive gastric cancer cells. Cancer Sci. 2017;108:1458‐1468. [DOI] [PMC free article] [PubMed] [Google Scholar]
- 14. Rios‐Luci C, Garcia‐Alonso S, Diaz‐Rodriguez E, et al. Resistance to the antibody‐drug conjugate T‐dm1 is based in a reduction in lysosomal proteolytic activity. Cancer Res. 2017;77:4639‐4651. [DOI] [PubMed] [Google Scholar]
- 15. Ambudkar SV, Kimchi‐Sarfaty C, Sauna ZE, Gottesman MM. P‐glycoprotein: from genomics to mechanism. Oncogene. 2003;22:7468‐7485. [DOI] [PubMed] [Google Scholar]
- 16. Sauna ZE, Kim IW, Ambudkar SV. Genomics and the mechanism of P‐glycoprotein (ABCB1). J Bioenerg Biomembr. 2007;39:481‐487. [DOI] [PubMed] [Google Scholar]
- 17. Wang L, Xu Y, Fu L, Li Y, Lou L. (5R)‐5‐hydroxytriptolide (LLDT‐8), a novel immunosuppressant in clinical trials, exhibits potent antitumor activity via transcription inhibition. Cancer Lett. 2012;324:75‐82. [DOI] [PubMed] [Google Scholar]
- 18. Quan H, Xu Y, Lou L. p38 MAPK, but not ERK1/2, is critically involved in the cytotoxicity of the novel vascular disrupting agent combretastatin A4. Int J Cancer. 2008;122:1730‐1737. [DOI] [PubMed] [Google Scholar]
- 19. Martinez MT, Perez‐Fidalgo JA, Martin‐Martorell P, et al. Treatment of HER2 positive advanced breast cancer with T‐DM1: a review of the literature. Crit Rev Oncol Hematol. 2016;97:96‐106. [DOI] [PubMed] [Google Scholar]
- 20. Nobili S, Landini I, Mazzei T, Mini E. Overcoming tumor multidrug resistance using drugs able to evade P‐glycoprotein or to exploit its expression. Med Res Rev. 2012;32:1220‐1262. [DOI] [PubMed] [Google Scholar]
- 21. Lewis Phillips GD, Li G, Dugger DL, et al. Targeting HER2‐positive breast cancer with trastuzumab‐DM1, an antibody‐cytotoxic drug conjugate. Can Res. 2008;68:9280‐9290. [DOI] [PubMed] [Google Scholar]
- 22. Junttila TT, Li GM, Parsons K, Phillips GL, Sliwkowski MX. Trastuzumab‐DM1 (T‐DM1) retains all the mechanisms of action of trastuzumab and efficiently inhibits growth of lapatinib insensitive breast cancer. Breast Cancer Res Treat. 2011;128:347‐356. [DOI] [PubMed] [Google Scholar]
- 23. Li Y, Rogoff HA, Keates S, et al. Suppression of cancer relapse and metastasis by inhibiting cancer stemness. Proc Natl Acad Sci USA. 2015;112:1839‐1844. [DOI] [PMC free article] [PubMed] [Google Scholar]
- 24. Yu H, Pardoll D, Jove R. STATs in cancer inflammation and immunity: a leading role for STAT3. Nat Rev Cancer. 2009;9:798‐809. [DOI] [PMC free article] [PubMed] [Google Scholar]
- 25. Kumari N, Dwarakanath BS, Das A, Bhatt AN. Role of interleukin‐6 in cancer progression and therapeutic resistance. Tumour Biol. 2016;37:11553‐11572. [DOI] [PubMed] [Google Scholar]
- 26. Oshika Y, Nakamura M, Abe Y, et al. Growth stimulation of non‐small cell lung cancer xenografts by granulocyte‐macrophage colony‐stimulating factor (GM‐CSF). Eur J Cancer. 1998;34:1958‐1961. [DOI] [PubMed] [Google Scholar]
- 27. Chodorowska G, Glowacka A, Tomczyk M. Leukemia inhibitory factor (LIF) and its biological activity. Ann Univ Mariae Curie Sklodowska Med. 2004;59:189‐193. [PubMed] [Google Scholar]
- 28. Nicola NA, Babon JJ. Leukemia inhibitory factor (LIF). Cytokine Growth Factor Rev. 2015;26:533‐544. [DOI] [PMC free article] [PubMed] [Google Scholar]
- 29. Yu H, Lee H, Herrmann A, Buettner R, Jove R. Revisiting STAT3 signalling in cancer: new and unexpected biological functions. Nat Rev Cancer. 2014;14:736‐746. [DOI] [PubMed] [Google Scholar]
- 30. Hilton DJ, Nicola NA. Kinetic analyses of the binding of leukemia inhibitory factor to receptor on cells and membranes and in detergent solution. J Biol Chem. 1992;267:10238‐10247. [PubMed] [Google Scholar]
- 31. Zeng H, Qu J, Jin N, et al. Feedback activation of leukemia inhibitory factor receptor limits response to histone deacetylase inhibitors in breast cancer. Cancer Cell. 2016;30:459‐473. [DOI] [PubMed] [Google Scholar]
- 32. Lv S, Ji L, Chen B, et al. Histone methyltransferase KMT2D sustains prostate carcinogenesis and metastasis via epigenetically activating LIFR and KLF4. Oncogene. 2018;37:1354‐1368. [DOI] [PMC free article] [PubMed] [Google Scholar]
- 33. Salm F, Dimitrova V, von Bueren AO, et al. The phosphoinositide 3‐kinase p110alpha isoform regulates leukemia inhibitory factor receptor expression via c‐myc and miR‐125b to promote cell proliferation in medulloblastoma. PLoS One. 2015;10:e0123958. [DOI] [PMC free article] [PubMed] [Google Scholar]
- 34. Fathi N, Rashidi G, Khodadadi A, Shahi S, Sharifi S. STAT3 and apoptosis challenges in cancer. Int J Biol Macromol. 2018;117:993‐1001. [DOI] [PubMed] [Google Scholar]
- 35. Chung SS, Giehl N, Wu Y, Vadgama JV. STAT3 activation in HER2‐overexpressing breast cancer promotes epithelial‐mesenchymal transition and cancer stem cell traits. Int J Oncol. 2014;44:403‐411. [DOI] [PMC free article] [PubMed] [Google Scholar]
- 36. Sonnenblick A, Brohee S, Fumagalli D, et al. Constitutive phosphorylated STAT3‐associated gene signature is predictive for trastuzumab resistance in primary HER2‐positive breast cancer. BMC Med. 2015;13:177. [DOI] [PMC free article] [PubMed] [Google Scholar]
- 37. Zhang Z, Wang A, Li H, Zhi H, Lu F. STAT3‐dependent TXNDC17 expression mediates Taxol resistance through inducing autophagy in human colorectal cancer cells. Gene. 2016;584:75‐82. [DOI] [PubMed] [Google Scholar]
- 38. Wang WJ, Li CF, Chu YY, et al. Inhibition of the EGFR/STAT3/CEBPD axis reverses cisplatin cross‐resistance with paclitaxel in the urothelial carcinoma of the urinary bladder. Clin Cancer Res. 2017;23:503‐513. [DOI] [PubMed] [Google Scholar]
- 39. Jones VS, Huang RY, Chen LP, Chen ZS, Fu L, Huang RP. Cytokines in cancer drug resistance: cues to new therapeutic strategies. Biochem Biophys Acta. 2016;1865:255‐265. [DOI] [PubMed] [Google Scholar]
- 40. Korkaya H, Kim GI, Davis A, et al. Activation of an IL6 inflammatory loop mediates trastuzumab resistance in HER2+ breast cancer by expanding the cancer stem cell population. Mol Cell. 2012;47:570‐584. [DOI] [PMC free article] [PubMed] [Google Scholar]
- 41. Conroy S, Kruyt FAE, Wagemakers M, Bhat KPL, den Dunnen WFA. IL‐8 associates with a pro‐angiogenic and mesenchymal subtype in glioblastoma. Oncotarget. 2018;9:15721‐15731. [DOI] [PMC free article] [PubMed] [Google Scholar]
- 42. Freire T, Lo‐Man R, Bay S, Leclerc C. Tn glycosylation of the MUC6 protein modulates its immunogenicity and promotes the induction of Th17‐biased T cell responses. J Biol Chem. 2011;286:7797‐7811. [DOI] [PMC free article] [PubMed] [Google Scholar]
- 43. Bachelot T, Ray‐Coquard I, Menetrier‐Caux C, Rastkha M, Duc A, Blay JY. Prognostic value of serum levels of interleukin 6 and of serum and plasma levels of vascular endothelial growth factor in hormone‐refractory metastatic breast cancer patients. Br J Cancer. 2003;88:1721‐1726. [DOI] [PMC free article] [PubMed] [Google Scholar]
- 44. Meacham CE, Morrison SJ. Tumour heterogeneity and cancer cell plasticity. Nature. 2013;501:328‐337. [DOI] [PMC free article] [PubMed] [Google Scholar]
Associated Data
This section collects any data citations, data availability statements, or supplementary materials included in this article.
Supplementary Materials