

Abstract
Human anti‐programmed death‐1 (PD‐1) antibody possesses the capability to revitalize host T cells and has been an effective therapy for metastatic malignant melanoma (MM). The precise subsets of T cells predominantly activated by anti‐PD‐1, however, have not yet been clarified. In this study, peripheral blood mononuclear cells obtained from MM patients scheduled to receive anti‐PD‐1 (nivolumab) therapy, and healthy subjects (HS), were systematically examined on flow cytometry to identify changes in the proportion of immune cell subsets. Compared with HS, MM patients prior to therapy had an increased proportion of activated CD8+ T cells with effector memory phenotypes (Tem), and PD‐1 positive subsets of CD4+ central memory T cells (Tcm) and T‐helper (Th)17 cells. After a single course of anti‐PD‐1 therapy, MM patients had an increase in activated Tem and Tcm subsets of CD4+ and CD8+ T cells, and activated Th1 plus T‐helper follicular 1 cells. There was no consistent change in the proportion of Tfh cells, B cells, natural killer cells, or dendritic cells. The observed activated phenotypes were attenuated during the course of therapy, but regulatory T cells belonging to the CD3+CD4+CD45RO+CD25high fraction increased at disease progression. Taken together, anti‐PD‐1 therapy modulates systemic immune reactions and exerts anti‐tumor effects, not only by revitalizing Tem and Tcm of CD4+ and CD8+ T cells, but also via a shift to a Th1 phenotype.
Keywords: immune cell, lymphocyte, malignant melanoma, nivolumab, peripheral blood
1. INTRODUCTION
Tumor antigen‐specific immune reactions in the host induce tumor growth suppression and can lead to its eradication. Tumor antigens are incorporated by antigen‐presenting cells (APC), such as dendritic cells (DC), and are presented to naïve T cells (Tn) in the secondary lymphoid organs. The T cells sensitized by tumor antigens subsequently leave these organs and reach tumor tissues via the systemic circulation.1 The proportion of tumor antigen‐specific T cells among the tumor‐infiltrating lymphocyte (TIL) population is thought to increase by selective homing and proliferation in the tumor tissue, and the immune cell composition is thus often different to that of the peripheral blood.2 The precise composition of TIL can be correlated with the prognosis of various types of cancer, including malignant melanoma (MM).3 In contrast, the immune cell composition of the peripheral blood does not necessarily reflect anti‐tumor activity because it is influenced by systemic conditions. Despite the fact that a correlation between peripheral blood immune cell composition and anti‐tumor activity has not been clearly established, profiling of peripheral blood lymphocytes is attractive because it can potentially provide a frequent and comprehensive analysis of ongoing anti‐tumor immune activity in patients. In the case of MM patients, peripheral blood CD16‐ natural killer (NK) cells are expanded and monocytes decreased compared with healthy subjects (HS).4, 5
Programmed death‐1 (PD‐1) is a type I membrane glycoprotein of 50‐55 kD expressed on the cell surface of T cells and B cells.6 In T cells, the expression of PD‐1 protein is promoted by antigen presentation. Additionally, in patients with chronic infection or cancer, PD‐1 is strongly expressed on exhausted T cells, which are mainly induced by continuous activation signaling. PD‐1‐expressing T cells receive an inhibitory signal after binding to the ligands PD‐L1 and PD‐L2, expressed on APC and tumor cells, resulting in the suppression of proliferation, cytokine production, and cytotoxic activity.7 Human anti‐PD‐1 antibody has been developed as an anti‐tumor agent and exhibits remarkable efficacy in the treatment of MM, non‐small cell lung cancer, renal cell carcinoma, lymphoma, and head and neck cancer.8 The human anti‐PD‐1 antibody, nivolumab, demonstrated a significant survival benefit in chemotherapy‐refractory MM and in first‐line chemotherapy for MM compared with dacarbazine.9, 10
Anti‐PD‐1 antibody is thought to activate tumor‐specific T cells by interfering with the ligation of PD‐1 expressed on tumor‐specific CD8+ T cells, and PD‐L1/L2 on tumor cells. Thus, modulation of PD‐1‐positive T cells in the tumor site has been thought to be a major aspect of the effectiveness of the PD‐1 blockade strategy.7 In addition, PD‐1‐expressing T cells are observed in secondary lymphoid organs. Activated effector T cells (Te), induced by antigen presentation by APC, express PD‐1, and cytotoxic T‐lymphocyte‐associated protein 4 (CTLA‐4).11 Therefore, in cancer patients receiving anti‐PD‐1 therapy, anti‐tumor effects may be both directly and indirectly attributable to the inhibition of regulatory signaling in not only PD‐1‐positive TIL, but also PD‐1‐positive T cells in the secondary lymphoid organs and peripheral blood. The effects of anti‐PD‐1 on T cell subsets other than TIL, and the subsequent impact on the systemic immune system, however, have not yet been elucidated. In the present study, we systematically analyzed peripheral blood immune cell subsets obtained from MM patients before and after anti‐PD‐1 therapy, referencing standardized assays from the Human Immunology Project,12 and demonstrate that PD‐1 blockade induces activation of effector memory T cells (Tem) and central memory T cells (Tcm) of CD4+ and CD8+ T cells, and T‐helper (Th)1 cells, and can modulate systemic anti‐tumor immunity.
2. MATERIALS AND METHODS
2.1. Patients
A total of 10 patients with advanced MM who were scheduled to receive the anti‐PD‐1 antibody nivolumab, from January 2015 to May 2017 at Kyushu University Hospital, Fukuoka, Japan, were registered. Nivolumab treatment was carried out following standard methods. I.v. nivolumab (3 or 2 mg/kg bodyweight) was given every 2 or 3 weeks, and continued until the occurrence of significant tumor progression, intolerable adverse events, refusal by the patient, or doctor decision to withdraw treatment. Efficacy of the therapy was assessed on a combination of physical examination, radiology (including computed tomography and magnetic resonance imaging), and gastrointestinal endoscopy, according to the response evaluation criteria in solid tumors (RECIST) version 1.1.13 In the case of adverse events, appropriate treatment was given, and anti‐PD‐1 therapy was delayed until recovery from the event. Medical information from each patient was examined using electronic records. Items surveyed in this study included: age, sex, Eastern Cooperative Oncology Group (ECOG) performance status, primary tumor site, BRAF mutation status, and the number of previous systemic treatments. Details of anti‐PD‐1 therapy and patient survival were also examined. The study was approved by the ethics committee of Kyushu University Hospital and performed according to the guidelines for biomedical research specified in the Declaration of Helsinki. Each patient provided written informed consent for participating in this study. Blood samples of HS were obtained from volunteers after obtaining written informed consent.
2.2. Cells
Acid citrate dextrose solution‐added peripheral blood (14 mL) was obtained from each patient prior to anti‐PD‐1 antibody in each treatment cycle. Peripheral blood mononuclear cells (PBMC) were separated by centrifugation with Ficoll (Ficoll‐Paque, GE Healthcare, Little Chalfont, UK), washed twice with PBS containing 2% FBS and EDTA (designated as FACS buffer), and then resuspended in FACS buffer at 4°C for subsequent flow cytometry.
2.3. Flow cytometry
A total of 5 × 10⁵ PBMC in 50 μL FACS buffer were incubated with fluorescence‐conjugated antibodies at a final concentration of 1‐5 μg/mL for 30 minutes on ice. Then the cells were washed with FACS buffer, resuspended in 200 μL FACS buffer, and analyzed. Flow cytometry was performed using the FACSAria III (BD Bioscience, Tokyo, Japan). Data were analyzed with Flow Jo version 9 (Tomy Digital Biology, Tokyo, Japan). The different sets of monoclonal antibodies used for the analysis of immune cell populations are listed as follows: panel A (for the detection of memory T cells and activated phenotypes), FITC‐CCR7/CD197 (G043H7, BD), PE‐CD38 (HB‐7, BD), PE‐Cy7‐CD3 (UCTH1, BD), APC‐CD8 (SK1, BD), APC‐Cy7‐CD45RA (HI100, BioLegend, San Diego, CA, USA), BV421‐HLA‐DR (G46‐6, BD), and BV510‐CD4 (SK3, BD); panel B (for the detection of T‐helper (Th) cells, T‐helper follicular (Tfh) cells, and PD‐1 expression), FITC‐CCR7/CD197 (G043H7, BD), PE‐PD1/CD279 (EH12.2H7, BD), PerCP‐Cy5.5‐CD14 (M5E2, BD), PerCP‐Cy5.5‐CD8 (SK1, BD), PE‐Cy7‐CCR6/CD196 (G034E3, BioLegend), APC‐CXCR3/CD183 (G025H7, BioLegend), APC‐Cy7‐CD45RA (HI100, BioLegend), BV421‐CXCR5/CD185 (RF8B2, BD), and BV510‐CD4 (SK3, BD); panel C (for the detection of activated phenotypes of Th and Tfh cells), FITC‐CD3 (UCTH1, BD), PE‐CD38 (HB‐7, BD), PE‐Cy7‐CCR6/CD196 (G034E3, BioLegend), APC‐CXCR3/CD183 (G025H7, BioLegend), APC‐Cy7‐CD8 (SK1, BD), BV421‐HLA‐DR (G46‐6, BD), and BV510‐CD4 (SK3, BD); panel D (for the detection of regulatory T cells [Treg]), FITC‐CD45RO (UCHL1, BD), PE‐CD127 (HIL‐7R‐M21, BD), PerCP‐Cy5.5‐CD8 (SK1, BD), PerCP‐Cy5.5‐CD14 (M5E2, BD), PE‐Cy7‐CCR4/CD194 (L291H4, BioLegend), APC‐CD25 (BC96, BioLegend), BV421‐HLA‐DR (G46‐6, BD), APC‐Cy7‐CD3 (SK7, BioLegend), and BV510‐CD4 (SK3, BD); panel E (for the detection of B cells), FITC‐IgD (IA6‐2, BD), PE‐CD24 (ML5, BD), PerCP‐Cy5.5‐CD14 (M5E2, BD), PE‐Cy7‐CD20 (2H7, BD), APC‐CD27 (M‐T271, BD), APC‐Cy7‐CD3 (SK7, BioLegend), BV421‐CD19 (HIB19, BD), and BV510‐CD38 (HIT2, BD); and panel F (for the detection of NK cells, DC and monocytes), FITC‐CD11c (B‐ly6, BD), PE‐HLA‐DR (G46‐6, BD), PerCP‐Cy5.5‐CD3 (UCTH1, BioLegend), PE‐Cy7‐CD123 (7G3, BD), APC‐CD19 (HIB19, BioLegend), APC‐Cy7‐CD16 (3G8, BD), BV421‐CD56 (NCAM16.2, BD), and BV510‐CD14 (MφP9, BD).
2.4. Cytokine production
Selected T‐cell subsets, including memory CD4+ or CD8+ T cells and Th1 cells, were sorted using the FACSAria III. Cells (1 × 10⁴) were then cultured with 0.25 μL Dynabeads Human CD3/CD28 T‐Activator (Thermo Fisher Scientific, Waltham, MA, USA) in 96‐well plates for 48 hours. Cytokine concentration in the supernatant was measured using the LEGENDplex Human Th Panel (13‐plex; BioLegend) according to the manufacturer's recommendations and analyzed using the FACSAria III and the BioLegend LEGENDplex software.
2.5. Statistical analysis
Comparison of baseline characteristics between HS and MM patients was performed using Wilcoxon rank sum test. Comparison between samples obtained before treatment and after each cycle of anti‐PD‐1 antibody treatment was performed using the Wilcoxon signed‐rank test. Comparison between samples obtained before treatment and after confirmation of the best clinical response was performed using the Steel–Dwass test. Progression‐free survival (PFS) was examined using Kaplan–Meier curves and analyzed on log‐rank test. P < 0.05 was considered statistically significant. All statistical analysis was carried out using JMP (SAS Institute Japan, Tokyo, Japan).
3. RESULTS
3.1. Patients
Ten advanced MM patients were registered for this study. Median age was 73 years (range, 57‐85 years), and the group included 4 women (Table 1). Five patients had melanoma of the skin, 4 patients had mucosal melanoma, and 1 had melanoma of unknown origin. Seven patients received nivolumab as first‐line therapy and 3 patients received nivolumab as later therapy. The median number of nivolumab therapy cycles was 6 (range, 3‐29 cycles). Treatment efficacy was observed as partial response (PR) in 1 patient, stable disease (SD) in 5 patients, and progressive disease (PD) in 4 patients. All 10 patients eventually discontinued nivolumab therapy, for reasons of either PD (8 patients, 80%), adverse events (1 patient, 10%), or deterioration of performance status (1 patient, 10%). The median follow‐up period was 274 days (range, 76‐577 days). Median PFS was 123 days (95%CI: 65‐259 days) and median overall survival (OS) was 544 days (95%CI: 76‐not reached). Severe adverse events associated with nivolumab were observed in 2 patients, specifically type I diabetes mellitus and refractory bi‐cytopenia (1 patient each). Twelve HS were registered for this study. The median age of HS was 75 years (range, 61‐84 years); the HS also included 4 women. Age distribution and the ratio of male and female did not differ between the MM and HS cohorts.
Table 1.
Patient characteristics and clinical course
| Characteristic | n = 10 Median (range), n (%) or †median (95%CI) |
|---|---|
| Baseline characteristics | |
| Age (years) | 73 (57‐85) |
| Sex | |
| Male | 6 (60) |
| Female | 4 (40) |
| ECOG PS | |
| 0 | 7 (70) |
| 1 | 1 (10) |
| 2 | 2 (20) |
| BRAF status (V600) | |
| Mutant | 2 (20) |
| Wild type | 4 (40) |
| Unknown | 4 (40) |
| Site of primary tumor | |
| Skin | 5 (50) |
| Mucosa | 4 (40) |
| Unknown | 1 (10) |
| M stage | |
| M0 | 1 (10) |
| M1 | 9 (90) |
| Baseline LDH | |
| ≤ULN | 5 (50) |
| >ULN | 5 (50) |
| No. previous systemic treatments | |
| 0 | 7 (70) |
| 1 | 1 (10) |
| >2 | 2 (20) |
| Clinical courses | |
| Dose | |
| 2 mg/kg every 3 weeks | 7 (70) |
| 3 mg/kg every 2 weeks | 3 (30) |
| No. cycles nivolumab | 6 (3‐29) |
| Efficacy | |
| ORR | 10 |
| DCR | 60 |
| PFS (days) | 123 (65‐259)† |
| Reasons for discontinuation of nivolumab | |
| Progressive disease | 8 (80) |
| Adverse events | 1 (10) |
| Deterioration of PS | 1 (10) |
†95%CI, 95% confidence interval.
DCR, disease control rate; ECOG, Eastern Cooperative Oncology Group; LDH, lactate dehydrogenase; ORR, overall response rate; PFS, progression‐free survival; PS, performance status; ULN, upper limit of normal.
A peripheral blood sample prior to nivolumab therapy could not be obtained from 1 patient, while the assessment of Treg cells and PD‐1 expression was not possible for another patient. Therefore, the data prior to nivolumab therapy were analyzed from a total of 9 MM patients, and the data relating to PD‐1 expression and Treg were analyzed from 8 patients.
3.2. Immune cell phenotypes: HS vs MM patients
Peripheral blood immune cell subsets obtained from HS and MM patients prior to anti‐PD‐1 therapy were analyzed on flow cytometry (Figure 1). The proportion of CD3+CD4+ T cells in the CD3+ population was equivalent in both HS and MM groups (Figure 1A,B). The proportions of CD4+ T subsets, consisting of Tn (CD3+CD4+CCR7+CD45RA+), Tcm (CD3+CD4+CCR7+CD45RA‐), and Tem (CD3+CD4+CCR7‐CD45RA‐) were also similar between the 2 groups. There were significantly fewer Te (CD3+CD4+CCR7‐CD45RA+) in MM patients than HS (Figure 1A‐D).
Figure 1.
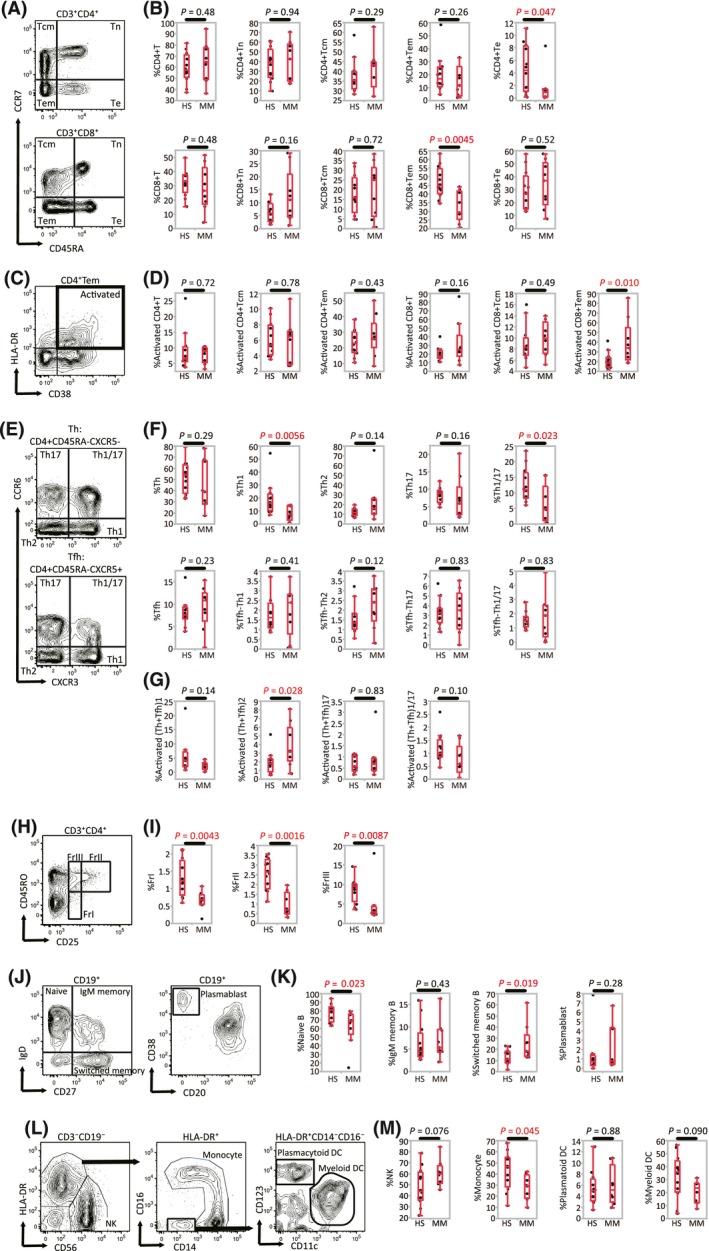
Comparison of immune cell phenotypes between healthy subjects (HS, n = 12) and malignant melanoma patients (MM, n = 9). A, Representative gating strategies used for T cell subsets: naive T cells (Tn), central memory T cells (Tcm), effector memory T cells (Tem), and effector T cells (Te). B, Percentage of CD4+(CD8+) T cells among CD3+ lymphocytes, and percentage of CD3+CD4+(CD8+) Tn, Tcm, Tem, and Te cells among CD3+CD4+(CD8+) T lymphocytes. C, Representative gating strategy used for cells with an activated phenotype (CD38+HLA‐DR+). D, Percentage of cells with an activated phenotype among CD4+(CD8+) Tcm and Tem. E, Representative gating strategies for subsets of T‐helper (Th) and T‐helper follicular (Tfh) cells. Subsets were: Th1, Th2, Th17, and Th1/17. F, Percentage of Th and Tfh subsets among CD4+ T lymphocytes. G, Percentage of activated Th subsets (Th plus Tfh) among CD4+ T lymphocytes. H, Representative gating strategy for regulatory T‐cell (Treg) subsets: fraction (Fr)I, FrII, and FrIII. I, Percentage of each Treg fraction among CD4+ T cells. J, Representative gating strategies for B‐cell subsets: naïve B cells, IgM memory B cells, switched memory B cells or plasmablasts. K, Percentage of switched memory B cells and plasmablasts among CD19+ B cells. L, Representative gating strategies for natural killer (NK) cells, monocytes, and dendritic cells (DC). M, Percentage of NK cells, monocytes and DC among CD3‐CD19‐ mononuclear cells [Correction added on 24 September 2018, after first online publication: The missing X axis labels and missing symbols were added to Figure 1.]
The proportion of CD3+CD8+ T cells in the CD3+ population was equivalent in HS and MM patients, but a significant decrease in CD8+ Tem was observed. In terms of activated phenotypes (ie expression of CD38 and HLA‐DR) in the CD8+ T cells, Tcm, and Tem, the proportion of activated CD8+ Tem was significantly increased in MM patients (Figure 1B,D). These data suggest that while the overall proportion of CD8+ Tem decreased in MM patients, most of the subsets were in an activated state.
The proportions of CD45RA‐CXCR5‐CXCR3+CCR6‐ (Th1) and CD45RA‐CXCR5‐CXCR3+CCR6+ (Th1/17) cells in the CD4+ T population were significantly lower in MM patients compared with HS, while the proportions of CD45RA‐CXCR5‐CXCR3‐CCR6‐ T cells (Th2) and CD45RA‐CXCR5‐CXCR3‐CCR6+ T cells (Th17) were similar between the 2 groups (Figure 1E,F). In the analysis of Tfh subsets, defined by CD4+CD45RA‐CXCR5+, the proportion of Tfh cells in the CD4+ population did not differ between the cohorts. Indeed, all Tfh subsets, including Tfh‐Th1, Tfh‐Th2, Tfh‐Th17, and Tfh‐Th1/17, were similar in proportion between the 2 groups (Figure 1F). The proportion of activated T‐helper subsets (Th2 plus Tfh2) in the CD4+ population was significantly higher in MM patients than in HS (Figure 1G).
We next examined the numbers of Treg in the CD4+ T cell population (Figure 1H,I). Significantly lower levels of all Treg fractions, namely fraction I Treg (FrI, CD3+CD4+CD45RO‐CD25dim), fraction II Treg (FrII; CD3+CD4+CD45RO+CD25high), and fraction III Treg (FrIII; CD3+CD4+CD45RO+CD25dim), were observed in MM patients compared with HS (Figure 1I). We also examined the expression of CCR4 in each of the Treg fractions. The median proportion of CCR4 positivity in Treg FrII cells in HS and in MM patients was 98.5% and 94.8%, respectively (P = 0.169). The median proportion of CCR4 positivity in FrI and in FrIII cells was 22.4% and 89.3% in HS, and 23.4% and 76.7% in MM patients, respectively. Therefore, Treg FrII cells in this study were considered to represent effector regulatory T cells.
In the analysis of B cells, naïve B cells (CD19+IgD+CD27‐) were found to be significantly decreased, and switched memory B cells (CD19+IgD‐CD27+) increased, in MM patients. IgM memory B cells (CD19+IgD+CD27+), transitional B cells (CD19+CD24+CD38+), and plasmablasts (CD19+CD20‐CD38high) showed no differences between MM patients and HS (Figure 1J,K). The proportion of monocytes (CD3‐CD19‐HLA‐DR+CD14low/+) in the non‐T, non‐B immune cells was lower in MM patients, while there was no difference in the level of NK cells (CD3‐CD19‐CD56+), plasmacytoid DC (HLA‐DR+CD14‐CD123+) or myeloid DC (HLA‐DR+CD14‐CD11c+CD123‐) between HS and MM patients (Figure 1L,M). Taken together, these data indicate that the peripheral blood immune cell profile of MM patients is defined by an increase in activated CD8+ Tem, and Th2 plus Tfh2 cells, together with a decrease in the number of Th1 cells.
3.3. PD‐1 expression in each cell population
To assess the exhaustion status of lymphocyte populations in HS and MM patients, we measured the expression of PD‐1 in these cells (Figure 2). In CD4+ T cells, the proportion of PD‐1‐expressing cells did not differ between the 2 cohorts. The level of PD‐1 expression in CD4+ Tcm and CD4+ Th17 cells, however, was significantly higher in MM patients than in HS (Figure 2B,C). This suggest that the central memory CD4+ T cells in MM patients have a more prominent exhaustion phenotype than those in HS.
Figure 2.
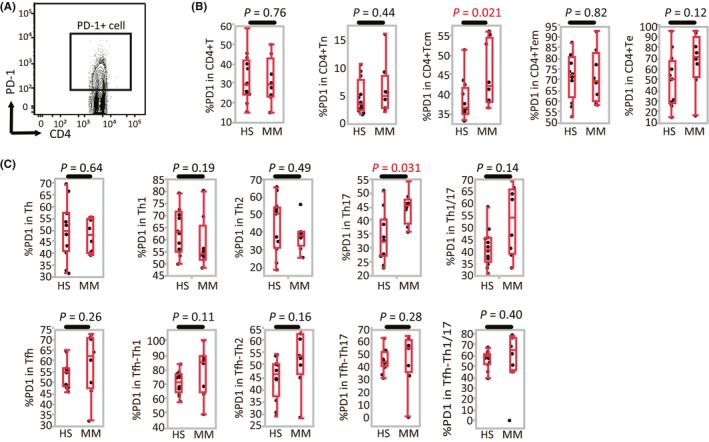
Programmed death (PD)‐1 expression in each cell population (health subjects [HS], n = 12; malignant melanoma [MM], n = 8). A, Representative gating strategy used for PD‐1 expression. B, Percentage of PD‐1 expression among CD4+ T lymphocytes, naive T cells (Tn), central memory T cells (Tcm), effector memory T cells (Tem), and effector T cells (Te). C, Percentage of PD‐1 expression in T‐helper (Th) and T‐helper follicular (Tfh) subsets [Correction added on 24 September 2018, after first online publication: The missing X axis labels were added to Figure 2.]
3.4. Change in immune cell phenotype after anti‐PD‐1 antibody treatment
We then assessed the change in peripheral blood immune cell subsets in 9 MM patients, prior to, and after 1 cycle of, anti‐PD‐1 antibody treatment. The changes in the proportions of CD4+ T cells and CD8+ T cells in the CD3+ T cell population varied in each patient but did not show significant trends. Neither did the proportions of Tn, Tcm, Tem, and Te subsets in the CD4+ and CD8+ T cell populations show differences after 1 cycle of treatment (Figure 3A). Activated CD4+ or CD8+ T cells increased after anti‐PD‐1 antibody treatment, however, particularly the Tcm and Tem phenotypes (Figure 3B).
Figure 3.
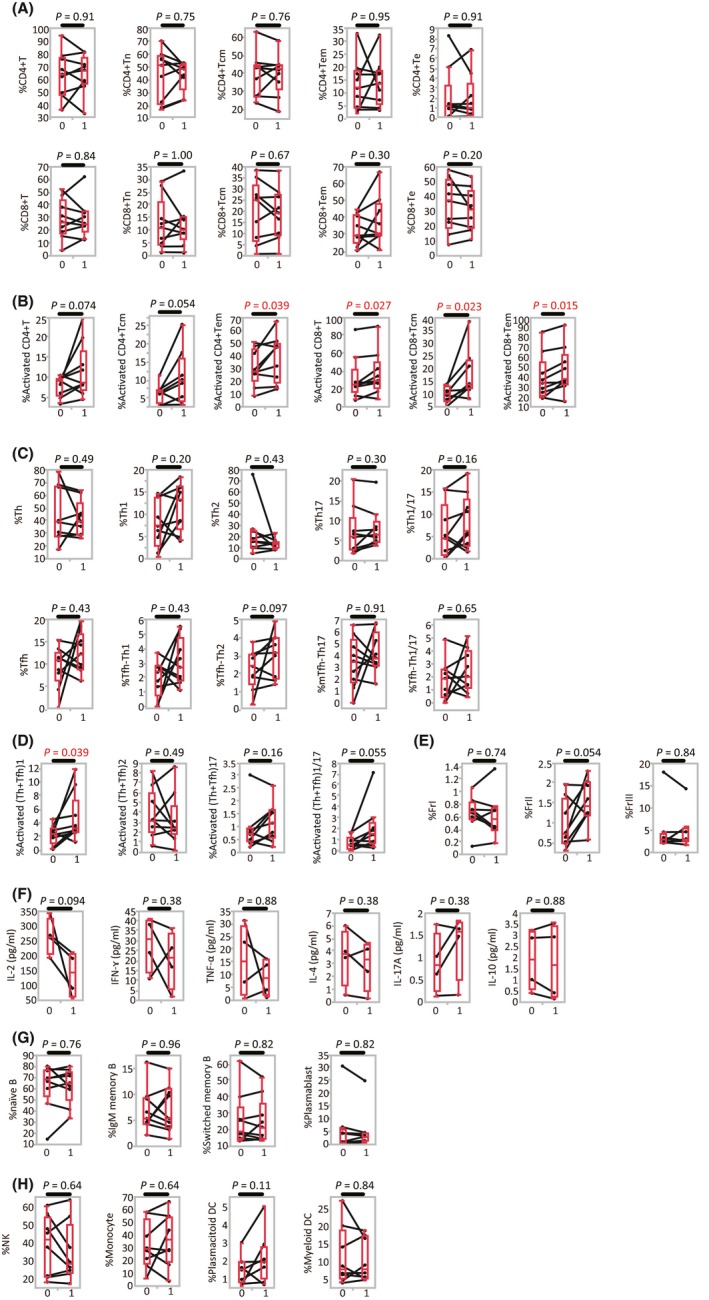
Change in immune cell phenotypes after anti‐programmed death (anti‐PD)‐1 antibody treatment (n = 9). A, Proportion of CD4+(CD8+) T cells among CD3+ T lymphocytes, and CD4+(CD8+) naive T cells (Tn), central memory T cells (Tcm), effector memory T cells (Tem), and effector T cells (Te) among CD4+(CD8+) T cells. B, Proportion of activated CD4+(CD8+) central/effector memory cells. C, Proportion of T‐helper (Th), T‐helper follicular (Tfh) cells, and Th subsets among CD4+ T cells. D, Proportion of activated Th subsets (Th plus Tfh) among CD4+ T cells. E, Proportion of regulatory T cells (Treg) fractions (Fr I, II and III) among CD4+ T cells. F, CD4+ memory T cells (CD3+CD4+CD45RA‐) were sorted and cultured with CD3/CD28 stimulation for 48 h. Culture supernatants were analyzed for the quantification of different cytokines by LEGENDplex (BioLegend, San Diego, CA, USA). The concentration is shown as the production per 104 cells. G, Proportion of naïve B cells, IgM memory B cells, switched memory B cells and plasmablasts among CD19+ B cells. H, Proportion of natural killer (NK) cells, monocytes, and dendritic cells (DC) among CD3‐CD19‐ mononuclear cells. Cycle 0, pre‐treatment, that is, prior to the first PD‐1 antibody cycle; cycle 1, post‐first treatment cycle (ie prior to the second PD‐1 antibody cycle); Matched patient samples are connected by lines [Correction added on 24 September 2018, after first online publication: The missing X axis labels were added to Figure 3.]
No significant difference in the proportion of Th and Tfh subsets was observed in response to 1 cycle of PD‐1 treatment (Figure 3C). The proportion of activated Th1 plus T‐helper follicular (Tfh)1 cells in the CD4+ T cell population significantly increased after therapy, but no difference was observed for Th2 plus Tfh2, or Th17 plus Tfh17 cells (Figure 3D). We next examined the cytokine‐producing ability of the CD4+ or CD8+ memory cells and Th1 plus Tfh1 cells to verify that the observed proportional changes were associated with functional alteration. Paired PBMC samples obtained before and after therapy were available in 4 patients for further analysis. Sorted CD4+ memory T cells (CD3+CD4+CD45RA‐) were cultured with CD3/CD28 stimulation for 48 hours, and cytokine concentration of the culture supernatants was measured. In contrast to the results obtained by measuring the proportion of T cell subsets, no significant changes in cytokine production were observed after 1 cycle of treatment (Figure 3F). Similarly, CD8+ memory T cells (CD3+CD8+CD45RA‐), which consisted of Tcm and Tem, and Th1 plus Tfh1 cells (CD3+CD4+CD45RA‐CXCR3+CCR6‐) were sorted and cultured individually, but the production of interleukin (IL)‐2, interferon (IFN)‐γ, and tumor necrosis factor (TNF)‐α was not found to be affected by 1 cycle of treatment in either cell population (data not shown).
The activated Treg (FrII) fraction exhibited an increasing trend after anti‐PD‐1 treatment (Figure 3E). In terms of B cell subsets, NK cells, monocytes, plasmacytoid DC, and myeloid DC, however, no significant changes were observed after anti‐PD‐1 therapy (Figure 3G,H). Taken together, peripheral blood immune cell profiles after 1 cycle of anti‐PD‐1 therapy indicated a significant increase in activated CD4+/CD8+ Tcm and Tem, and Th1 plus Tfh1 cells, and a trend towards an increase in the number of Treg FrII cells.
3.5. Specific immune cell phenotype changes during anti‐PD‐1 antibody treatment
For immune cell subsets that showed significant changes in response to 1 cycle of anti‐PD‐1 treatment, we followed their progression during further rounds of therapy in 10 MM patients. The level of activated CD4+ Tcm, CD8+ Tcm, Th1 plus Tfh1, and Treg FrII cells over 4 cycles of therapy, is shown in Figure 4A,B. Compared with before therapy, activated CD4+ Tcm increased after the first and second cycles (P = 0.055 and P = 0.031, respectively), but this difference diminished after the third and fourth cycles (P = 0.078 and P = 0.25, respectively). For activated CD8+ Tcm and Th1 plus Tfh1 cells, a similar trend was observed (Figure 4A). Activated phenotypes of CD4+ and CD8+ Tem were also shown the similar trend (data not shown). Compared with pre‐treatment levels, the proportion of Treg FrII cells in the total CD4+ population tended to be higher at every treatment cycle (P = 0.055, P = 0.047, P = 0.078, P = 0.13, and P = 0.068, for cycles 1‐5, respectively; Figure 4B).
Figure 4.
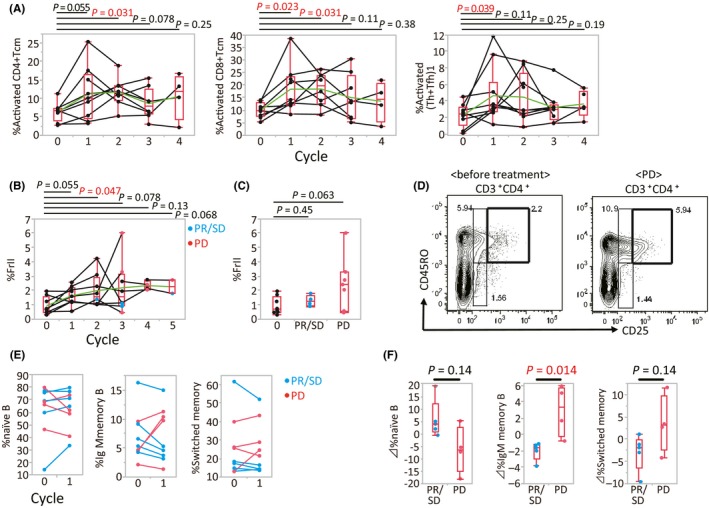
Changes in specific immune cell phenotypes during anti‐programmed death (PD)‐1 treatment. A, Proportion of activated CD8+ central memory T cells (Tcm), CD4+ Tcm, and T‐helper (Th)1 plus T‐helper follicular (Tfh)1 cells at different treatment time points. Matched patient samples are connected by lines. Green line, average for each time point. B, Proportion of regulatory T‐cell (Treg) fraction (Fr)II cells at different treatment time points (PD, progressive disease; PR, partial response; SD, stable disease). C, Proportion of Treg FrII cells before (0) and after treatment. D, Representative flow cytometry scatter plot of the treatment‐induced transition of Treg FrII cells in a single individual. E, Proportion of naïve B cells, IgM memory B cells and switched memory B cells among CD19+ B cells. Matched patient samples are connected by lines. F, Change in subset proportions following 1 cycle of nivolumab therapy
Samples were obtained at the point when the best clinical responses, either PR or SD (PR/SD), or PD, were confirmed (n = 4 and 7, respectively). Treg FrII cell numbers at the point of PR/SD were similar to pre‐treatment levels, while they tended to be higher at the point of PD (P = 0.45 and P = 0.063; Figure 4C). Figure 4D shows representative flow cytometry scatter plots for the transition of Treg FrII cells in the same patient. This suggests that peripheral blood Treg FrII cells increase immediately after anti‐PD‐1 treatment, and continue to increase to the point of PD.
Subsequently, we evaluated the correlation between therapeutic effect and changes in the proportion of each immune cell subset by comparing patients who had anti‐tumor effects (PR/SD) with those patients without response (PD). Of all subsets examined in this study, we found that CD19+CD27+ memory B cells, including IgM memory B cells and switched memory B cells, tended to increase after 1 treatment cycle in PD patients. In contrast, the opposite trend was observed in PR/SD patients (Figure 4E,F).
3.6. Baseline immune cell phenotype and prognosis
Finally, the correlation between baseline immune cell phenotype and prognosis was assessed (Figure 5A,B). We divided 9 MM patients into 2 groups based on the median proportion of CD8+ Tem in the total CD8+ population (%CD8+ Tem) prior to nivolumab therapy. We defined patients in whom the proportion of CD8+ Tem was higher than the median as “%CD8+ Tem‐high” and those with a lower number of CD8+ Tem cells as “%CD8+ Tem‐low”. Anti‐PD‐1 therapy PFS in the %CD8+ Tem‐low group was significantly longer than in the %CD8+ Tem‐high group (P = 0.016; Figure 5A). No significant differences in PFS were seen, however, when dividing patients into groups based on the proportions of other subsets of CD8+ and CD4+ T cells.
Figure 5.
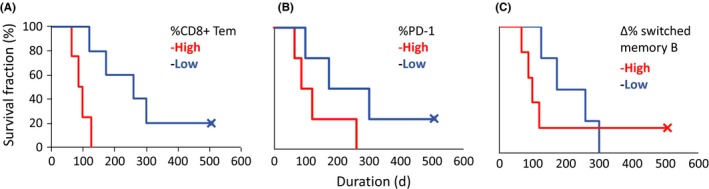
Correlation between baseline immune cell phenotype and prognosis. Kaplan–Meier curves of progression‐free survival stratified by the percentage of A, CD8+ effector memory T cells (Tem) in CD8+ T lymphocytes (n = 9; P = .016; HR, 0.09; 95%CI: 0.005‐0.65); B, programmed death (PD)‐1‐expressing cells in CD4+ Tem (n = 8; P = .13; HR, 0.29; 95%CI: 0.039‐1.51); and C, difference in the percentage of (▵%) switched memory B cells before and after 1 cycle of nivolumab (n = 9; P = .50; HR, 0.32; 95%CI: 0.042‐1.96). Data were analyzed using the log‐rank test
Next, we assessed the effect of the PD‐1 expression of T cell populations (CD4+ Tn, CD4+ Tcm, CD4+ Tem, and CD4+ Te) on PFS. To do this, we similarly divided patients into “%PD‐1‐high” and “%PD‐1‐low” groups, based on the median proportion of PD‐1 expression in each CD4+ T subset. Patients with high PD‐1 in effector memory and effector subsets, such as CD4+ Tem and Te, tended to have shorter survival, but this did not reach statistical significance. Figure 5B shows the survival curves for patients grouped according to the PD‐1 expression level in CD4+ Tem.
Finally, we also examined the significance of memory B cells after 1 cycle of nivolumab in regard to prognosis. Nine patients were divided into 2 groups, “Δ%‐switched memory B‐high” and “Δ%‐switched memory B‐low”, based on the median difference in proportion following 1 cycle of treatment. In this analysis, we found that the Δ%‐switched memory B‐high group tended to show worse prognosis (Figure 5C).
4. DISCUSSION
In the present study, activated CD8+ Tem and Th2 plus Tfh2 cells were more frequently observed in MM patients than in HS, suggesting an effect of tumor‐induced chronic inflammation. Peripheral blood T cells exhibiting memory and effector phenotypes, however, do not necessarily possess anti‐tumor activity, because they may include non‐tumor‐specific T cells, and because they may be cells that are exhausted by continuous tumor antigen presentation.
The ability of PD‐1‐positive exhausted T cells in tumor‐bearing patients to exert tumor‐specific cytotoxicity is thought to be restored by systemic administration of anti‐PD‐1 antibody. With this in mind, we analyzed the change in peripheral blood immune cell subsets in MM patients before and after 1 cycle of anti‐PD‐1 treatment. The direct effect of anti‐PD‐1 antibody on PD‐1 expressing cells residing in secondary lymphoid tissues and the peripheral blood is not yet well understood. Although the in vitro, treatment‐induced activation of a Th1 subset by cytokine‐production was not clearly shown, our observation of an increased proportion of activated Th1 plus Tfh1 cells in response to therapy is notable. In terms of the cytokine analysis, we should consider the possible effects of freezing on the condition of the stocked cells and the limitations of a small sample size to assess statistical significance.
The possible effects of interfering with the PD‐1/PD‐L1 axis of T cell‐APC interactions can be considered in terms of 2 response phases. First, initial antigen presentation to Tn by DC in the secondary lymphoid tissues induces differentiation to Th1 or Tfh subsets in the presence of IL‐12.14 Given that PD‐1 is expressed during Tn‐APC interactions, and negative signaling via PD‐1 is thought to regulate T‐cell activation, anti‐PD‐1 antibodies may have the potential to increase activation of Th1 subsets. The role of PD‐1 signaling in the process of Th1 or Tfh differentiation, however, has not been elucidated,15, 16 and thus the possible effect of anti‐PD‐1 therapy during this phase should be further examined. Second, PD‐1‐expressing exhausted Th1 cell subsets may be restored by anti‐PD‐1 antibodies, with activated Th1 cells subsequently detectable in the peripheral blood. Although the specific molecular mechanisms for this putative process remain unclear, the present findings strongly suggest that part of the anti‐tumor effect of PD‐1 therapy involves additional processes beyond the direct activation of exhausted tumor‐specific cytotoxic T cells.
The role of B cells in tumor immunity has not yet been fully elucidated, but some B‐cell subsets have been reported to suppress anti‐tumor immune responses. Indeed, the anti‐tumor activity of cytotoxic T lymphocytes (CTL) is enhanced in B‐cell‐deficient mice, and some B‐cell subsets are reported to suppress DC and CTL via transforming growth factor (TGF)‐β and IL‐10.17, 18 Human CD19+CD24highCD27high B cells and CD19+CD27intCD38+ plasmablasts have also been reported to produce IL‐10.19, 20 In the present study, we observed that decreased ratios of memory B‐cell populations correlated with favorable prognosis during anti‐PD‐1 treatment. It is considered that systemic PD‐1 blockade represses B‐cell subsets that suppress anti‐tumor immunity, resulting in a therapeutic effect. Tfh cells residing in secondary lymphoid tissues highly express PD‐1 and induce proliferation and differentiation of naïve B cells presenting in the germinal center (GC). Excessive activation of Tfh cells is thought to be regulated by PD‐1 signaling during their interaction with GC B cells.21 Therefore, systemic PD‐1 blockade possibly modulates humoral immunity by affecting Tfh and naïve B cells. Further analyses are required to elucidate the functional role of anti‐PD‐1 treatment in humoral immunity.
The recruitment of Treg, which produce regulatory cytokines such as TGF‐β and IL‐10 in tumor tissues, is one of the important mechanisms that tumors use to escape from immune surveillance. Peripheral blood Treg often express CD4, CD25, and FoxP3. A recent study proposed the classification of FoxP3‐expressing CD4+ T cells into 3 fractions: naïve Treg (fraction I: CD45RA+, FoxP3‐low, CD4+), effector Treg (fraction II: CD45RA‐, FoxP3‐high, CD4+), and non‐Treg (fraction III: CD45RA‐, FoxP3‐low, CD4+).22 Although we used a CD3+CD4+CD45RO+CD25high phenotype for detecting effector Treg in the present study, this population expressed a high level of CCR4, which is recognized as a molecule specifically expressed at high levels in effector Treg. This indicates that the approach used in the present study may adequately show the behavior of effector Treg.
T‐cell receptor (TCR) signaling via APC induces the acquisition of effector Treg, which play a strong role in immune suppression. The PD‐1/PD‐L1 axis might regulate the activation of naïve Treg by APC, and thus anti‐PD‐1 treatment could affect the induction of these cells. In the IL‐2‐induced chronic graft‐versus‐host disease (cGVHD) mouse model, concomitant administration of low‐dose IL‐2 and anti‐PD‐1 antibody has been found to induce an increase in peripheral blood Treg and amelioration of cGVHD in 1 week.23 Consistent with this, we observed that the proportion of peripheral blood effector Treg after 2 courses of anti‐PD‐1 therapy in the present study also increased. Interestingly, effector Treg tended to rise at the point of PD, suggesting that this cell fraction might therefore be useful for detecting disease progression on blood sampling. Taken together, however, the impact of systemic PD‐1 blockade on human Treg remains unclear, and further investigation is warranted.
In the adaptive immune system, CD4+ or CD8+ Tn differentiate to effector cells in the first‐contact response to foreign antigens, and a small population survives as memory subsets to prepare for antigen re‐encounter. Among memory T cells, Tcm lymphocytes expressing CCR7 exist mainly in the secondary lymphoid tissues, while Tem have lower expression of CCR7 and reside mainly in local inflammatory tissues.24 When Tcm and Tem re‐encounter the same antigens, Tcm proliferate rapidly but produce fewer cytokines, while Tem proliferate less but immediately produce cytokines and become cytotoxic.24 Therefore, it has been suggested that sustained PD‐1/PD‐L1 stimulation in the tumor microenvironment may render Tem and Te too exhausted to respond to anti‐PD‐1 treatment. Consistent with this hypothesis, high numbers of CD8+ Tem and a high level of PD‐1 expression in CD4+ lymphocytes were associated with worse prognosis in this study.
Although the proportions of several immune cell subsets, including activated CD4+/CD8+ Tcm and Tem, and Th1 plus Tfh1 cells, increased after the first course of anti‐PD‐1 therapy, these changes gradually attenuated over time. Given that MM patients received anti‐PD‐1 antibody regularly, the blood serum concentration of nivolumab would be expected to be maintained at the target value and the effect of PD‐1 blockade continued. Our observation of an increased proportion of activated Th1 plus Tfh1 cells might relate to an unknown indirect effect of the anti‐PD‐1 antibody, which could explain this attenuation. Given that the present study examined only a small number of MM patients, analysis of the mechanistic basis for the observed changes in immune cell representation, and their relationship with the tumor‐suppressing effects and immune‐related adverse events of anti‐PD‐1 therapy, requires further investigation in a larger cohort.
CONFLICT OF INTEREST
Koichi Akashi received honoraria and endowments from Ono Pharm. The remaining authors declare no conflicts of interest.
ACKNOWLEDGMENTS
The authors thank the patients and their families for participating in this study, and the medical staff for their respective contributions to the treatment of patients.
Yamaguchi K, Mishima K, Ohmura H, et al. Activation of central/effector memory T cells and T‐helper 1 polarization in malignant melanoma patients treated with anti‐programmed death‐1 antibody. Cancer Sci. 2018;109:3032–3042. 10.1111/cas.13758
REFERENCES
- 1. Chen DS, Mellman I. Oncology meets immunology: the cancer‐immunity cycle. Immunity. 2013;39:1‐10. [DOI] [PubMed] [Google Scholar]
- 2. Rosenberg SA, Spiess P, Lafreniere R. A new approach to the adoptive immunotherapy of cancer with tumor‐infiltrating lymphocytes. Science. 1986;233:1318‐1321. [DOI] [PubMed] [Google Scholar]
- 3. Fridman WH, Pagès F, Sautès‐Fridman C, Galon J. The immune contexture in human tumours: impact on clinical outcome. Nat Rev Cancer. 2012;12:298‐306. [DOI] [PubMed] [Google Scholar]
- 4. Holtan SG, Creedon DJ, Thompson MA, Nevala WK, Markovic SN. Expansion of CD16‐negative natural killer cells in the peripheral blood of patients with metastatic melanoma. Clin Dev Immunol. 2011;2011:316314. [DOI] [PMC free article] [PubMed] [Google Scholar]
- 5. Chavan R, Salvador D, Gustafson MP, Dietz AB, Nevala W, Markovic SN. Untreated stage IV melanoma patients exhibit abnormal monocyte phenotypes and decreased functional capacity. Cancer Immunol Res. 2014;2:241‐248. [DOI] [PMC free article] [PubMed] [Google Scholar]
- 6. Zhang X, Schwartz JC, Guo X, et al. Structural and functional analysis of the costimulatory receptor programmed death‐1. Immunity. 2004;20:337‐347. [DOI] [PubMed] [Google Scholar]
- 7. Okazaki T, Honjo T. PD‐1 and PD‐1 ligands: from discovery to clinical application. Int Immunol. 2007;19:813‐824. [DOI] [PubMed] [Google Scholar]
- 8. Zou W, Wolchok JD, Chen L. PD‐L1 (B7‐H1) and PD‐1 pathway blockade for cancer therapy: mechanisms, response biomarkers and combinations. Sci Transl Med. 2016;8:328rv4. [DOI] [PMC free article] [PubMed] [Google Scholar]
- 9. Neil C, Kalinka‐Warzocha E, Savage KJ, et al. Nivolumab in previously untreated melanoma without BRAF mutation. N Engl J Med. 2015;372:320‐330. [DOI] [PubMed] [Google Scholar]
- 10. Weber JS, D'Angelo SP, Minor D, et al. Nivolumab versus chemotherapy in patients with advanced melanoma who progressed after anti‐CTLA‐4 treatment (CheckMate 037): a randomised, controlled, open‐label, phase 3 trial. Lancet Oncol. 2015;16:375‐384. [DOI] [PubMed] [Google Scholar]
- 11. Kimmel S. Immunotherapy earns its spot in the ranks of cancer therapy. J Exp Med. 2012;209:201‐209. [DOI] [PMC free article] [PubMed] [Google Scholar]
- 12. Maecker HT, McCoy JP, Nussenblatt R. Standardizing immunophenotyping for the Human Immunology Project. Nat Rev Immunol. 2012;12:191‐200. [DOI] [PMC free article] [PubMed] [Google Scholar]
- 13. Eisenhauer EA, Therasse P, Bogaerts J, et al. New response evaluation criteria in solid tumours: revised RECIST guideline (version 1.1). Eur J Cancer. 2009;45:228‐247. [DOI] [PubMed] [Google Scholar]
- 14. Nakayamada S, Kanno Y, Takahashi H, et al. Early Th1 cell differentiation is marked by a Tfh cell‐like transition. Immunity. 2011;35:919‐931. [DOI] [PMC free article] [PubMed] [Google Scholar]
- 15. Wang J, Yoshida T, Nakaki F, Hiai H, Okazaki T, Honjo T. Establishment of NOD‐Pdcd1‐/‐ mice as an efficient animal model of type I diabetes. Proc Natl Acad Sci USA. 2005;102:11823‐11828. [DOI] [PMC free article] [PubMed] [Google Scholar]
- 16. Good‐Jacobson KL, Szumilas CG, Chen L, Sharpe AH, Tomayko MM, Shlomchik MJ. PD‐1 regulates germinal center B cell survival and the formation and affinity of long‐lived plasma cells. Nat Immunol. 2010;11:535‐542. [DOI] [PMC free article] [PubMed] [Google Scholar]
- 17. Qin Z, Richter G, Schüler T, Ibe S, Cao X, Blankenstein T. B cells inhibit induction of T cell‐dependent tumor immunity. Nat Med. 1998;4:627‐630. [DOI] [PubMed] [Google Scholar]
- 18. Rowley DA, Stach RM. B lymphocytes secreting IgG linked to latent transforming growth factor‐beta prevent primary cytolytic T lymphocyte responses. Int Immunol. 1998;10:355‐363. [DOI] [PubMed] [Google Scholar]
- 19. Wang T, Li Z, Li X, et al. Expression of CD19+CD24highCD38high B cells, IL‐10 and IL‐10R in peripheral blood from patients with systemic lupus erythematosus. Mol Med Rep. 2017;16:6326‐6333. [DOI] [PubMed] [Google Scholar]
- 20. Matsumoto M, Baba A, Yokota T, et al. Interleukin‐10‐producing plasmablasts exert regulatory function in autoimmune inflammation. Immunity. 2014;41:1040‐1051. [DOI] [PubMed] [Google Scholar]
- 21. Tangye SG, Ma CS, Brink R, Deenick EK. The good, the bad and the ugly: TFH cells in human health and disease. Nat Rev Immunol. 2013;13:412‐426. [DOI] [PubMed] [Google Scholar]
- 22. Takeuchi Y, Nishikawa H. Roles of regulatory T cells in cancer immunity. Int Immunol. 2016;28:401‐409. [DOI] [PMC free article] [PubMed] [Google Scholar]
- 23. Asano T, Meguri Y, Yoshioka T, et al. PD‐1 modulates regulatory T‐cell homeostasis during low‐dose interleukin‐2 therapy. Blood. 2017;129:2186‐2197. [DOI] [PMC free article] [PubMed] [Google Scholar]
- 24. Sallusto F, Lenig D, Förster R, Lipp M, Lanzavecchia A. Two subsets of memory T lymphocytes with distinct homing potentials and effector functions. Nature. 1999;401:708‐712. [DOI] [PubMed] [Google Scholar]