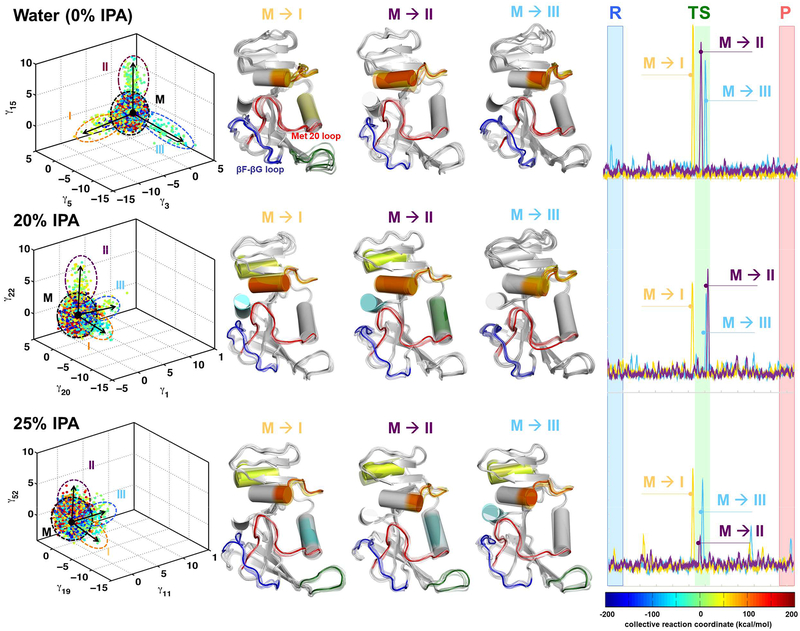
Figure 2: IPA alters the functionally relevant conformational sub-states for catalysis.
Computer simulations with the EVB method were used to model the rate-limiting hydride transfer reaction in water (0% IPA), 20% IPA and 25% IPA. (The color coding is based on the reaction coordinate. See the free energy profiles in supporting information for details.) The 3-D plot (left panel) shows three different independent component vectors from QAA and the ellipses identify the conformational sub-states for each of the simulations. Each dot represents a single enzyme conformation along the reaction pathway of hydride transfer (color coded according to the value of the reaction coordinate). For each of the simulations, we identified conformational sub-states close to TS area (cyan-green-yellow dots). The mixed sub-state (M) represents a mixture of all other sub-states. The conformational fluctuations that enable the sampling of these sub-states are indicated by arrows (M ⟶I, M ⟶II, and M⟶III). In the middle panel, the structural changes in DHFR associated with fluctuations are shown in a movie like fashion, with regions displaying the largest fluctuations shown in color (Note these colors have no connection to reaction coordinate colors but are used to indicate same regions of protein that show motion). In these conformational fluctuations, the enzyme regions including Met20 and βF-βG loops show the largest displacements. The right-most panel indicates the activation of enzyme (visit into the TS conformational sub-states) by these protein motions. These activation profile corresponds to the 3 QAA modes shown on left hand side and are calculated by projecting the sampled conformational snapshots on each mode. Note that the conformational sub-states are clearly defined for 0% IPA; however, the enzyme landscape is altered significantly by addition of IPA in solution. At 20% and 25% these sub-states are not clearly defined, which indicate difficulty in sampling the motions (see the activation profiles in right panel) and reaching the functionally relevant sub-states in the TS area.

