Abstract
The pancreas of vertebrates is separately derived from both the dorsal and ventral endodermal domains. However, the difference between these two programs has been unclear. Here, using a pancreatic determination gene, Pdx1, driven GFP transgenic mouse strain, we identified Pdx1‐GFP highly expressing cells (Pdx1high) and Pdx1‐GFP lowly expressing cells (Pdx1low) in both embryonic dorsal Pdx1‐expressing region (DPR) and ventral Pdx1‐expressing region (VPR). We analyzed the transcriptomes of single Pdx1low and Pdx1high cells from the DPR and VPR. In the VPR, Pdx1low cells have an intermediate progenitor identity and can generate hepatoblasts, extrahepatobiliary cells, and Pdx1high pancreatic progenitor cells. In the DPR, Pdx1high cells are directly specified as pancreatic progenitors, whereas Pdx1low cells are precocious endocrine cells. Therefore, our study defines distinct road maps for dorsal and ventral pancreatic progenitor specification. The findings provide guidance for optimization of current β‐cell induction protocols by following the in vivo dorsal pancreatic specification program.
Keywords: dorsal pancreas, fate map, single‐cell RNA‐seq, ventral pancreas
Subject Categories: Development & Differentiation, Methods & Resources
Introduction
Current embryonic stem cell (ESC)‐derived pancreatic β‐cell induction protocols mimic the process of pancreatic development 1, 2, 3, 4, 5, 6. These protocols involve sequential exposure of ESCs to different combinations of signaling factors, thereby inducing ESCs in a stepwise manner through several precursor stages toward insulin‐expressing β‐cells. Generation of high‐quality pancreatic progenitor cells is a key intermediate step for pancreatic endocrine specification 5. However, because our understanding of the programs that guide in vivo pancreatic progenitor development remains unclear, it is difficult to comprehensively evaluate the efficiency of pancreatic progenitor induction.
The vertebrate pancreas is originated from both the dorsal and ventral endodermal domains. In the mouse, pancreas specification begins on embryonic day 8.5 (E8.5) 7. The dorsal and ventral endoderm then forms pancreatic buds beginning on E9.0 and E9.5, respectively 8. The two pancreatic buds subsequently enlarge and eventually fuse to form the pancreas organ by E12.5 as a result of gut rotation 8, 9. In zebrafish, the dorsal pancreatic progenitors contribute to endocrine cell development, whereas the ventral pancreatic progenitors contribute exocrine cells and smaller islets 10, 11. In mammals, although the dorsal pancreas and ventral pancreas exhibit identical patterns of morphological alterations and possess the ability to generate both endocrine and exocrine cells 12, the cell type distributions between the dorsal and ventral islets are significantly different 13.
Pancreatic and duodenal homeobox gene 1 (Pdx1) is one of the earliest markers of pancreatic specification and is expressed beginning at E8.5 in the mouse in the regional endodermal domains before the formation of pancreatic buds 14, 15, 16. Early Pdx1‐expressing cells in the pancreatic buds are multipotent progenitors that give rise to both pancreatic endocrine and exocrine lineages 17, 18.
The dorsal and ventral pancreatic programs are differentially regulated during pancreatic genesis because they receive distinct inductive signals from their adjacent tissues. The dorsal pancreatic domain receives activin and fibroblast growth factor (FGF) signals from the notochord, which provides permissive signals for dorsal pancreatic bud specification through repression of Shh 19, 20. Moreover, endothelial cells in the early dorsal aorta send signals to promote pancreatic specification 21, 22.
The presumptive ventral pancreatic endoderm region is directly adjacent to the lateral plate mesoderm, which releases inductive signals, including bone morphogenetic protein (BMP), retinoic acid (RA), activin 23, and noncanonical Wnt 24, to promote ventral pancreas induction. Both the liver and ventral pancreas are derived from bipotential progenitor cells in the ventral foregut endoderm 25, 26, 27. Fibroblast growth factor signaling from the cardiac mesoderm and BMP from the septum transversum mesenchyme induce the liver program but suppress pancreatic fate specification 25, 28, 29. Curiously, the extrahepatobiliary system shares a common foregut endoderm origin with the ventral pancreas. Sox17 is necessary and sufficient to direct a biliary‐over‐pancreatic cell fate choice 30 . Thus, the cells in the ventral endoderm domain face multiple fate choices regarding whether to differentiate into hepatic, pancreatic, or biliary cells, but the intrinsic program by which ventral endoderm cells move toward pancreatic differentiation is still unclear.
In addition to the distinct signals received by the dorsal or ventral pancreatic progenitors, there are marked differences in the regulatory factors that are necessary for dorsal versus ventral pancreas specification 31. Mnx1 is necessary for dorsal bud initiation, whereas Hnf1b is required for ventral bud initiation 32, 33, 34. For dorsal pancreatic development, Hnf1b is required to induce Ptf1a and Ngn3, which encode key factors for endocrine development 33, whereas in ventral pancreatic development, Hnf1b induces a different gene set that comprises Pdx1, Mnx1, and Ptf1a 31. The functional differences in key regulatory factors in dorsal versus ventral pancreas development are indicative of the distinct programs that are involved in pancreatic specification from these two regions.
To identify the cellular composition of the dorsal and ventral pancreatic regions, we performed single‐cell RNA‐seq on fluorescence‐activated cell sorting (FACS)‐sorted Pdx1‐expressing cells from E9.5 and E10.5 Pdx1‐GFP mouse embryos. We identified the distinct lineage differentiation pathways and developmental potentials involved in dorsal versus ventral pancreatic progenitor development, and the findings can be used as benchmarks for the induction of pancreatic progenitors in vitro.
Results
Distinct cell populations in the VPR versus the DPR
To elucidate the cell subtypes among ventral versus dorsal pancreatic progenitors, we performed single‐cell transcriptomic analyses of pancreatic progenitor cells isolated from the VPR or DPR of E10.5 mouse embryos. Pdx1‐expressing cells from a Pdx1‐GFP transgenic mouse strain were sorted by FACS 35. After carefully removing the PDX1+ duodenum tissue, which is adjacent to the dorsal pancreatic bud and can be labeled by Pdx1‐GFP, we dissociated the tissue from the VPR and DPR into single cells and performed a flow cytometric analysis (Fig 1A). Curiously, Pdx1‐GFP+ cells from the E10.5 VPR or DPR were separated into GFPlow and GFPhigh populations (Fig 1B). In duodenum tissue, no GFPhigh cells were identified (Fig EV1A). Next, we validated the sorted cells from the VPR and DPR by performing qPCR and identified a positive correlation between Pdx1, GFP expression levels, and GFP fluorescence intensity (Fig EV1B). However, the GFPhigh versus GFPlow ratios were substantially different between the VPR and DPR. In the VPR, approximately 35% of the total GFP+ cell population consisted of GFPhigh cells, whereas this number rose to approximately 85% in the DPR (Fig 1C). Thus, the VPR and DPR comprise different cellular components.
Figure 1. Single‐cell RNA‐seq identified distinct cell populations in the VPR and DPR.
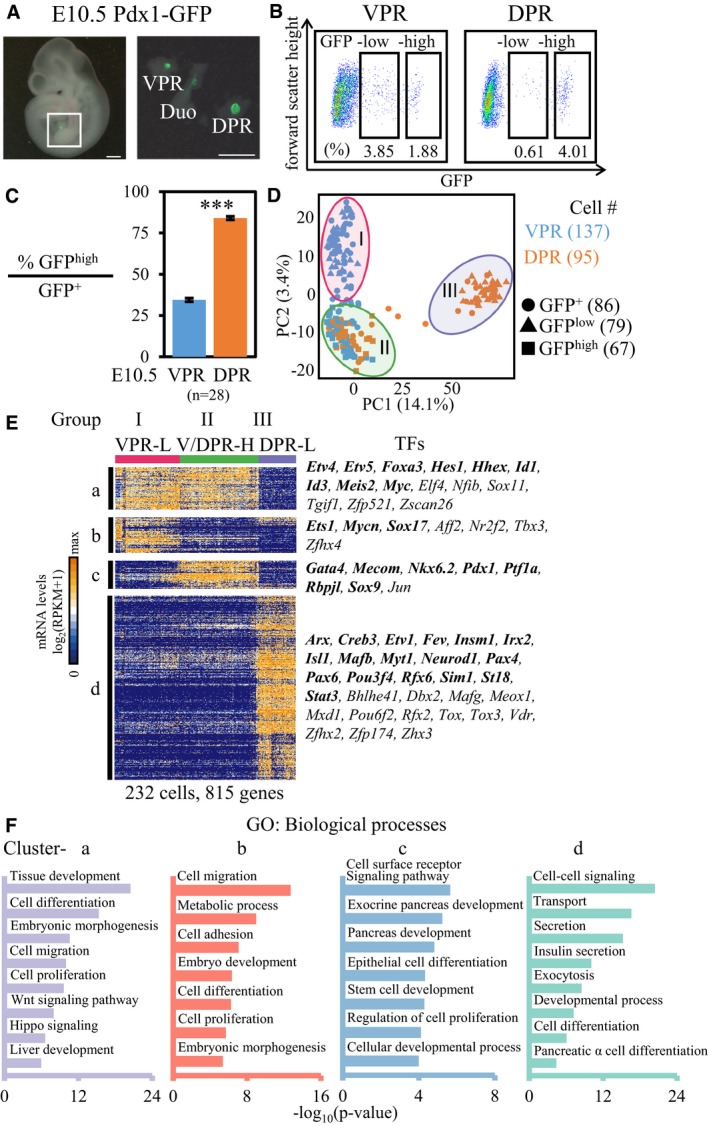
- The VPR and DPR (right) were dissected from E10.5 Pdx1‐GFP embryos (left). Scale bar: 500 μm. DPR, dorsal Pdx1‐expressing region; VPR, ventral Pdx1‐expressing region; Duo, duodenum bud.
- FACS gating for sorting GFPlow and GFPhigh cells from the VPR and DPR.
- The ratios of GFPhigh cells to GFP+ cells in the VPR and DPR. The data show the mean ± SEM; n = number of independent biological replicates, unpaired t‐test. ***P‐value < 0.001.
- PCA plot of single‐cell RNA‐transcriptomes of GFP+ (circle), GFPlow (triangle), and GFPhigh (square) cells from the VPR (blue) and DPR (orange). Each point represents a single cell. Three groups of cells are included in three colored circles.
- Hierarchical clustering of 815 genes correlating with the first two PCs identified three groups of cell types and four major distinct clusters (a–d) of genes (P < 1 × 10⁻⁹, cell cycle‐related genes are excluded). Each column is a single cell, and each row represents one gene. Cluster‐specific TFs are listed on the right. The genes in bold are known to have roles in pancreatic development. L, GFPlow; H, GFPhigh.
- Selected GO categories enriched among the four clusters of genes in (E).
Figure EV1. E10.5 FACS sorting validation, the distributions of GFP + single cells in each group.
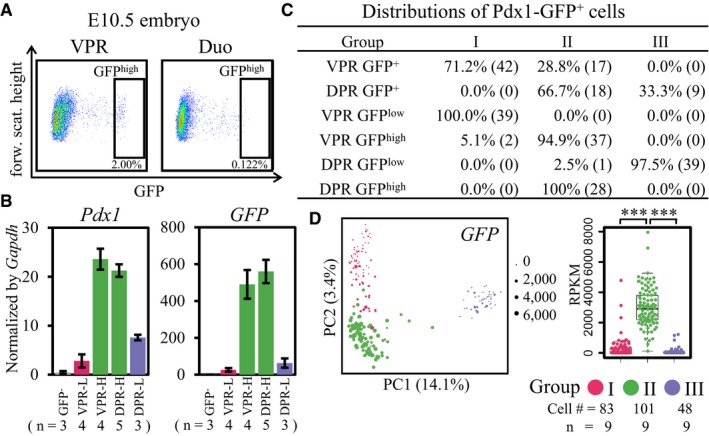
- FACS gating for sorting GFPhigh cells from the VPR and duodenum tissue.
- The expression levels of Pdx1 and GFP in GFP−, GFPlow, and GFPhigh cells from the VPR and DPR were validated by qPCR. The data show the mean ± SEM; n = number of independent biological replicates.
- The distributions of sorted E10.5 GFP+, GFPlow, or GFPhigh cells from the VPR and DPR in Groups I–III.
- The GFP expression values projected onto the PCA (left) and box (right) plots. The points are colored as in Fig 2A–C. The y‐axis of the box plot represents the expression levels (RPKM). Central line in the box represents median; box limits represent the first and third quartile; whiskers represent 1.5 × interquartile range. Unpaired Wilcoxon rank‐sum test. Cell # = the number of cells. n = number of independent biological replicates. ***P‐value < 1 × 10⁻⁹.
To conduct single‐cell RNA‐seq analysis 36, we used FACS to sort 59 GFP+ cells from the VPR and 27 GFP+ cells from the DPR of E10.5 embryos. Additionally, to characterize the cellular identities of the GFPlow and GFPhigh cells, we isolated 39 GFPlow and 39 GFPhigh cells from the VPR and 40 GFPlow and 28 GFPhigh cells from the DPR (Fig EV1C, Dataset EV1). An RNA spike‐in standard was included to distinguish true biological variability from technical noise in the single‐cell RNA‐seq (Fig EV2A). Single‐cell libraries were sequenced at an average depth of 1.7 million reads, with 7,000–10,000 genes quantified per cell (Fig EV2B–D). Principal component analysis (PCA) and hierarchical clustering revealed three major populations among the GFP+ cells from the VPR and DPR (Groups I–III, Fig 1D and E). The cells in Group I were solely derived from the VPR. Notably, the GFPlow cells of the VPR fell within this group. Curiously, the GFPhigh cells from both the VPR and DPR had identical gene expression profiles and belonged to the Group II cell population. Group III was composed of DPR cells, among which we identified the sorted GFPlow cells (Figs 1D and EV1C and D). Hierarchical clustering revealed a total of 815 heterogeneously expressed genes across these three groups of cells (Fig 1E and Dataset EV2). According to Gene Ontology (GO) enrichment analysis, cluster “a” (expressed in Groups I and II) and cluster “b” (expressed in Group I) were related to events during the early stages of embryogenesis, such as embryo development, cell proliferation, and cell migration (Fig 1E and F). Cluster “c” genes were specifically expressed in Group II cells, and this cluster was enriched for genes related to the regulation of pancreatic development. Cluster “d” genes were associated with differentiated endocrine lineage functions (Fig 1E and F). Thus, single‐cell transcriptomic analyses revealed the identical nature of GFPhigh cells from the VPR and DPR, whereas GFPlow cells were distinct between the VPR and DPR.
Figure EV2. Quality control of single‐cell and bulk‐cell RNA‐seq results.
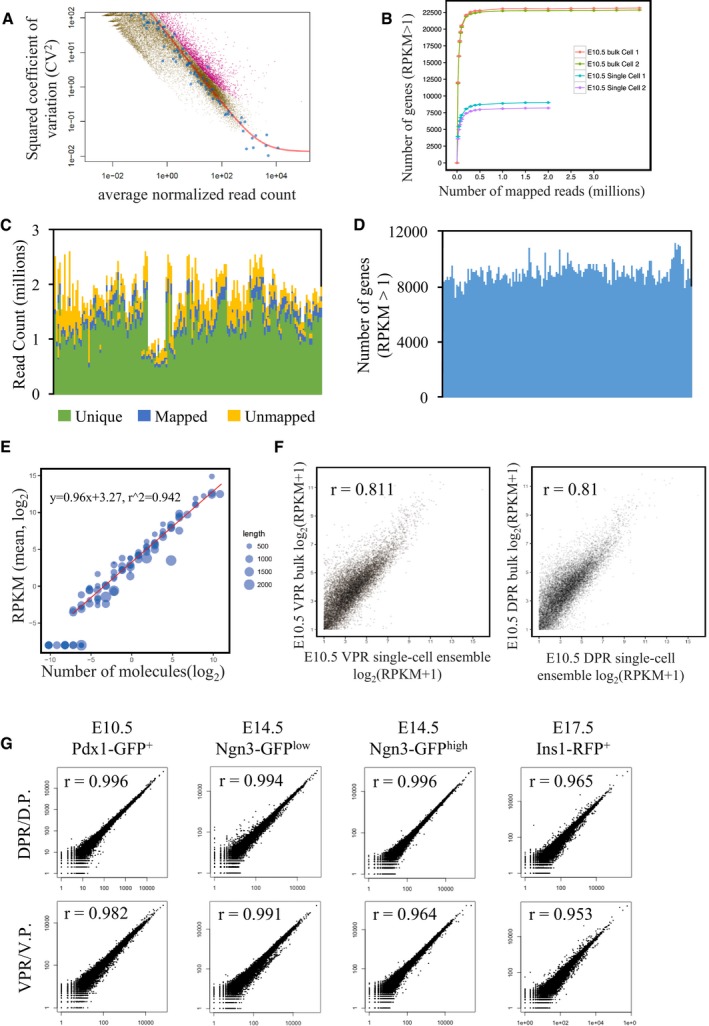
- Accounting for technical noise of single‐cell RNA‐seq data. Blue points represent ERCC spike‐ins; magenta points represent significantly highly variable mouse genes (FDR < 0.1); brown points represent other mouse genes. The red line represents the technical noise fit.
- Saturation curves to determine the sequencing depths for single‐cell and bulk‐cell RNA‐seq indicate that approximately 0.5 million mapped reads are sufficient for single‐cell RNA‐seq. The x‐axis represents randomly selected numbers of mapped reads from each sample library. The y‐axis represents called genes using the same alignment pipeline. Each point represents five subsamplings. Error bars indicate the standard error.
- Statistical analysis of the alignment of single‐cell RNA‐seq data, revealing > 0.5 million mapped reads in all cells. Each line represents a single‐cell RNA‐seq sample.
- The number of detected genes (RPKM > 1) in single‐cell RNA‐seq samples is between 7,000 and 10,000. Each line represents a single‐cell RNA‐seq sample.
- The RPKM of single‐cell RNA‐seq is correlated with the number of molecules provided by the average transcript levels detected for the 92 ERCC RNA spike‐in standards. Linear regression shows a correlation between RPKM and the number of molecules. Each point represents one ERCC RNA spike‐in, and the gene length is encoded in the size of the data point.
- Correlation between bulk‐cell and merged single‐cell RNA‐seq RPKM measurements. All raw reads obtained from single‐cell RNA‐seq were computationally pooled to create the ensemble. r, Pearson's correlation.
- Correlations between RNA‐seq duplicate samples demonstrate the high quality of the bulk‐cell RNA‐seq data. The x‐ and y‐axes represent read counts for each gene in duplicate samples. r, Pearson's correlation.
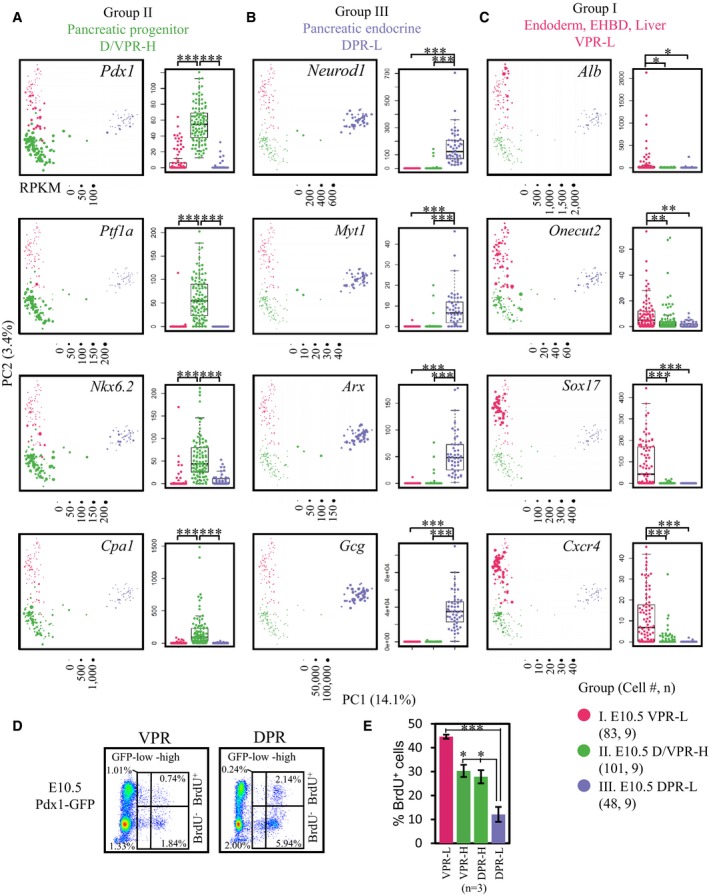
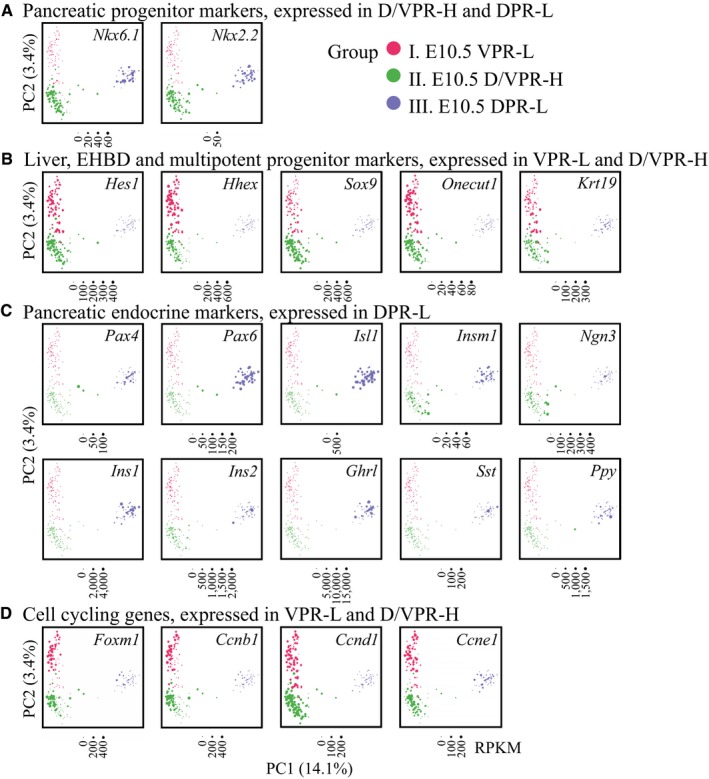
Next, we evaluated the expression of group‐specific genes to determine the potential identities of each cell population. Pdx1, Ptf1a, and Nkx6.2 37 are key transcription factors (TFs) for pancreatic progenitor specification, and Cpa1 expression with Pdx1 marks multipotent pancreatic progenitor cells 38. These genes were exclusively and highly expressed in GFPhigh cells (Group II) (Fig 2A). Moreover, other key regulators of pancreatic progenitor specification, such as Nkx6.1, Nkx2.2, Hes1, Hhex, Sox9, and Onecut1, were highly expressed in Group II cells; however, among these genes, Nkx6.1 and Nkx2.2 were also expressed in GFPlow DPR cells (Group III), whereas Hes1, Hhex, Sox9, and Onecut1 were present in Group I cells (Fig EV3A and B). Therefore, based on the expression patterns of these TFs, we considered GFPhigh cells to be pancreatic progenitors.
Figure 2. Three groups of cells represent distinct cell fates.
-
A–CExpression levels of group‐specific genes in individual cells. The gene expression values were projected onto the PCA (left) and box (right) plots. Each point represents a cell. Points were colored based on the hierarchical clustering in Fig 1E. The y‐axes of the box plots represent the expression levels (RPKM). Central line in the box represents median; box limits represent the first and third quartile; whiskers represent 1.5 × interquartile range. Unpaired Wilcoxon rank‐sum test. Cell # = the number of cells. n = number of independent biological replicates. *P‐value < 1 × 10⁻³; **P‐value < 1 × 10⁻⁶; ***P‐value < 1 × 10⁻⁹.
-
DFlow cytometric analysis of BrdU incorporation rates in GFPlow and GFPhigh cells from the DPR and VPR.
-
EStatistical analysis of BrdU+ in different cell populations. The data show the mean ± SEM; n = number of independent biological replicates, unpaired t‐test. *P‐value < 0.05; ***P‐value < 0.001.
Figure EV3. Marker gene expression in three populations at E10.5.
-
A–DThe expression levels of lineage‐specific genes in individual cells. The points are colored based on the hierarchical clustering in Fig 1E.
Because hormone‐expressing cells were observed in E10.5 embryos 39, 40, we next assessed pancreatic endocrine cell markers. Ngn3 is a key TF for specification of pancreatic endocrine progenitors but is inactive in differentiated islet lineages 18. Ngn3 was expressed in a few intermediate DPR cells between Group II and Group III (Fig EV3C), which is consistent with previous observations that Ngn3 is exclusively expressed in a speckled pattern in the dorsal pancreatic bud 41. However, the Ngn3 downstream target genes Neurod1, Pax4, Pax6, Arx, Isl1, and Insm1, as well as the Nkx6.1 target gene Myt1, all of which are necessary for pancreatic islet lineage development, were universally expressed in Group III cells (Figs 2B and EV3C). We also examined the expression of endocrine hormone genes. In the GFPlow DPR population, 45 of the 48 cells expressed Gcg (RPKM > 10,000) and 18 of these Gcg + cells (40%) co‐expressed at least one hormone gene, namely Ins1, Ins2, Sst, Ppy, or Ghrl (RPKM > 1,000) (Figs 2B and EV3C). These data indicate that the Group III cells were precocious pancreatic endocrine lineages, which mainly included α cells, as well as some poly‐hormonal cells.
Surprisingly, in the GFPlow VPR (Group I) cells, we detected a fraction of cells that expressed the liver marker gene Alb and the hepatic TF Onecut2 (Fig 2C). Moreover, some cells expressed Sox17 and the epithelium marker gene Krt19 42 (Figs 2C and EV3B), suggesting the specification of these cells as extrahepatic bile ducts (EHBDs). Notably, Sox17 and Alb were not co‐expressed in the same cells (Fig 2C). Cxcr4, an endoderm marker gene 43, was detected in Group I cells (Fig 2C). Therefore, GFPlow VPR cells are heterogeneous, comprising a mixture of the precursors of hepatic, biliary ductal, and pancreatic lineages.
During early development, progenitor cells are cycling actively while retaining the ability to differentiate. Generally, cell proliferation and differentiation exhibit an inverse relationship 44. To evaluate the differentiation potential of each population, we analyzed the expression patterns of cell cycle‐related genes. Most genes promoting cell cycle progression were silent in GFPlow DPR cells (Fig EV3D). Bromodeoxyuridine (BrdU) incorporation experiments confirmed the lowest DNA synthesis rate (reflecting cell proliferative property) of GFPlow DPR cells compared with GFPhigh cells and GFPlow VPR cells. Among these populations, GFPlow VPR cells showed the highest DNA synthesis rate (Fig 2D and E). These findings further indicate the identity of GFPlow VPR cells as precursor cells, whereas GFPlow DPR cells are differentiated endocrine cells.
Together, our single‐cell analyses define Pdx1‐GFPhigh cells from the VPR and DPR as pancreatic progenitor cells, whereas Pdx1‐GFPlow cells from the VPR and DPR demonstrate distinct gene expression and developmental potential. Pdx1‐GFPlow DPR cells are premature endocrine lineages, whereas Pdx1‐GFPlow VPR cells are heterogeneous, comprising progenitors for different lineages.
More endocrine cells and fetal β‐cells are generated in the dorsal pancreas
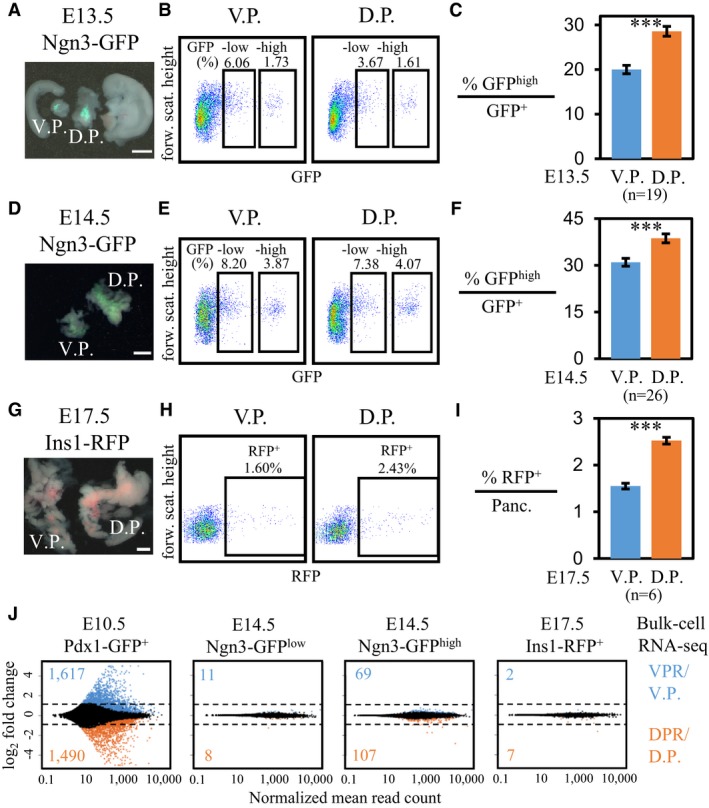
Given the higher percentage of Pdx1‐GFPhigh pancreatic progenitor cells in the DPR, we tracked the developmental process to determine whether there was a higher percentage of endocrine cells in the dorsal pancreas at later developmental stages. First, we quantified the second wave of NGN3+ endocrine progenitor cells (NGN3+ cells generated at E9.5–E10.5 were called first wave endocrine cells) from the ventral and dorsal pancreases using an Ngn3‐GFP knock‐in mouse strain 45. NGN3+ cells were divided into Ngn3‐GFP highly expressing (Ngn3‐GFPhigh) and lowly expressing cells (Ngn3‐GFPlow). Ngn3‐GFPhigh cells are committed endocrine cells, whereas Ngn3‐GFPlow cells retain the potential to differentiate into exocrine cells 46. These two populations are distinguishable by FACS based on the fluorescence intensity of GFP 47. Thus, we dissected the dorsal and ventral pancreases from Ngn3‐GFP embryos at E13.5 and E14.5 and performed flow cytometric analyses (Figs 3A–F and EV4A and B). The Ngn3‐GFPlow and Ngn3‐GFPhigh cells were FACS‐purified, and the Ngn3 expression level was validated by RT–qPCR (Fig EV4D). We observed significantly higher ratios of Ngn3‐GFPhigh cells versus total Ngn3‐GFP+ cells in the dorsal pancreases from both E13.5 and E14.5 embryos (Fig 3C and F).
Figure 3. More endocrine and fetal β‐cells are generated in the dorsal pancreas.
-
A–IFlow cytometric analysis of endocrine progenitors and β‐cells in the ventral pancreases (V. P.) and dorsal pancreases (D. P.). (A, D, and G) Dissected ventral and dorsal pancreatic tissues. Scale bar: 500 μm. (B, E, and H) FACS gating for sorting Ngn3‐GFP+ or Ins1‐RFP+ cells from the V. P. and D. P. (C and F) Statistical analysis of percentages of Ngn3‐GFPhigh cells among Ngn3‐GFP+ cells in the V. P. and D. P. (I) Statistical analysis of percentages of Ins1‐RFP+ cells among total pancreatic cells in the V. P. and D. P. Data in (C, F, and I) show the mean ± SEM; n = number of independent biological replicates, unpaired t‐test. ***P‐value < 0.001.
-
JDifferentially expressed genes among cells from VPR, DPR, the V. P., and D. P. at various developmental stages. The numbers indicate significantly highly expressed genes in the ventral (blue) or dorsal (orange) regions. The dotted lines represent the twofold change threshold.
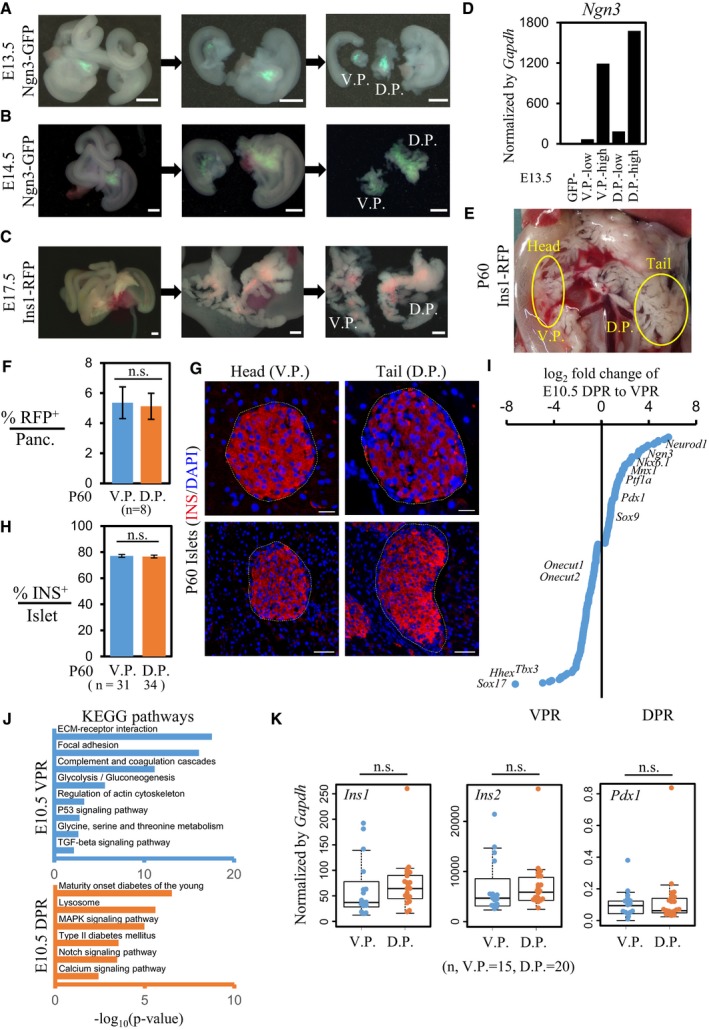
Figure EV4. Dissection of pancreases for FACS sorting and gene expression profile analyses.
-
A–CStepwise dissection of the dorsal pancreases (D.P.) and ventral pancreases (V.P.) from E13.5, E14.5, and E17.5 embryos. Scale bar: 500 μm.
-
DExpression levels of Ngn3 in E13.5 Ngn3‐GFPlow and Ngn3‐GFPhigh cells from the V.P. and D.P.
-
EDissection of the head and tail regions from adult pancreases after collagenase perfusion.
-
FFlow cytometric analysis of the β‐cell mass in head and tail regions. The data are presented as the mean ± SEM; n = number of mice, unpaired t‐test.
-
GImmunostaining of INS in islets from the head and tail regions of adult pancreas. Scale bar: 20 μm (upper) or 50 μm (lower).
-
HStatistical analysis of the percentage of INS+ cells per islet. The data are presented as the mean ± SEM; n = number of islets, unpaired t‐test.
-
IHighly differentially expressed genes in E10.5 dorsal and ventral Pdx1‐GFP+ cells. The key TFs for pancreas, liver, and EHBD development are listed.
-
JSelected enriched KEGG pathway terms for E10.5 dorsal and ventral Pdx1‐GFP+ cells.
-
KExpression levels of β‐cell marker genes in single β‐cells from adult ventral or dorsal pancreases. Central line in the box represents median; box limits represent the first and third quartile; whiskers represent 1.5 × interquartile range. n = number of cells, unpaired Wilcoxon rank‐sum test.
Next, we determined whether the higher ratio of Ngn3‐GFPhigh cells was correlated with a greater number of β‐cells in the dorsal pancreas. Similarly, we analyzed β‐cells in E17.5 ventral and dorsal pancreases from an Insulin1‐RFP (Ins1‐RFP) transgenic mouse strain 48. We dissected whole ventral and dorsal pancreatic tissues and performed flow cytometric analyses, which revealed a higher percentage of Ins1‐RFP+ cells in the dorsal pancreases compared with the ventral pancreases (Figs 3G–I and EV4C). In adult animals, the body and tail regions of the pancreas were derived from the dorsal pancreas, and the head region was derived from the ventral pancreas. We then dissociated the pancreatic cells from the tail and head regions (Fig EV4E) and compared the density of the β‐cell mass between these two regions using flow cytometry. However, the percentages of INS+ cells from the pancreatic tissue or individual islets in the tail and head regions were not significantly different (Fig EV4E–H), consistent with previously reported findings in rats 49. Thus, these results suggest a secondary mechanism by which the ventral pancreas manages to compensate for the lower β‐cell mass at a late developmental stage.
To determine whether the gene expression profiles of the differentiated endocrine progenitors and β‐cells from the ventral and dorsal pancreases were identical, we performed bulk‐cell RNA‐seq on 5–7 × 10⁴ cells purified from E10.5 Pdx1‐GFP+, E14.5 Ngn3‐GFPlow, and Ngn3‐GFPhigh, and E17.5 Ins1‐RFP+ ventral and dorsal pancreatic tissues (Figs 3J and EV2G, and Dataset EV1). Consistent with a previous report 24, we identified more than 3,000 genes that were differentially expressed between E10.5 Pdx1‐GFP+ cells from the VPR and DPR (Figs 1D and 1E, and 3J, Dataset EV3). Moreover, DPR cells highly expressed TFs implicated in pancreatic development, such as Pdx1, Nkx6.1, Ptf1a, Mnx1, and Sox9 (Fig EV4I). We also identified the different cell signaling pathways involved in VPR and DPR development using Kyoto Encyclopedia of Genes and Genomes (KEGG) pathway enrichment analysis 50 (Fig EV4J and Dataset EV3). Among the endocrine progenitors at E14.5 or β‐cells at E17.5 from the ventral and dorsal pancreases, we detected only a small number of genes exhibiting significantly different expression levels; however, the variations were primarily within a range of ± twofold (Fig 3J). Single‐cell quantitative PCR showed that the individual β‐cells from the pancreatic tail and head expressed the β‐cell featured genes Ins1, Ins2, and Pdx1 at similar levels (Fig EV4K). Together, our data reveal the elevated potential of the dorsal pancreas to generate a second wave of endocrine progenitors or fetal islet lineages.
Three cell lineages in the E10.5 VPR are derived from a common group of progenitors
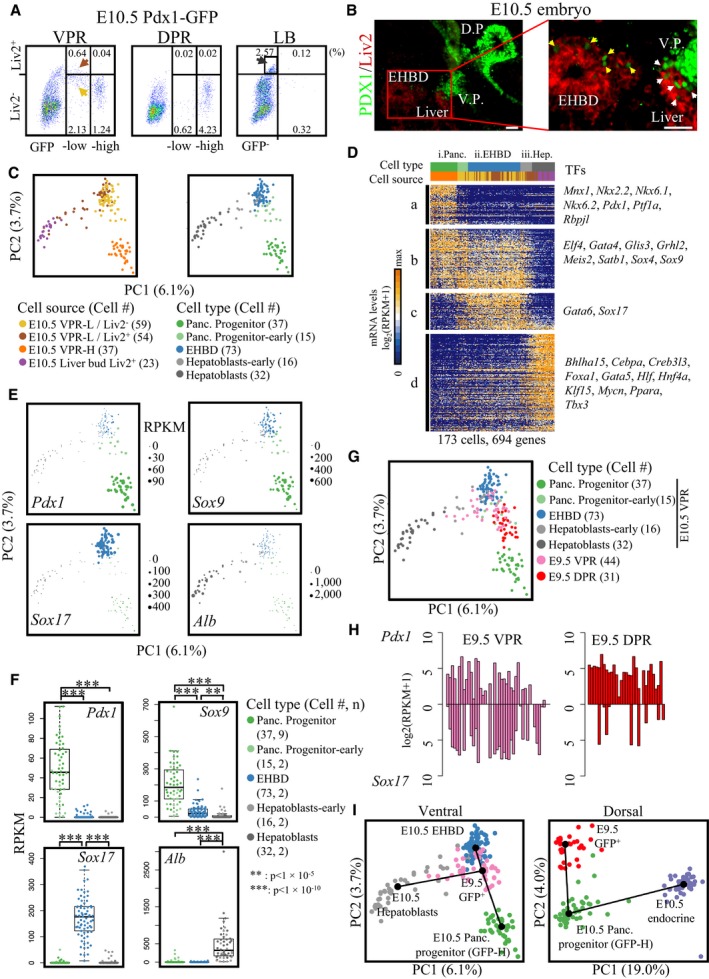
The presence of hepatic and ductal lineage markers in GFPlow VPR cells at E10.5 indicated the heterogeneity of the cell subtypes in this population. To elucidate the composition and developmental potential of GFPlow VPR cells, we focused our analyses on this population. Our previous study revealed co‐expression of a hepatoblast surface marker, Liv2, on some Pdx1‐GFP+ cells 47. To determine which subpopulation of Pdx1‐GFP+ cells expressed the Liv2 marker, we stained VPR and DPR cells with a Liv2 antibody and performed a flow cytometric analysis. We used cells from the E10.5 liver buds as a positive control. Among Pdx1‐GFP+ cells, we detected Liv2+ cells only in the GFPlow VPR cell population (Fig 4A). Notably, Liv2+ cells constituted only 23% of the total GFPlow VPR cells. Moreover, we identified that GFPlow/Liv2+ cells were mainly located at the adjunct region of the liver, pancreatic, and EHBD buds (Fig 4B). To thoroughly characterize the cell types found among GFPlow VPR cells, we isolated 54 Liv2+ and 59 Liv2− cells from the GFPlow VPR population for single‐cell RNA‐seq analyses. To determine the specification pathway of GFPlow VPR cells, we also performed single‐cell RNA‐seq on 23 Liv2+ hepatoblasts from E10.5 liver buds. Based on PCA, a fraction of the Liv2+/GFPlow cells showed a tendency to develop into hepatoblasts and a fraction of the Liv2−/GFPlow cells traced a path toward the GFPhigh VPR cluster. In contrast, the remainder of the Liv2+ and Liv2− cells remained together in the PCA plot (Fig 4C). Hierarchical clustering analysis divided these E10.5 cells into three major groups based on the expression patterns of cluster “a–d” genes (Figs 4D and EV5A, and Dataset EV4). Group i cells included the GFPhigh cells and some GFPlow/Liv2− cells; this group highly and exclusively expressed cluster “a” genes, which included key TFs in pancreatic progenitor cells, such as Pdx1, Ptf1a, Mnx1, Nkx2.2, Nkx6.1, and Nkx6.2 (Fig 4D–F). GO analysis revealed that cluster “a” contained genes associated with pancreatic development (Fig EV5A). Although the GFPlow cells in this group expressed cluster “a” genes at relatively low levels, they clearly displayed a tendency to develop into the pancreatic lineage (Fig 4C). In cells of Group ii and Group iii, Pdx1 transcripts were barely detected (Figs 4E and F, and EV5B). However, due to the persistence of the GFP protein even after Pdx1 was turned off, we were able to sort these immediate descendants of the Pdx1‐expressing cells. As Sox17 marks Pdx1‐induced EHBDs 30, Group ii cells highly expressed Sox17 in cluster “c” genes, which contained GO items for epithelial development and cell adhesion and were designated EHBDs (Figs 4D–F and EV5A). Group iii cells consisted of Liv2+ hepatoblasts and GFPlow/Liv2+ cells (Fig 4C). The hepatic marker gene Alb, liver metabolic process‐related genes, and key TFs for hepatic development, such as Hnf4a, Cebpa, Foxa1, and Tbx3 51, were identified in this group (Figs 4D–F and EV5A). Thus, the GFPlow cells in this group were specified as hepatoblasts. Curiously, cluster “b” genes were expressed in both pancreatic progenitor cells and EHBDs, suggesting a close relationship between these two cell lineages. Based on our single‐cell transcriptomic analyses, Pdx1‐induced cells in the VPR at E10.5 gave rise to EHBDs, hepatoblasts, and Pdx1high pancreatic progenitor cells.
Figure 4. Three cell lineages among GFPlow VPR cells.
-
AFlow cytometric analyses of Liv2+ cells in the VPR, DPR, and the liver buds (LB). Liv2+ cells from the VPR‐L (brown arrow), Liv2− cells from the VPR‐L (yellow arrow), and Liv2+ cells from the LB (black arrow) were sorted for single‐cell RNA‐seq.
-
BImmunofluorescence of PDX1 and Liv2 on sagittal section of E10.5 mouse embryo. The white and yellow arrows denote PDX1low/Liv2+ cells in the liver and EHBD regions, respectively. Scale bar: 50 μm.
-
CPCA plot of single‐cell transcriptomes from the indicated cells (left). Each dot represents a single cell. All cells are classified into three groups (right). The two panels represent the same PCA coordinates.
-
DHierarchical clustering of 694 genes correlated with the first two PCs identified three major distinct cell lineages (P < 1 × 10⁻⁶). Each column represents a single cell, and each row represents one gene. Cells were re‐ordered according to the value of PC1 or PC2. Genes in clusters “a, b” and “c, d” were re‐ordered by correlations with PC2 and PC1, respectively. The color of the cell type and cell source are indicated in (C). Lineage‐specific TFs are listed on the right.
-
E, FThe gene expression values of lineage marker genes were projected onto the PCA (E) and box (F) plots. Each point represents a cell. The y‐axes of the box plots represent the expression levels (RPKM). Central line in the box represents median; box limits represent the first and third quartile; whiskers represent 1.5 × interquartile range. Unpaired Wilcoxon rank‐sum test. Cell # = the number of cells. n = number of independent biological replicates. **P‐value < 1 × 10⁻⁵; ***P‐value < 1 × 10⁻¹⁰.
-
GPCA plot of single‐cell transcriptomes from the indicated cells. Each dot represents a single cell. The PCA was performed using the same PC1 and PC2 in (C).
-
HPdx1 and Sox17 expression levels in E9.5 VPR and DPR cells.
-
IInferred ventral and dorsal pancreatic lineage relationships analyzed by minimum spanning tree.
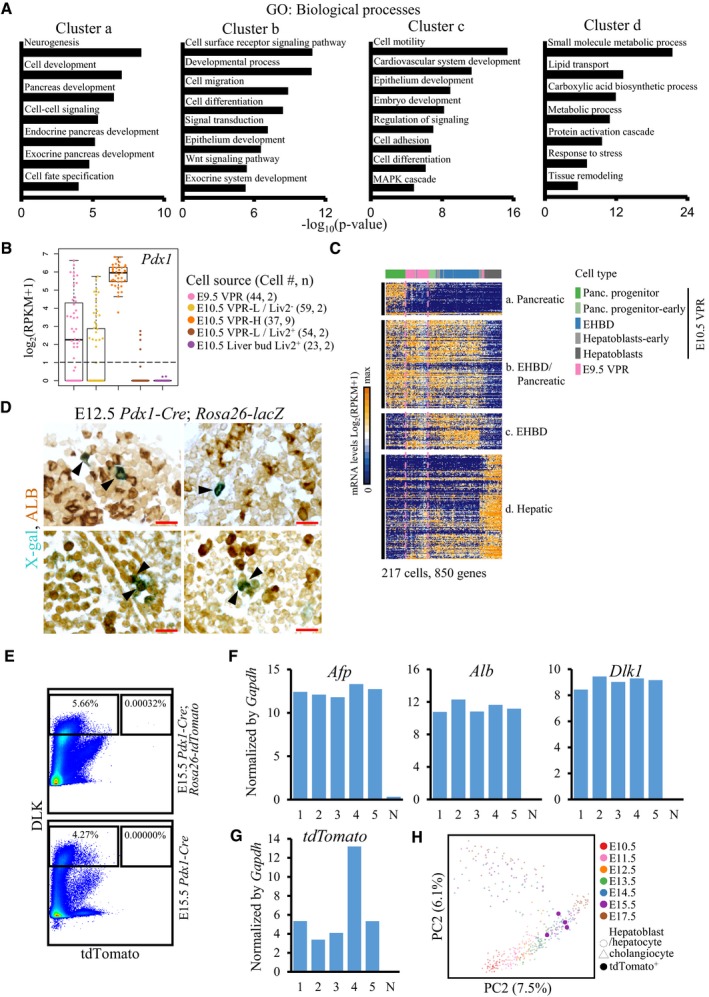
Figure EV5. Three cell lineages in E10.5 GFP low VPR cells.
-
ASelected enriched GO categories of cluster “a–d” genes in Fig 4D.
-
BExpression of Pdx1 in the cells from VPR or liver bud. Each point represents a cell. The y‐axes of the box plots represent the expression levels (log2(RPKM+1)). Central line in the box represents median; box limits represent the first and third quartile; whiskers represent 1.5 × interquartile range. Cell # = the number of cells. n = number of independent biological replicates.
-
CHierarchical cluster of 850 genes correlated with PC1 and PC2 of the corresponding cells indicates that the majority of E9.5 VPR cells were not specified into the three lineages of E10.5 VPR cells (P < 1 × 10⁻⁶). Each column represents a single cell, and each row represents one gene.
-
DGenetic tracing of Pdx1‐expressing cells in the liver. The arrowheads denote cells co‐stained with X‐gal and ALB in each section. Scale bar: 20 μm.
-
EFACS gating strategies used to sort tdTomato+/DLK+ cells from the E15.5 liver tissue.
-
F, GThe expression levels of Afp, Alb, Dlk1, and tdTomato in tdTomato+/DLK+ cells from the liver were validated by single‐cell RT‐qPCR. N, tdTomato− cell control. Cells were sorted from five E15.5 Pdx1‐Cre; Rosa26‐tdTomato liver tissue. 1–5 represent five individual tdTomato+ cells.
-
HPCA plot of single‐cell transcriptomes from tdTomato+ cells and embryonic hepatobiliary cells from previous study 53. Each dot represents a single cell.
To trace the common progenitors of these three groups of cells, we isolated GFP+ cells from the E9.5 VPR and performed single‐cell transcriptomic analyses. PCA of E9.5 VPR and E10.5 VPR cells together revealed that the majority of E9.5 VPR cells were intermediate between EHBDs, hepatoblasts, and pancreatic progenitor cells. Hierarchical clustering and heat map analyses showed that E9.5 VPR cells expressed most hepatoblast‐, EHBD‐, and pancreatic‐specific genes but at lower levels, indicating that most of them had not started to be specified into these three lineages (Figs 4G and EV5C, and Dataset EV4). The majority of the E9.5 VPR GFP+ cells co‐expressed Pdx1 and Sox17 (Fig 4H), which is consistent with a previous study showing that EHBD and pancreatic progenitors were derived from Pdx1 +/Sox17 + cells 30. Moreover, to reconstruct branched biological processes and define the relationships among VPR cells at E9.5 and the pancreas, EHBD, and liver lineages at E10.5, we applied an algorithm to generate a minimum spanning tree (MST) using these cells 52. We found that in the VPR, E9.5 GFP+ cells diverge along three separate trajectories toward the pancreas, EHBD, and liver lineages (Fig 4G and I). Along the trajectory toward hepatoblast lineage, the cells in intermediate state turned off the expression of Pdx1 (Figs 4E and EV5B) before they differentiated into hepatoblasts. However, in the DPR, E9.5 GFP+ cells (endocrine cells excluded) progress along only one differentiation path to become Pdx1‐GFPhigh cells (Fig 4G and I), and very few E9.5 GFP+ DPR cells expressed Sox17 (Fig 4H). Thus, these data suggest that E9.5 VPR GFP+ cells, which express Pdx1 and Sox17, retain the potential to differentiate into pancreas, EHBD, and liver lineages, whereas E9.5 DPR GFP+ cells are restricted to differentiate into the pancreatic lineage.
To investigate whether the Pdx1‐expressing cells could give rise to liver cells, we used a Pdx1‐Cre transgene crossed with the Rosa26‐lacZ reporter mouse strain to trace the fate of these cells. At E12.5, we sectioned the embryo sagittally and stained for X‐Gal and ALB. We clearly observed blue cells in the pancreatic and EHBD regions (Fig 5). Although Pdx1‐expressing cells had hardly been detected in the E9.5 liver bud 30, we captured a few ALB+/blue cells in the liver region at E12.5. To isolate the progeny of Pdx1‐expressing cells in the liver for single‐cell transcriptomic analysis, we crossed the Pdx1‐Cre transgene with the Rosa26‐tdTomato reporter mouse strain. At E15.5, we stained cells with antibodies against the hepatocyte marker DLK and performed flow cytometric analyses. We observed that only 0.00032% of E15.5 fetal liver cells were tdTomato+/DLK+ (Fig EV5E). Single‐cell RT–qPCR analysis revealed that tdTomato‐expressing cells co‐expressed the hepatocyte marker genes Alb, Afp, and Dlk1 (Fig EV5F and G). Single‐cell RNA sequencing and PCA showed that these cells clustered with hepatocytes we identified in our previous study 53 (Fig EV5H). Therefore, the genetic tracing study demonstrated that the Pdx1‐expressing cells in the ventral region retained the potential to develop into hepatic cells, but these cells have almost no contribution to the liver mass. Given that E9.5 Pdx1 +/Sox17 + VPR cells showed relative homogeneity on the PCA plot (Fig 4G) and these cells have been demonstrated to generate both pancreatic and EHBD lineages, our studies suggest that E9.5 GFP+ VPR cells are intermediate progenitors of pancreas, EHBD, and liver cells.
Figure 5. Hepatic potential of ventral Pdx1‐expressing cells.
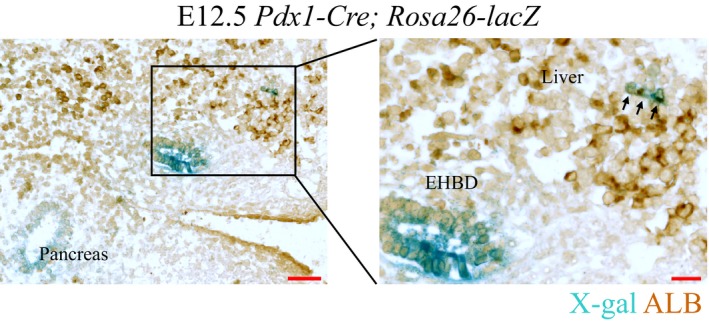
Sagittal section of E12.5 Pdx1‐Cre; Rosa26‐LacZ mouse embryo counterstained for ALB (brown). X‐gal staining (blue) showing cells derived from Pdx1‐expressing cells. The arrowheads indicate cells co‐stained with X‐gal and ALB (see Fig EV5D for more images of different sections). EHBD, extrahepatic bile ducts. Scale bar: 50 μm (left) or 20 μm (right).
Discussion
Although all pancreatic cell types develop from Pdx1+ pancreatic progenitors in both the VPR and DPR and differential regulatory mechanisms have been suggested for ventral versus dorsal pancreatic differentiation, we still possess limited knowledge regarding cell type composition and fate mapping during ventral and dorsal pancreatic progenitor specification. In this study, we isolated Pdx1‐GFPlow and Pdx1‐GFPhigh cells from the VPR and DPR and mapped pancreatic cell fate specification based on single‐cell transcriptomic analyses. In the VPR, the initially expressed Pdx1low/Sox17low cells are indicated to be multipotent and give rise to EHBDs (Sox17high/Pdx1−), hepatoblasts (Sox17−/Pdx1−/Alb+), and pancreatic progenitor cells (Sox17−/Pdx1high). However, Pdx1low cells contribute little to the mass of liver progenitors because the majority of hepatoblasts have never expressed Pdx1 (Figs 4A and 5, and EV5E). In the DPR, Pdx1high pancreatic progenitor cells appear to be directly specified from endodermal cells without the intermediate stage observed in the VPR. Although the dorsal pancreatic specification is initiated approximately half a day earlier than the ventral specification, the Pdx1high cells in both anlages are identical at the transcriptomic level. However, the Pdx1low cells in the DPR are precocious pancreatic endocrine cells (also called first wave endocrine cells), which are completely distinct from the Pdx1low cells in the VPR. These findings in the DPR are consistent with those of a recent study 54, which showed that E9.5 dorsal foregut progenitors could be classified into pancreatic progenitors and pancreatic endocrine and duodenal progenitors based on the expression patterns of marker genes. Therefore, our study provides a precise fate map of ventral and dorsal pancreatic lineage specification (Fig 6).
Figure 6. Working model of distinct ventral and dorsal pancreatic programs.
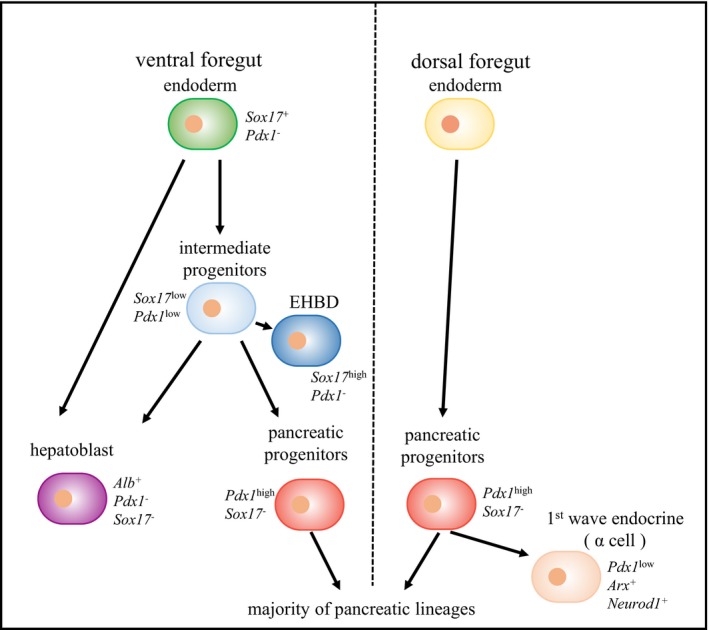
In the ventral pancreatic program, the ventral foregut endoderm cells first differentiate into Pdx1low intermediate progenitors, which can generate hepatoblasts, extrahepatobiliary cells, and Pdx1high pancreatic progenitors. In the dorsal pancreatic program, the dorsal foregut endoderm cells directly differentiate into Pdx1high pancreatic progenitors, a fraction of which further differentiates into Pdx1low precocious pancreatic endocrine lineages. In both programs, Pdx1high cells are identical at the transcriptomic level and generate the majority of pancreatic lineages.
The difference in pancreatic progenitors between the dorsal and ventral regions is significant at E9.5. This difference is presumed to occur at an earlier stage of development. The dorsal and ventral endoderm cells receive distinct cell signals from their adjacent tissues, which might preset the different programs spatially, guiding the differentiation of endoderm cells. However, the difference in molecule levels between dorsal and ventral endoderm cells is still unclear. Further studies of the nature of dorsal and ventral endoderm cells at the single‐cell level will help us to address these questions.
During β‐cell induction, generation of high‐quality pancreatic progenitors is critical to produce functional β‐cells 5. Our in vivo studies revealed direct and efficient generation of pancreatic progenitor cells in the dorsal pancreas. However, due to the lack of a careful analysis of cell subtypes and transcriptomes in VPR and DPR cells, it was difficult to assess whether the ventral or dorsal pancreatic program is activated during pancreatic progenitor differentiation in vitro. Jennings et al recently performed comparative transcriptomic analyses of cell populations from human embryonic liver buds and dorsal pancreatic buds and identified 13 genes highly expressed in the dorsal pancreas. In addition, RT–qPCR examination showed that in vitro differentiated pancreatic endoderm cells highly expressed these 13 genes compared to the in vitro derived hepatic cells. Based on these observations, they drew the conclusion that the pancreatic differentiation of hPSCs follows a dorsal rather than a ventral pancreatic program 55. However, this conclusion, which was based on a small group of genes, needs to be verified at the single‐cell transcriptomic level. Therefore, single‐cell RNA‐seq analyses on VPR and DPR cells from human embryos will provide a benchmark for evaluating the quality and differentiation pathways of induced pancreatic progenitors.
Materials and Methods
Mouse lines and embryo dissection
Mice were bred and maintained in the animal facility at Peking University. All mice were maintained in a pathogen‐free environment with constant temperature and humidity and 12‐hr/12‐hr light/dark cycle and received an autoclaved standard diet and water ad libitum. Male mice were weaned to regular chow at postnatal day 21 (P21) and housed in clear cages in groups of no more than five animals per cage. Experiments were conducted according to the Animal Protection Guidelines of Peking University.
Pdx1‐GFP 35, Pdx1‐Cre 56, Ngn3‐GFP 45, Ins1‐RFP 48, Rosa26‐lacZ 57, and Rosa26‐tdTomato mice were used in this study. Embryonic day 0.5 was designated the time point at which the vaginal plug appeared. Dorsal and ventral pancreatic tissue from E9.5, E10.5, E13.5, E14.5, and E17.5 embryos was dissected under a fluorescence stereomicroscope (Luma V12, Zeiss).
Cell sorting
Dissected E9.5, E10.5, E13.5, and E14.5 dorsal and ventral pancreatic tissue and E15.5 liver were dissociated by incubation in 0.25% trypsin for 5 min at 37°C. Then, 0.4 volumes of PBS were added to stop the reaction. For E17.5 pancreases, a digestion process involving 0.5 mg/ml collagenase for 5 min at 37℃ was performed prior to trypsin treatment. For P60 mice, the islets were digested by collagenase perfusion. Anti‐Liv2 (MBL, D118‐3), PE goat anti‐rat IgG (Biolegend, 405406), and anti‐Dlk‐FITC (MBL, D187‐4) antibodies were used for cell sorting. Cells were sorted at 4°C using a FACS Aria SORP flow cytometer (BD Biosciences).
Bulk‐cell RNA‐seq
Total RNA was isolated from approximately 5–7 × 10⁴ sorted cells using an RNeasy Micro Kit (Qiagen, 74004). Poly(A) RNA was further purified with the NEBNext Poly(A) mRNA Magnetic Isolation Module (NEB #E7490). Libraries were prepared using a NEBNext Ultra Directional RNA Library Prep Kit for Illumina (NEB #E7420) according to the manufacturer's instructions. The quality of the cDNA libraries was assessed with an Advanced Analytical Fragment Analyzer. Each RNA‐seq analysis was performed with two independent biological replicates. The correlation between replicates is shown in Fig EV2G.
Single‐cell RNA‐seq
After sorting, cells were manually picked with a mouth pipette under the microscope. RNA‐seq libraries were prepared according to the Smart‐seq2 method as previously reported 36. In every single‐cell sample, we included 0.05 μl of ERCC spike‐in (Life Technologies, 4456740) at a 1:500,000 dilution. Amplified cDNAs were analyzed using the Advanced Analytical Fragment Analyzer. Two nanograms of cDNA was used to prepare the libraries using a TruePrep DNA Library Prep Kit (Vazyme, TD502).
RT–qPCR
Total RNA from sorted cells was prepared using an RNeasy Micro Kit (Qiagen, 74004). First‐strand cDNA was synthesized using HiScript II Q RT SuperMix (Vazyme, R223).
The primers used for RT–qPCR were listed in Table EV1.
Whole‐mount X‐gal staining, immunostaining, and BrdU incorporation
E12.5 embryos were dissected and fixed for 30 min at room temperature in fixation buffer (0.2% glutaraldehyde, 5 mM EGTA, and 2 mM MgCl2 in PBS). After fixation, the embryos were washed three times for 30 min each at room temperature in washing buffer (2 mM MgCl2, 0.02% NP‐40, 0.01% sodium deoxycholate in PBS). Specimens were stained overnight at 37°C in washing buffer containing 1 mg/ml X‐gal, 5 mM potassium ferricyanide, and 5 mM potassium ferrocyanide. After staining, the embryos were dehydrated and embedded in paraffin. The 5‐μm‐thick paraffin sections were deparaffinized and dehydrated. The ABC Kit (Vector Labs), anti‐ALB (Santa Cruz, sc‐46293), and biotinylated anti‐goat IgG (Vector Labs, BA‐5000) were used to perform immunohistochemistry. Images were acquired with a Zeiss slide scanner (Zeiss Axio Scan.Z1).
E10.5 mouse embryos and adult pancreata were embedded in paraffin and sectioned into 5‐μm‐thick slices for immunofluorescence with antibodies against antibodies anti‐INSULIN (Abcam, ab7842), anti‐PDX1 (Abcam, ab47383), anti‐Liv2 (MBL, D118‐3), Alexa Fluor 594 goat anti‐guinea pig IgG (Thermo, A11076), Alexa Fluor 488 donkey anti‐goat IgG (Thermo, A11055), and Alexa Fluor 594 donkey anti‐rat IgG (Thermo, A21209). Images were acquired using a Zeiss Axio Imager.M2.
Intraperitoneal injection of BrdU (1 mg/25 g of body weight) was performed 2 hours before sacrifice. The cells were stained with an APC BrdU Flow Kit (BD, 552598) according to the manufacturer's instructions, and flow cytometric analysis was conducted with a FACS Aria SORP flow cytometer (BD Biosciences).
Processing of bulk‐cell RNA‐seq data
Bulk‐cell RNA‐seq libraries were sequenced as 101‐bp paired‐end reads on an Illumina HiSeq 2000 or as 51‐bp single‐end reads on an Illumina HiSeq 2500. We aligned the sequencing reads to the Mus musculus reference genome GRCm38/mm10 using TopHat (v2.1.0) 58 with the parameter “‐o out_dir ‐G gtf –transcriptome‐index trans_index bowtie2_index input_fastq1 input_fastq2”. Reads aligned to genes were counted with HTSeq (v 0.6.0) 59 with the parameters “‐f bam ‐r pos ‐s reverse ‐a 30”. Reads of biological replicates were pooled. RPKM (reads per kilobase of the longest transcript per million mapped reads) was employed to quantify gene expression levels. We performed differential expression analysis of bulk‐cell RNA‐seq using DESeq2 (v1.12.4) 60 and set the padj (adjusted P‐value) cutoff at 0.05. KEGG 50 pathway enrichment analysis was performed using DAVID (v6.7) 61, 62. GO (Gene Ontology) 63 enrichment analysis was performed using GOstats (v2.34.0) 64.
Processing of single‐cell RNA‐seq data
Single‐cell RNA‐seq libraries were sequenced as 51‐bp single‐end reads on an Illumina HiSeq 2500. Alignments were performed as previously described for the bulk‐cell RNA‐seq analyses. Cells with < 0.5 million mapped reads were excluded from downstream analyses. Reads aligned to genes were counted with HTSeq (v0.6.0) 59 with the parameters “‐f bam ‐r pos ‐s no ‐a 30”. RPKM was employed to quantify gene expression levels, which were highly correlated with the mRNA molecule number and gene expression levels of bulk‐cell RNA‐seq (Fig EV2E and F).
To account for technical noise, we performed a gamma generalized linear model fit on “average normalized read count” and “the square of the coefficient of variation (CV2)” of 92 ERCC spike‐ins (Fig EV2A) and identified significantly highly variable genes (false discovery rate (FDR) < 0.1), as previously described 65. PCA was performed using the log2(RPKM + 0.1) of highly variable genes with FactoMineR (v1.31.4) 66. The R package ggplot2 (v2.0.0) 67 was used to generate PCA graphs. To explore the cell lineages in dorsal or ventral Pdx1+ cells, the medoid of each group in the PCA was calculated, and a minimum spanning tree (MST) was constructed with vegan (v2.4‐1) 52 (Fig 4I).
To reduce noise, we identified significantly higher principal component (PC) loading genes among the PCA results using the dimdesc function of FactoMineR (v1.31.4) 66, by which we performed a t‐test and generated a P‐value for each gene. To obtain heterogeneously expressed genes, we filtered out genes with a RPKM ≥ 1 in ≥ 90% of the total cells. The transcription factor gene list was obtained from AnimalTFDB 68. To classify the subgroups of cells, we performed Ward hierarchical clustering based on the Spearman correlation distance metric using the genes identified as having significantly higher PC loading (see P‐values in the corresponding Figure legends).
Statistics and reproducibility
Unpaired two‐tailed t‐tests were performed, and SEM was calculated for FACS analyses, cell number calculation of β‐cells, and RT–qPCR, with at least three independent experiments/biological replicates (P‐value < 0.05 was considered significant). All images are representative of experiments that were performed independently at least three times. The unpaired two‐tailed Wilcoxon rank‐sum test was performed, as shown in a box plot in Figs 2A–C and 4F, and EV1D and EV4K. The batch information of the cells is shown in Dataset EV1.
Data availability
The RNA‐seq data from this publication have been deposited to the Gene Expression Omnibus (GEO) and assigned the identifier GSE86225.
Author contributions
C‐RX conceived the project; C‐RX, L‐CL, W‐LQ, and XC designed the research; L‐CL, Y‐WZ, Z‐RX, Y‐NX, CH, and L performed the research; L‐CL, W‐LQ, Y‐WZ, Z‐RX, PY, and C‐RX analyzed the data; L‐CL and C‐RX wrote the paper.
Conflict of interest
The authors declare that they have no conflict of interest.
Supporting information
Expanded View Figures PDF
Table EV1
Dataset EV1
Dataset EV2
Dataset EV3
Dataset EV4
Review Process File
Acknowledgements
We thank Dr. Gérard Gradwohl for the Ins1‐RFP transgenic mouse; Dr. Fuchou Tang for single‐cell RNA‐seq advice; Drs. Ken Zaret, Erfei Bi, and Cheng Li for comments on the manuscript; members of the Xu laboratory for advice and comments; and the Peking‐Tsinghua Center for Life Science Computing Platform. We thank Mr. Zhonglin Fu and Ms. Fei Wang from the National Center for Protein Sciences, Peking University, for assistance with FACS, and Mr. Guopeng Wang from the Core Facility of the School of Life Sciences, Peking University, for fluorescent image acquisition. This work was supported by the Ministry of Science and Technology of China (2015CB942800 to C.‐R.X., 2017YFA0102702 to X.C.), the National Natural Science Foundation of China (31521004, 31471358, and 31522036 to C.‐R.X.), funding from Peking‐Tsinghua Center for Life Sciences to C.‐R.X, and funding from Shanghai Institutes for Biological Sciences, CAS (2014SSTP02 to X.C.).
EMBO Reports (2018) 19: e46148
References
- 1. D'Amour KA, Bang AG, Eliazer S, Kelly OG, Agulnick AD, Smart NG, Moorman MA, Kroon E, Carpenter MK, Baetge EE (2006) Production of pancreatic hormone‐expressing endocrine cells from human embryonic stem cells. Nat Biotechnol 24: 1392–1401 [DOI] [PubMed] [Google Scholar]
- 2. Kroon E, Martinson LA, Kadoya K, Bang AG, Kelly OG, Eliazer S, Young H, Richardson M, Smart NG, Cunningham J et al (2008) Pancreatic endoderm derived from human embryonic stem cells generates glucose‐responsive insulin‐secreting cells in vivo . Nat Biotechnol 26: 443–452 [DOI] [PubMed] [Google Scholar]
- 3. Pagliuca FW, Millman JR, Gurtler M, Segel M, Van Dervort A, Ryu JH, Peterson QP, Greiner D, Melton DA (2014) Generation of functional human pancreatic beta cells in vitro . Cell 159: 428–439 [DOI] [PMC free article] [PubMed] [Google Scholar]
- 4. Rezania A, Bruin JE, Arora P, Rubin A, Batushansky I, Asadi A, O'Dwyer S, Quiskamp N, Mojibian M, Albrecht T et al (2014) Reversal of diabetes with insulin‐producing cells derived in vitro from human pluripotent stem cells. Nat Biotechnol 32: 1121–1133 [DOI] [PubMed] [Google Scholar]
- 5. Russ HA, Parent AV, Ringler JJ, Hennings TG, Nair GG, Shveygert M, Guo T, Puri S, Haataja L, Cirulli V et al (2015) Controlled induction of human pancreatic progenitors produces functional beta‐like cells in vitro . EMBO J 34: 1759–1772 [DOI] [PMC free article] [PubMed] [Google Scholar]
- 6. Schulz TC, Young HY, Agulnick AD, Babin MJ, Baetge EE, Bang AG, Bhoumik A, Cepa I, Cesario RM, Haakmeester C et al (2012) A scalable system for production of functional pancreatic progenitors from human embryonic stem cells. PLoS ONE 7: e37004 [DOI] [PMC free article] [PubMed] [Google Scholar]
- 7. Slack JM (1995) Developmental biology of the pancreas. Development 121: 1569–1580 [DOI] [PubMed] [Google Scholar]
- 8. Pan FC, Wright C (2011) Pancreas organogenesis: from bud to plexus to gland. Dev Dyn 240: 530–565 [DOI] [PubMed] [Google Scholar]
- 9. Shih HP, Wang A, Sander M (2013) Pancreas organogenesis: from lineage determination to morphogenesis. Annu Rev Cell Dev Biol 29: 81–105 [DOI] [PubMed] [Google Scholar]
- 10. Ward AB, Warga RM, Prince VE (2007) Origin of the zebrafish endocrine and exocrine pancreas. Dev Dyn 236: 1558–1569 [DOI] [PubMed] [Google Scholar]
- 11. Wilfinger A, Arkhipova V, Meyer D (2013) Cell type and tissue specific function of islet genes in zebrafish pancreas development. Dev Biol 378: 25–37 [DOI] [PMC free article] [PubMed] [Google Scholar]
- 12. Spooner BS, Walther BT, Rutter WJ (1970) The development of the dorsal and ventral mammalian pancreas in vivo and in vitro . J Cell Biol 47: 235–246 [DOI] [PMC free article] [PubMed] [Google Scholar]
- 13. Suckale J, Solimena M (2008) Pancreas islets in metabolic signaling–focus on the beta‐cell. Front Biosci 13: 7156–7171 [DOI] [PubMed] [Google Scholar]
- 14. Guz Y, Montminy MR, Stein R, Leonard J, Gamer LW, Wright CV, Teitelman G (1995) Expression of murine STF‐1, a putative insulin gene transcription factor, in beta cells of pancreas, duodenal epithelium and pancreatic exocrine and endocrine progenitors during ontogeny. Development 121: 11–18 [DOI] [PubMed] [Google Scholar]
- 15. Jonsson J, Carlsson L, Edlund T, Edlund H (1994) Insulin‐promoter‐factor 1 is required for pancreas development in mice. Nature 371: 606–609 [DOI] [PubMed] [Google Scholar]
- 16. Offield MF, Jetton TL, Labosky PA, Ray M, Stein RW, Magnuson MA, Hogan BL, Wright CV (1996) PDX‐1 is required for pancreatic outgrowth and differentiation of the rostral duodenum. Development 122: 983–995 [DOI] [PubMed] [Google Scholar]
- 17. Gu G, Brown JR, Melton DA (2003) Direct lineage tracing reveals the ontogeny of pancreatic cell fates during mouse embryogenesis. Mech Dev 120: 35–43 [DOI] [PubMed] [Google Scholar]
- 18. Gu G, Dubauskaite J, Melton DA (2002) Direct evidence for the pancreatic lineage: NGN3+ cells are islet progenitors and are distinct from duct progenitors. Development 129: 2447–2457 [DOI] [PubMed] [Google Scholar]
- 19. Hebrok M, Kim SK, Melton DA (1998) Notochord repression of endodermal Sonic hedgehog permits pancreas development. Genes Dev 12: 1705–1713 [DOI] [PMC free article] [PubMed] [Google Scholar]
- 20. Kim SK, Hebrok M, Melton DA (1997) Notochord to endoderm signaling is required for pancreas development. Development 124: 4243–4252 [DOI] [PubMed] [Google Scholar]
- 21. Lammert E, Cleaver O, Melton D (2001) Induction of pancreatic differentiation by signals from blood vessels. Science 294: 564–567 [DOI] [PubMed] [Google Scholar]
- 22. Yoshitomi H, Zaret KS (2004) Endothelial cell interactions initiate dorsal pancreas development by selectively inducing the transcription factor Ptf1a. Development 131: 807–817 [DOI] [PubMed] [Google Scholar]
- 23. Kumar M, Jordan N, Melton D, Grapin‐Botton A (2003) Signals from lateral plate mesoderm instruct endoderm toward a pancreatic fate. Dev Biol 259: 109–122 [DOI] [PubMed] [Google Scholar]
- 24. Rodriguez‐Seguel E, Mah N, Naumann H, Pongrac IM, Cerda‐Esteban N, Fontaine JF, Wang Y, Chen W, Andrade‐Navarro MA, Spagnoli FM (2013) Mutually exclusive signaling signatures define the hepatic and pancreatic progenitor cell lineage divergence. Genes Dev 27: 1932–1946 [DOI] [PMC free article] [PubMed] [Google Scholar]
- 25. Deutsch G, Jung J, Zheng M, Lora J, Zaret KS (2001) A bipotential precursor population for pancreas and liver within the embryonic endoderm. Development 128: 871–881 [DOI] [PubMed] [Google Scholar]
- 26. Tremblay KD, Zaret KS (2005) Distinct populations of endoderm cells converge to generate the embryonic liver bud and ventral foregut tissues. Dev Biol 280: 87–99 [DOI] [PubMed] [Google Scholar]
- 27. Zaret KS, Grompe M (2008) Generation and regeneration of cells of the liver and pancreas. Science 322: 1490–1494 [DOI] [PMC free article] [PubMed] [Google Scholar]
- 28. Jung J, Zheng M, Goldfarb M, Zaret KS (1999) Initiation of mammalian liver development from endoderm by fibroblast growth factors. Science 284: 1998–2003 [DOI] [PubMed] [Google Scholar]
- 29. Rossi JM, Dunn NR, Hogan BL, Zaret KS (2001) Distinct mesodermal signals, including BMPs from the septum transversum mesenchyme, are required in combination for hepatogenesis from the endoderm. Genes Dev 15: 1998–2009 [DOI] [PMC free article] [PubMed] [Google Scholar]
- 30. Spence JR, Lange AW, Lin SC, Kaestner KH, Lowy AM, Kim I, Whitsett JA, Wells JM (2009) Sox17 regulates organ lineage segregation of ventral foregut progenitor cells. Dev Cell 17: 62–74 [DOI] [PMC free article] [PubMed] [Google Scholar]
- 31. Zaret KS (2008) Genetic programming of liver and pancreas progenitors: lessons for stem‐cell differentiation. Nat Rev Genet 9: 329–340 [DOI] [PubMed] [Google Scholar]
- 32. Harrison KA, Thaler J, Pfaff SL, Gu H, Kehrl JH (1999) Pancreas dorsal lobe agenesis and abnormal islets of Langerhans in Hlxb9‐deficient mice. Nat Genet 23: 71–75 [DOI] [PubMed] [Google Scholar]
- 33. Haumaitre C, Barbacci E, Jenny M, Ott MO, Gradwohl G, Cereghini S (2005) Lack of TCF2/vHNF1 in mice leads to pancreas agenesis. Proc Natl Acad Sci USA 102: 1490–1495 [DOI] [PMC free article] [PubMed] [Google Scholar]
- 34. Li H, Arber S, Jessell TM, Edlund H (1999) Selective agenesis of the dorsal pancreas in mice lacking homeobox gene Hlxb9. Nat Genet 23: 67–70 [DOI] [PubMed] [Google Scholar]
- 35. Gu G, Wells JM, Dombkowski D, Preffer F, Aronow B, Melton DA (2004) Global expression analysis of gene regulatory pathways during endocrine pancreatic development. Development 131: 165–179 [DOI] [PubMed] [Google Scholar]
- 36. Picelli S, Faridani OR, Bjorklund AK, Winberg G, Sagasser S, Sandberg R (2014) Full‐length RNA‐seq from single cells using Smart‐seq2. Nat Protoc 9: 171–181 [DOI] [PubMed] [Google Scholar]
- 37. Jorgensen MC, Ahnfelt‐Ronne J, Hald J, Madsen OD, Serup P, Hecksher‐Sorensen J (2007) An illustrated review of early pancreas development in the mouse. Endocr Rev 28: 685–705 [DOI] [PubMed] [Google Scholar]
- 38. Zhou Q, Law AC, Rajagopal J, Anderson WJ, Gray PA, Melton DA (2007) A multipotent progenitor domain guides pancreatic organogenesis. Dev Cell 13: 103–114 [DOI] [PubMed] [Google Scholar]
- 39. Herrera PL (2000) Adult insulin‐ and glucagon‐producing cells differentiate from two independent cell lineages. Development 127: 2317–2322 [DOI] [PubMed] [Google Scholar]
- 40. Larsson LI (1998) On the development of the islets of Langerhans. Microsc Res Tech 43: 284–291 [DOI] [PubMed] [Google Scholar]
- 41. Jensen J, Heller RS, Funder‐Nielsen T, Pedersen EE, Lindsell C, Weinmaster G, Madsen OD, Serup P (2000) Independent development of pancreatic alpha‐ and beta‐cells from neurogenin3‐expressing precursors: a role for the notch pathway in repression of premature differentiation. Diabetes 49: 163–176 [DOI] [PubMed] [Google Scholar]
- 42. Brembeck FH, Moffett J, Wang TC, Rustgi AK (2001) The keratin 19 promoter is potent for cell‐specific targeting of genes in transgenic mice. Gastroenterology 120: 1720–1728 [DOI] [PubMed] [Google Scholar]
- 43. McGrath KE, Koniski AD, Maltby KM, McGann JK, Palis J (1999) Embryonic expression and function of the chemokine SDF‐1 and its receptor, CXCR4. Dev Biol 213: 442–456 [DOI] [PubMed] [Google Scholar]
- 44. Ruijtenberg S, van den Heuvel S (2016) Coordinating cell proliferation and differentiation: Antagonism between cell cycle regulators and cell type‐specific gene expression. Cell Cycle 15: 196–212 [DOI] [PMC free article] [PubMed] [Google Scholar]
- 45. Lee CS, Perreault N, Brestelli JE, Kaestner KH (2002) Neurogenin 3 is essential for the proper specification of gastric enteroendocrine cells and the maintenance of gastric epithelial cell identity. Genes Dev 16: 1488–1497 [DOI] [PMC free article] [PubMed] [Google Scholar]
- 46. Bechard ME, Bankaitis ED, Hipkens SB, Ustione A, Piston DW, Yang YP, Magnuson MA, Wright CV (2016) Precommitment low‐level Neurog3 expression defines a long‐lived mitotic endocrine‐biased progenitor pool that drives production of endocrine‐committed cells. Genes Dev 30: 1852–1865 [DOI] [PMC free article] [PubMed] [Google Scholar]
- 47. Xu CR, Li LC, Donahue G, Ying L, Zhang YW, Gadue P, Zaret KS (2014) Dynamics of genomic H3K27me3 domains and role of EZH2 during pancreatic endocrine specification. EMBO J 33: 2157–2170 [DOI] [PMC free article] [PubMed] [Google Scholar]
- 48. Piccand J, Meunier A, Merle C, Jia Z, Barnier JV, Gradwohl G (2014) Pak3 promotes cell cycle exit and differentiation of beta‐cells in the embryonic pancreas and is necessary to maintain glucose homeostasis in adult mice. Diabetes 63: 203–215 [DOI] [PMC free article] [PubMed] [Google Scholar]
- 49. Trimble ER, Renold AE (1981) Ventral and dorsal areas of rat pancreas: islet hormone content and secretion. Am J Physiol 240: E422–E427 [DOI] [PubMed] [Google Scholar]
- 50. Kanehisa M, Goto S (2000) KEGG: kyoto encyclopedia of genes and genomes. Nucleic Acids Res 28: 27–30 [DOI] [PMC free article] [PubMed] [Google Scholar]
- 51. Lemaigre FP (2009) Mechanisms of liver development: concepts for understanding liver disorders and design of novel therapies. Gastroenterology 137: 62–79 [DOI] [PubMed] [Google Scholar]
- 52. Oksanen J, Kindt R, Legendre P, O'Hara B, Stevens MHH, Oksanen MJ, Suggests M (2007) The Vegan Package. Community Ecol Package 10: 631–637 [Google Scholar]
- 53. Yang L, Wang WH, Qiu WL, Guo Z, Bi E, Xu CR (2017) A single‐cell transcriptomic analysis reveals precise pathways and regulatory mechanisms underlying hepatoblast differentiation. Hepatology 66: 1387–1401 [DOI] [PMC free article] [PubMed] [Google Scholar]
- 54. Larsen HL, Martin‐Coll L, Nielsen AV, Wright CVE, Trusina A, Kim YH, Grapin‐Botton A (2017) Stochastic priming and spatial cues orchestrate heterogeneous clonal contribution to mouse pancreas organogenesis. Nat Commun 8: 605 [DOI] [PMC free article] [PubMed] [Google Scholar]
- 55. Jennings RE, Berry AA, Gerrard DT, Wearne SJ, Strutt J, Withey S, Chhatriwala M, Piper Hanley K, Vallier L, Bobola N et al (2017) Laser capture and deep sequencing reveals the transcriptomic programmes regulating the onset of pancreas and liver differentiation in human embryos. Stem Cell Rep 9: 1387–1394 [DOI] [PMC free article] [PubMed] [Google Scholar]
- 56. Hingorani SR, Petricoin EF, Maitra A, Rajapakse V, King C, Jacobetz MA, Ross S, Conrads TP, Veenstra TD, Hitt BA et al (2003) Preinvasive and invasive ductal pancreatic cancer and its early detection in the mouse. Cancer Cell 4: 437–450 [DOI] [PubMed] [Google Scholar]
- 57. Soriano P (1999) Generalized lacZ expression with the ROSA26 Cre reporter strain. Nat Genet 21: 70–71 [DOI] [PubMed] [Google Scholar]
- 58. Kim D, Pertea G, Trapnell C, Pimentel H, Kelley R, Salzberg SL (2013) TopHat2: accurate alignment of transcriptomes in the presence of insertions, deletions and gene fusions. Genome Biol 14: R36 [DOI] [PMC free article] [PubMed] [Google Scholar]
- 59. Anders S, Pyl PT, Huber W (2015) HTSeq–a Python framework to work with high‐throughput sequencing data. Bioinformatics 31: 166–169 [DOI] [PMC free article] [PubMed] [Google Scholar]
- 60. Love MI, Huber W, Anders S (2014) Moderated estimation of fold change and dispersion for RNA‐seq data with DESeq2. Genome Biol 15: 550 [DOI] [PMC free article] [PubMed] [Google Scholar]
- 61. Huang da W, Sherman BT, Lempicki RA (2009) Systematic and integrative analysis of large gene lists using DAVID bioinformatics resources. Nat Protoc 4: 44–57 [DOI] [PubMed] [Google Scholar]
- 62. Huang da W, Sherman BT, Lempicki RA (2009) Bioinformatics enrichment tools: paths toward the comprehensive functional analysis of large gene lists. Nucleic Acids Res 37: 1–13 [DOI] [PMC free article] [PubMed] [Google Scholar]
- 63. Ashburner M, Ball CA, Blake JA, Botstein D, Butler H, Cherry JM, Davis AP, Dolinski K, Dwight SS, Eppig JT et al (2000) Gene ontology: tool for the unification of biology. The Gene Ontology Consortium. Nat Genet 25: 25–29 [DOI] [PMC free article] [PubMed] [Google Scholar]
- 64. Falcon S, Gentleman R (2007) Using GOstats to test gene lists for GO term association. Bioinformatics 23: 257–258 [DOI] [PubMed] [Google Scholar]
- 65. Brennecke P, Anders S, Kim JK, Kolodziejczyk AA, Zhang X, Proserpio V, Baying B, Benes V, Teichmann SA, Marioni JC et al (2013) Accounting for technical noise in single‐cell RNA‐seq experiments. Nat Methods 10: 1093–1095 [DOI] [PubMed] [Google Scholar]
- 66. Lê S, Josse J, Husson F (2008) FactoMineR: an R package for multivariate analysis. J Stat Softw 25: 1–18 [Google Scholar]
- 67. Wickham H (2009) ggplot2: elegant graphics for data analysis.
- 68. Zhang HM, Chen H, Liu W, Liu H, Gong J, Wang H, Guo AY (2012) AnimalTFDB: a comprehensive animal transcription factor database. Nucleic Acids Res 40: D144–D149 [DOI] [PMC free article] [PubMed] [Google Scholar]
Associated Data
This section collects any data citations, data availability statements, or supplementary materials included in this article.
Supplementary Materials
Expanded View Figures PDF
Table EV1
Dataset EV1
Dataset EV2
Dataset EV3
Dataset EV4
Review Process File
Data Availability Statement
The RNA‐seq data from this publication have been deposited to the Gene Expression Omnibus (GEO) and assigned the identifier GSE86225.


