

Abstract
Purpose
The high rate of injury incidence and its severity is estimated to cause approximately 9% of global mortality, while a large proportion of people surviving their injuries experience temporary or permanent disabilities. To reduce the occurrence of disability and improve general health of survivors, a more comprehensive rehabilitation approach is needed. Motor imagery is recognized as the promising cognitive strategy to counteract impaired functional capacity of the neuromuscular system. Thus, we aimed to provide to the Slovenian-speaking community a valid and reliable version of Motor Imagery Questionnaire – 3 [MIQ-3], that consists of kinaesthetic imagery [KI] and visual [i.e., Internal Imagery [IMI] and external imagery [EVI]] items.
Methods
We investigated both absolute and relative test-retest repeatability; construct validity and internal consistency of the KI, IMI and EMI items of the Slovenian version of MIQ-3 in 86 healthy adult subjects.
Results
Results showed high to very high average intra-class correlation coefficient [ICC] for the visual items [ICC=0.89] and KI items [ICC=0.92], whilst the measure of absolute variability presented as coefficient of variation [CV%] ranged from 4.9% [EVI] to 6.7% [KI]. The internal consistency was satisfactory [Cronbach α=0.91 [KI] and 0.89]) for both visual items. Confirmatory analysis confirmed a two-factorial structure of MIQ-3.
Conclusion
Understanding the content of the questionnaire is of utmost importance to ensure its effectiveness in rehabilitation practice. The Slovenian translation of the MIQ-3 is culturally and linguistically equivalent to the original English version.
Keywords: mental simulation, movement, reliability, validity, rehabilitation
Izvleček
Namen
Raziskave ocenjujejo, da visoka stopnja pojavnosti poškodb in njihova raven povzročata tudi do 9 % vzrokov za umrljivost, medtem ko se velik delež ljudi, ki preživijo poškodbe, sooča z začasno ali trajno invalidnostjo. Za zmanjšanje možnosti nastanka invalidnosti in izboljšanje splošnega zdravja poškodovancev je potreben bolj celovit pristop k procesu rehabilitacije. Gibalna predstava je prepoznana kot obetavna kognitivna strategija za preprečevanje poškodovanih oz. okrnjenih funkcionalnih zmogljivosti nevromuskularnega sistema. S tem namenom smo želeli zagotoviti veljavno in zanesljivo različico vprašalnika za merjenje gibalne predstave (angl. Motor Imagery Questionnaire – 3) v slovenskem jeziku, ki zajema kinestetično (KI) in vizualno predstavo (npr. notranje [IMI] in zunanje perspektive [EVI]).
Metode
Uporabili smo tako absolutni kot relativni test – retest ponovljivosti, opredelili veljavnost in notranjo konsistentnost postavk KI, IMI in EMI slovenske različice MIQ-3 pri 86 odraslih zdravih osebah.
Rezultati
Rezultati so pokazali visok do zelo visok povprečni korelacijski koeficient znotraj razreda (ICC) za spremenljivke vizualne predstave (ICC = 0,89) in kinestetične predstave (KI) (ICC = 0,92), medtem ko je absolutna variabilnost, predstavljena kot koeficient variacije (CV %), variirala od 4,9 % (EVI) do 6,7 % (KI). Notranja konsistentnost je bila zadovoljiva (Cronbach α = 0,91 [KI] in 0,89 za obe vizualni spremenljivki [IMI] in [EVI]). Analiza je potrdila dvofaktorsko strukturo MIQ-3.
Zaključek
Razumevanje vsebine vprašalnika je izredno pomembno za njegovo uporabo in učinkovitost v rehabilitacijski praksi. Slovenski prevod MIQ-3 je kulturno in jezikovno enakovreden izvirni angleški različici. Rezultati te študije podpirajo uporabo MIQ-3 kot zanesljivega in veljavnega instrumenta za oceno gibalne predstave tudi slovensko govoreče populacije.
Ključne besede: mentalna simulacija, gibanje, zanesljivost, veljavnost
1. Introduction
Various acute events of everyday living that has an effect on our locomotor system are common. Injuries are the fourth most common cause of death, immediately after cardiovascular disease, cancer and respiratory diseases (1, 2). On a global level, injuries are responsible for approximately 9% of mortality (2). It is estimated that for every death, there are dozens of hospitalizations, hundreds of emergency department visits, leaving a large proportion of people surviving their injuries as temporary or permanently disabled (2, 3). Since both the incidence and prevalence of injuries and other musculoskeletal conditions increase with age (4, 5, 6) the longer life expectancy that is being faced globally will result in greater proportion of people suffering from locomotor impairment. Thus, more comprehensive rehabilitation and training practice is necessary.
Currently, motor imagery [MI] that refers to mental representation of an action without any concomitant body movement (7), is a widely used cognitive strategy to enhance functional performance for both sports-based (8, 9) and therapeutic interventions (10, 11). Hence, it shows a promising indication of implementation in the rehabilitation practice of orthopaedic (12, 13) and Parkinson’s disease patients (11), following immobilization (14) or stroke rehabilitation (10, 15). The efficiency of MI practice might be examined by the functional equivalence principle (7, 16), which is based on the theory that imagery enhances performance because of the similar neurophysiological processes that underlie both imagery and actual movement (17, 18), and has found its support elsewhere (19, 20, 21). More precisely, during both motor execution and MI tasks, acute differences were shown in the supplementary motor area, the premotor cortex and the primary motor cortex during imagined or executed movement when compared to resting conditions. This suggested that imagining the motor task and its actual execution do share similar neural patterns (20). Although similar patterns of cerebral activation were seen between actual movement execution, kinaesthetic imagery [KI] and visual imagery [VI], direct comparison of KI and VI revealed some differences. VI activates predominantly the occipital regions and the superior parietal lobules, whereas KI yields more activity in motor-associated structures and the inferior parietal lobule (22). Further, Stinear et al. (2005) demonstrate that KI, but not VI, modulates corticomotor excitability, primarily at the supraspinal level [assessed by transcranial magnetic stimulation]. These results suggest that VI and KI are mediated through separate neural systems, which contribute differently during processes of motor learning and neurological rehabilitation. That said, recruitment of the brain regions associated with motor imagery is correlated with the subject’s ability to imagine the movement (18) and depends on the way it is imagined [VI or KI] (28). When using KI, the movement is imagined from a first-person perspective, e.g. as though viewing through one’s own eyes, seeing the body part move while feeling kinaesthetic sensations. In contrary, when using the VI, it is a third-person view of oneself performing the motor action [e.g., movement of any body part], as one would see itself on a video. However, both first and third-person perspectives entail KI or VI (23). Next to imagery perspective, the imagery ability may have had a significant impact upon its effectiveness, as it is likely that someone who cannot clearly imagine performing a motor task will not benefit much from MI practice (24, 25, 26). Therefore, to improve rehabilitation practice, by a more individualized approach, imagery ability of each patient should be assessed.
To date, different methodologies were used to measure MI ability that relies on neurophysiological, behavioural, psychometric and psychophysiological foundations (22, 27). However, due to low costs and time-saving benefits, self-report questionnaires represent the most suitable tool to assess MI ability of the individual. One of the most popular and commonly used questionnaires is the revised version of the Movement Imagery Questionnaire [MIQ-R], that is an appropriate instrument for the assessment of VI and KI motor imagery (28). In order to be used in rehabilitation practice, the previous version of MIQ-R was revised (29, 30), and its validity was confirmed (29, 30, 31, 32). Since both the incidence and prevalence of diseases such as cardiovascular, neuro-musculo-skeletal increase with age (5, 33) the longer life expectancy that is being faced globally will result in an increase rate of disabled individuals. Epidemiological data collected among Slovenian citizens showed that a stroke represents the second and third most common cause of mortality among females and males, respectively, while a great number of patients experienced prolonged disability (34). Further, the same report indicated that Slovenia came fifth in Europe in incidence of pain, where 40% of citizens have serious health problems associated with musculo-skeletal diseases, of which up to 30% reported chronic pain for longer than three months at a time (34). Recognized as a beneficial rehabilitation tool, it is very important for clinical as well as for research purposes to investigate whether the Slovenian translation of the MIQ-3 is a valid assessment tool of MI ability among the Slovenian population.
2. Methods
2.1. Translation Procedure
Translation of the questionnaire was executed by a Slovenian researcher with an English Language Certificate of Proficiency, after the translated version in Slovene was retranslated in English, again by a native Slovene studying and working in the United States for 30 years. It was rechecked by a native American. The final stage of the adaptation process was to test the pre-final version. Pretesting of the prefinal Slovenian version for comprehensibility on 10 randomly selected subjects revealed no further difficulties with the questionnaire, after which the questionnaire was approved by the authors to be used in the experimental setting.
2.2. Study Sample
The sample was recruited via printed advertising and consisted of various population that lives, works and/or studies in the Slovenian Primorska region. All the participants were older than 18 years of age. Participants’ age [younger vs. older than 50 yrs. of age], gender [male vs. females] and current athletic status and/or level [athlete vs. non-athlete] were assessed. For the athletes, we considered only those subjects who were actively engaged in any kind of sport on competitive level. In total 86 subjects completed the questionnaire in Time 1. The study protocol was approved by the local research and ethics committee of Orthopaedic Hospital Valdoltra [number: 16/2016]. Informed consent was obtained from each subject prior to participation.
2.3. Procedure
At first [Time 1], the questionnaire was completed by 86 subjects [mean±SD; aged 35.26±16.1 years] of which 47.7% were females. To evaluate the reproducibility (test-retest reliability) of the questionnaire, approximately one week later [±2 days, Time 2], 80 persons filled out the same questionnaire under identical conditions. The subjects were asked to continue with their common daily activities in the period between testing, to control a possible disruption on MI ability that could have occurred. Questionnaires were assessed in a calm room, in optimal climatic conditions. In order to avoid [overcome] a possible variability of understanding the instructions, researchers explained the protocol and demonstrated the movements according to the instructions.
The MIQ-3 is a questionnaire consisting of total of 12 items to assess individual’s ability to image four movements [leg raise, jump, arm abduction and adduction, standing hip flexion [bending forward]] using visual imagery [from internal [IVI] or external [EVI] perspective] and KI. Each scale comprises seven possible responses [7-point Likert scale], where the per-item score consequently ranged from 1=‘‘very hard’’ to 7=‘‘very easy’’ [questionnaire in the Appendix]. For each scale [VI and KI] and for each participant, a mean score ranging from 1 to 7 was obtained, with a higher score representing a better mental imagery ability regarding the tested modality. It takes approximately 15 minutes to administer the test.
2.4. Determining the Internal Consistency of the MIQ-3 [Slovenian Version]
The internal consistency of the questionnaire was assessed by computing the standardized Cronbach alpha coefficient. Internal consistency is generally deemed acceptable with a coefficient greater than 0.7, good at 0.8 minimum, and excellent when superior to 0.9.
2.5. Determining the Test-Retest Reliability of the MIQ-3 [Slovenian Version]
The repeatability [test-retest] of the scores on each of the scales [visual and kinaesthetic] was assessed through comparison of the scores registered for Time 1 and Time 2. The relative reliability of all dependent variables was estimated using the intra-class correlation coefficient [ICC], two-way random model [consistency type]. ICC values were considered as very high if >0.90, high if between 0.70 and 0.89, and moderate if between 0.50 and 0.69. Standard error of estimate [SEM] followed by the coefficient of variation [CV] were calculated as measures of absolute reliability, which indicates within subject variation, as previously suggested in the literature (35). To further address the reliability issues of the data a minimal detectable change [MDC] was calculated, a measure of minimal amount of change unrelated to variations of the assessment, as reported elsewhere (36).
2.6. Construct Validity of the MIQ-3 [Slovenian Version]
First, validity was tested by exploratory factor analysis, and on the basis of the obtained data and data from previous research (38), a confirmatory factor analysis [CFA] was used in order to test construct validity. For verifying the adequacy of the data with regard to expected models we used the following adjustment indexes: Comparative Fit Index [CFI], Tucker-Lewis index [TLI] [for both index values greater than .90 are usually considered satisfactory] (37), Root Mean Square Error of Approximation [RMSEA], Root Mean square Residual [RMR] and the Standardized RMR [SRMR] [for all of them values of about .05 indicate close fit of a model to data a values of about .08 indicate reasonable fit of a model (37)].
2.7. Statistical Analyses
All data are presented with a mean ± SD and 95% of confidence intervals. All statistical analysis was done with SPSS statistical software [version 20.0, IBM Inc, Chicago, USA]. Normality was confirmed by visual inspection and using the Shapiro-Wilk test, while the homogeneity of variances was tested using the Levene’s test for all dependent variables [IMI, EVI, KI]. Statistical significance was accepted at p<0.05.
3. Results
3.1. Population
Eighty-six volunteers [41 female], mean age of 35.3 years [range from 18 to 70 yrs., SD 16.1 yrs.] completed the questionnaire in Time 1, while eighty subjects [40 female], mean age of 34.8 years [range from 18 to 70 yrs., SD 15.7] completed second questionnaire one week later [Time 2].
3.2. Motor Imagery Scores: Visual and Kinaesthetic Scales According to Gender, Age, and Sport Participation
Table 1 presents the mean scores and SD for IMI, EVI and KI recorded in our population regarding the first and second tests. The overall score [n=86 subjects] at Time 1 was higher for combined visual imagery [VI-comb; 5.76±0.84] than for kinaesthetic imagery [5.30±1.26]. Slightly lower scores were observed for IMI [5.63±0.98] compared to EVI [5.89±0.85]. Considering either scale independently, there is no statistical difference between Time 1 and Time 2 [Z ranged between -1.647 and -0.222; P ranged between 0.099 and 0.824, respectively] for the 80 subjects having participated in both testing sessions. However, for both KI and IMI scales, there is a trend of a slight increase, except for EVI, which stay unchanged from Time 1 to Time 2, indicating that minor learning effects occurred.
Table 1.
Descriptive statistics for the motor imagery scores: kinaesthetic and visual [internal and external] scales at Time 1 and Time 2.
| Dimensions | n | Mean | Standard deviation |
|---|---|---|---|
| Time 1 (test) | |||
| KI | 86 | 5.30 | 1.26 |
| IVI | 86 | 5.63 | 0.98 |
| EVI | 86 | 5.89 | 0.85 |
| VI-comb | 86 | 5.76 | 0.84 |
| KI | 80 | 5.31 | 1.29 |
| IVI | 80 | 5.67 | 1.00 |
| EVI | 80 | 5.92 | 0.85 |
| VI-comb | 80 | 5.79 | 0.85 |
| Time 2 (re-test) | |||
| KI | 80 | 5.38 | 1.29 |
| IVI | 80 | 5.79 | 0.89 |
| EVI | 80 | 5.88 | 0.88 |
| VI-comb | 80 | 5.84 | 0.83 |
KI – kinaesthetic imagery; n – number of investigated subjects; IMI – internal visual imagery; EVI external visual imagery; VI-comb – combined results of both the IVI and EVI
There were no statistically significant differences observed for the mean IMI, EVI and KI scores considering all dependent variables for analysed sub-groups [i.e., younger vs. older adults; females vs. males and athletes vs. non-athletic population][Table 2].
Table 2.
Differences in imagery ability scores for kinaesthetic and visual [internal and external] scales considering participants’ characteristics such as age, gender and sport participation. Data were presented as Means ± Standard deviations [SD] for all participants assessed in Time 1 [n=86].
| Dimensions | Category | Number of subjects | Mean±SD | Z value | P value between groups |
|---|---|---|---|---|---|
| KI | Age | ||||
| younger adults | 63 | 5.36±1.27 | |||
| older adults | 23 | 5.13±1.22 | -1.137 | 0.256 | |
| Gender | |||||
| females | 41 | 5.33±1.20 | |||
| males | 45 | 5.27±1.33 | -0.252 | 0.801 | |
| Athlete or not | |||||
| athlete | 22 | 5.14±1.30 | |||
| non-athlete | 64 | 5.36±1.25 | -0.984 | 0.325 | |
| IVI | Age | ||||
| younger adults | 63 | 5.71±0.97 | |||
| older adults | 23 | 5.43 ± 0.99 | -1.130 | 0.259 | |
| Gender | |||||
| females | 41 | 5.75±0.87 | |||
| males | 45 | 5.53±1.06 | -0.862 | 0.389 | |
| Athlete or not | |||||
| athlete | 22 | 5.69±0.84 | |||
| non-athlete | 64 | 5.61±1.03 | -0.70 | 0.944 | |
| EVI | Age | ||||
| younger adults | 63 | 5.95±1.22 | |||
| older adults | 23 | 5.71±0.79 | -1.488 | 0.137 | |
| Gender | |||||
| females | 41 | 5.94±0.68 | |||
| males | 45 | 5.84±0.98 | -0.061 | 0.951 | |
| Athlete or not | |||||
| athlete | 22 | 5.90±0.80 | |||
| non-athlete | 64 | 5.89±0.87 | -0.229 | 0.819 |
KI – kinaesthetic imagery; n – number of investigated subjects; IMI – internal visual imagery; EVI external visual imagery
Table 3presents the mean scores, the SD and the minimum and maximum scores reached by the 86 subjects, taken together during Time 1.
Table 3.
Analysis of the means, standard deviations, minimum and maximum scores for each item at T1 [n=86 subjects].
| Items | Scale | Mean score | Standard deviation | Minimum score | Maximum score |
|---|---|---|---|---|---|
| 1 | KI | 5.27 | 1.47 | 1.00 | 7.00 |
| 2 | IVI | 5.42 | 1.33 | 2.00 | 7.00 |
| 3 | EVI | 6.01 | 0.93 | 3.00 | 7.00 |
| 4 | KI | 5.20 | 1.39 | 1.00 | 7.00 |
| 5 | IVI | 5.81 | 1.14 | 3.00 | 7.00 |
| 6 | EVI | 5.81 | 1.18 | 2.00 | 7.00 |
| 7 | KI | 5.42 | 1.52 | 1.00 | 7.00 |
| 8 | IVI | 5.44 | 1.28 | 1.00 | 7.00 |
| 9 | EVI | 5.88 | 0.98 | 3.00 | 7.00 |
| 10 | KI | 5.47 | 1.50 | 1.00 | 7.00 |
| 11 | IVI | 5.86 | 1.17 | 3.00 | 7.00 |
| 12 | EVI | 5.85 | 1.16 | 2.00 | 7.00 |
KI – kinaesthetic imagery; n – number of investigated subjects; IMI – internal visual imagery; EVI external visual imagery
3.3. Determining the Internal Consistency of the MIQ-3 [Slovenian Version]
The Cronbach alpha coefficient for the KI was 0.91. In addition, the same coefficients of 0.89 were found for both the IMI and EVI, suggesting that the internal consistency of the Slovenian version of the MIQ-3 may be considered excellent.
3.4. Determining the Test-Retest Reliability of the MIQ-3 [Slovenian Version]
The reliability analysis showed a high to very high average ICC [relative reliability assessment] of 0.92 for the different kinaesthetic items and 0.89 for the different visual items, whilst the measure of absolute variability CV% ranged from 4.9% [EVI] to 6.7% [KI] [Table 4].
Table 4.
Between Time 1 and Time 2 reliability analysis of the kinaesthetic and visual [internal and external] motor imagery scales.
| Variable | Time 1 | Time 2 | P ANOVA | CV (%) | MDC | SEM | ICC (95% CI) |
|---|---|---|---|---|---|---|---|
| KI | 5.31±1.29 | 5.38±1.29 | 0.420 | 6.7 | 1.04 points | 0.38 | 0.92 (0.87-0.95) |
| IVI | 5.67±1.00 | 5.79±0.89 | 0.059 | 5.9 | 0.88 points | 0.31 | 0.89 (0.82-0.93) |
| EVI | 5.92±0.85 | 5.88±0.88 | 0.508 | 4.9 | 0.79 points | 0.29 | 0.89 (0.83-0.93) |
PANOVA – P-value of repeated measures analysis of variance; CV – within subject coefficient of variation; MDC – minimal detectable change; SEM – standard error of estimate; ICC [95% CI] – intra-class correlation coefficient with 95% confidence intervals.
3.5. Construct Validity of the MIQ-3 [Slovenian Version]
The results of the exploratory factor analysis indicate that it is possible to distinguish two factors that explain 59.8% of variance [Table 5]. By their structure, these factors can be defined as Visual Imagery and Kinaesthetic Imagery. Previous studies have shown that the two-factor model does not have very good adjustment indexes, so three-factor models have been tested with a confirmatory factor analysis. The MODEL 1 is the correlated trait–correlated uniqueness model with IVI, EVI and KI as separate factors. The MODEL 2 is the correlated trait–correlated uniqueness model with external and internal visual imagery perspectives on one factor and KI on the other. The MODEL 3 is the correlated trait–correlated uniqueness model with IVI and KI on one factor and external visual imagery on the other. Results are presented in Table 6. We can see that the present study showed very comparable results to the previous one conducted among the English-speaking population (38). Best model fits were achieved with Model 1 [three-factor model with IVI, EVI and KI all as separate factors]. Fit indices were lower in some cases [for example RMSEA] but results still show a reasonable approximate fit. The graphic representation of the first two models can be seen in Figure 1.
Table 5.
Result of exploratory factor analysis for the Slovenian version of the MIQ-3.
| Component | Initial Eigenvalues | Extraction Sums of Squared Loadings | ||||
|---|---|---|---|---|---|---|
| Total | % of Variance | Cumulative % | Total | % of Variance | Cumulative % | |
| 1 | 4.656 | 38.796 | 38.796 | 4.656 | 38.796 | 38.796 |
| 2 | 2.521 | 21.006 | 59.802 | 2.521 | 21.006 | 59.802 |
| 3 | .945 | 7.878 | 67.680 | |||
| 4 | .770 | 6.418 | 74.098 | |||
| 5 | .634 | 5.281 | 79.379 | |||
| 6 | .511 | 4.257 | 83.637 | |||
| 7 | .473 | 3.943 | 87.579 | |||
| 8 | .427 | 3.562 | 91.141 | |||
| 9 | .303 | 2.526 | 93.667 | |||
| 10 | .297 | 2.478 | 96.145 | |||
| 11 | .258 | 2.151 | 98.295 | |||
| 12 | .205 | 1.705 | 100.000 | |||
Table 6.
MIQ-3 Confirmatory Factor Analysis Goodness-of-Fit Indices for the Models with a Proper Solution.
| Model | Chi2 | df | p | CFI | TLI | RMR/SRMR | RMSEA |
|---|---|---|---|---|---|---|---|
| Present Study (Slovenian population) | |||||||
| MODEL 1 (EVI vs. IVI vs. KI) MODEL 2 (EVI and IVI vs. KI) | 75.403 91.36 | 51 53 | 0.015 0.001 | 0.94 0.91 | 0.93 0.89 | 0.108 0.120 | 0.07 0.09 |
| MODEL 3 (IVI and KI vs. EVI) | 191.10 | 53 | <0.001 | 0.67 | 0.59 | 0.332 | 0.18 |
| Previous Study (38) | |||||||
| MODEL 1 (EVI vs. IVI vs. KI) | 75.12 | 39 | <0.001 | 0.98 | 0.97 | 0.04 | 0.05 |
| MODEL 2 (EVI and IVI vs. KI) | 369.13 | 41 | <0.001 | 0.82 | 0.71 | 0.11 | 0.15 |
| MODEL 3 (IVI and KI vs. EVI) | 243.66 | 41 | <0.001 | 0.88 | 0.82 | 0.07 | 0.12 |
KI – kinaesthetic imagery; IMI – internal visual imagery; EVI external visual imagery; Chi2 – chi-squared test; df – degrees of freedom; p – statistical significance of test; CFI – Comparative Fit Index; TLI – Tucker-Lewis index; RMR/SRMR – Root Mean square Residual and Standardized RMR; RMSEA – Root Mean Square Error of Approximation
Figure 1.
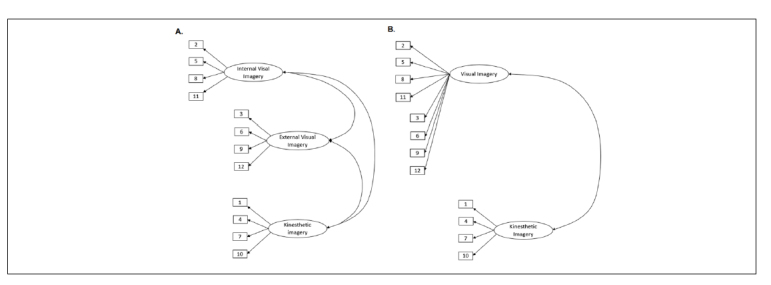
The graphic representation of two models tested by the confirmatory factor analysis: A) MODEL 1 is the correlated trait–correlated uniqueness model with IVI, EVI, and KI all as separate factors and B) MODEL 2 is the correlated trait–correlated uniqueness model with EVI and IVI perspectives as one factor and KI as another. The numbers in the rectangles represent the number of items in the questionnaire, and in the ellipses are the names of the factors. Best model fits were achieved with Model 1 [three-factor model with IVI, EVI and KI all as separate factors].
4. Discussion
The most important finding of the present study is that MIQ-3 translated to Slovenian language is effectively validated, suggesting that it can be proposed to the Slovene-speaking public. More in detail, both the absolute and relative reliability of MIQ-3 proven its high to very high repeatability, confirming that no learning effect occurred within one-week period. Further, assessing construct validity of the questionnaire, we confirmed its two-dimensional [i.e., visual and kinaesthetic] structure, similarly to previous findings of the original study assessed among the English-speaking population (38). Additionally, we are not able to detect any significant difference in imagery ability considering participants’ gender, age and status of sports engagement [i.e., athlete vs. non-athlete].
Although some studies have detected gender differences in imagery ability [e.g., based on spatio-visual characteristics assessed by mental rotation test only] (39), our findings are in accordance with studies demonstrating no significant differences between males and females in the ease of ability to imagine the movement (31, 32). Additionally, no difference was confirmed between younger and older adults, comparable to previous studies aimed to investigate the self-assessment of imaging capacity (39). While the performance-based test of imaging capacity showed a tendency towards a greater ability of younger individuals (39), which might be prescribed to well-known slower speed of cognitive processing in older subjects (40). Nonetheless, younger individuals showed a slightly greater ability to imagine a movement for all investigated scales; however, due to an overestimation of younger subjects in our sample, a robust conclusion could not be drawn. Therefore, for any additional interpretation of observed tendency, specifically designed studies aimed to address this issue are encouraged. Similarly, to gender and age comparisons, our results showed comparable abilities of both the kinaesthetic and visual scales considering the athletic status [i.e., athletes vs. non-athletes]. However, previous studies aimed to address this question, showed that the regular practice of sport evoked greater kinaesthetic ability (41), which in our sample was not the case. To successfully employ motor images, it should be critical to have well-developed motor representations (42). This means that, in order to “feel and/or see the movement like it is actually executed”, it is of great importance to actually have the necessary motor skills to be able to perform the action physically. This is well documented in elite vs. amateur athletes in high jump performance practice (43). Since MIQ-3 consists of very simple, every day movement patterns, tasks like moving the arm in front of the body, or raising the knee at hip level, and given that our study sample had no serious locomotion difficulties, we were not able to detect any differences among individuals.
In general, MI ability questionnaires are widely used among both the symptomatic and asymptomatic population. However, the difficulty to perform included motor tasks among different MI questionnaires might constrain their general usability. Therefore, consisting of three very simple and one more complex task [i.e., jump] MIQ-3 might be a useful tool to assess MI ability among various population [with and without mobility problems]. Previous studies showed that type [kinaesthetic vs. visual] and perspective [i.e., internal vs. external] of imagined tasks (44), elicit greater brain activity of motor related areas during a MI session (43). Consequently, those alterations on the cortical level lead to greater descending command of the involved muscles, improving its motor unit recruitment and activation, finally improving the muscle mechanical output following MI practice. That is, overall imagery ability may have had a significant impact upon its effectiveness. It is likely that someone who cannot clearly imagine performing a motor task will not benefit much from MI practice (24, 25). Since present findings confirmed two-dimensional characteristics of MIQ-3 imagery, from a neuro-functional stand point it has a great clinical value in planning individualized motor imagery practice. The absence of significant differences between men and women regarding imagery ability proves that planning of the MI practice should be same for both genders. The similar guidelines should be accounted regardless of age of participants, given that any significant difference for three MI scales was not observed.
4.1. Limitations of Present Study and Suggestions for Further Research
Some limitations of the present study must be outlined. One limitation might be the overestimation of the study sample regarding younger individuals vs. older ones and those who were classified as non-athlete vs. athlete, therefore the interpretation of those results should be taken with caution. Another one is that our study sample consisted of a healthy population in general and individuals up to 70 years of age only, which limit us to give general guidelines regarding MI practice. Therefore, providing the evidence of MI ability among people older than 70 years of age and those individuals with various disease-related symptoms and/or pathologies [e.g., musculo-skeletal disease, orthopaedic patients, stroke patients etc.] should be encouraged.
5. Conclusion
Understanding the content of the questionnaire is of utmost importance for the validity of its use and effectiveness in the rehabilitation practice. The Slovenian translation of the MIQ-3 is linguistically and culturally equivalent to the original English version. The results of this study support the use of the MIQ-3 as a reliable and valid motor imagery ability assessment instrument in Slovenian-speaking population. From a neuro-functional standpoint it was confirmed that two-dimensional characteristics of MIQ-3 imagery have a great clinical value in planning individualized motor imagery practice. In addition, given that non-significant differences in MI quality were observed, the same MI practice could be implemented for both genders, regardless of the age of participants.
Footnotes
Conflicts of Interest
The authors declare that no conflicts of interest exist.
Funding
The study had no financial support.
Ethical Approval
Research has been performed in accordance with the Declaration of Helsinki. The study protocol was approved by the local research and ethics committee of Orthopaedic Hospital Valdoltra (number: 16/2016).
References
- 1.WHO Preventing injuries and violence: a guide for ministries of health. 2007. pp. 1–36.http://www:whqlibdoc.who.int/publications/2007/9789241595254_eng.pdf –. Accessed November 24th, 2017 at.
- 2.WHO. 2017. http://apps.who.int/iris/bitstream/10665/44288/1/9789241599375_eng.pdf Injuries and violence the facts, 2014. Accessed November 24th.
- 3.Rok Simon M. Poškodbe v Sloveniji: zakaj so problem javnega zdravja in kaj lahko storimo? Ljubljana, 2013. Accessed November 24th. 2017. http://www.nijz.si/sl/publikacije/poskodbe-v-sloveniji-zakaj-so-problem-javnega-zdravja-in-kaj-lahko-storimo
- 4.WHO global report on falls prevention in older age. Bristol: Community Health, 2007. Accessed November 24th. 2017. http://www.who.int/ageing/publications/Falls_prevention7March.pdf
- 5.Woolf AD, Pfleger B. Burden of major musculoskeletal conditions. Bull World Health Organ. 2003;81:646. –. S0042-96862003000900007. [PMC free article] [PubMed] [Google Scholar]
- 6.Knutson K, Lewold S, Robertsson O, Lidgren L, Knutson K, Lewold S. The Swedish knee arthroplasty register : a nation-wide study of 30, 003 knees 1976-1992 The Swedish knee arthroplasty register. Acta Orthop Scand. 1994;65:375. doi: 10.3109/17453679408995475. et al. –. [DOI] [PubMed] [Google Scholar]
- 7.Jeannerod M. The representing brain: neural correlates of motor intention and imagery. Behav Brain Sci. 1994;17:187. doi: 10.1017/S0140525X00034026. –. [DOI] [Google Scholar]
- 8.Cumming J, Williams SE. The role of imagery in performance: the Oxford handbook of sport and performance psychology. Oxford: University Press; 2012. pp. 213–32. –. [Google Scholar]
- 9.Paravlic AH, Slimani M, Tod D, Marusic U, Milanovic Z, Pisot R. Effects and dose-response relationships of motor imagery practice on strength development in healthy adult populations: a systematic review and meta-analysis. Sports Med. 2018;48:1165. doi: 10.1007/s40279-018-0874-8. –. [DOI] [PubMed] [Google Scholar]
- 10.Braun S, Kleynen M, van Heel T, Kruithof N, Wade D, Beurskens A. The effects of mental practice in neurological rehabilitation: a systematic review and meta-analysis. Front Hum Neurosci. 2013;7:1. doi: 10.3389/fnhum.2013.00390. –. [DOI] [PMC free article] [PubMed] [Google Scholar]
- 11.Caligiore D, Mustile M, Spalletta G, Baldassarre G. Action observation and motor imagery for rehabilitation in Parkinson’s disease: a systematic review and an integrative hypothesis. Neurosci Biobehav Rev. 2017;72:210. doi: 10.1016/j.neubiorev.2016.11.005. –. [DOI] [PubMed] [Google Scholar]
- 12.Cupal DD, Brewer BW. Effects of relaxation and guided imagery on knee strength, reinjury anxiety, and pain following anterior cruciate ligament reconstruction. Rehabil Psychol. 2001;46:28. doi: 10.1037//0090-5550.46.I.28. –. [DOI] [Google Scholar]
- 13.Marusic U, Grosprêtre S, Paravlic A, Kovač S, Pisot R, Taube W. Neural Plast. 2018. Motor imagery during action observation of locomotor tasks improves rehabilitation outcome in older adults after total hip arthroplasty; p. 5651391. [DOI] [PMC free article] [PubMed] [Google Scholar]
- 14.Newsome J, Knight P, Balnave R. Use of mental imagery to limit strengh loss after immobilization. J Sport Rehabil. 2003;12:249. –. [Google Scholar]
- 15.Dunsky A, Dickstein R, Marcovitz E, Levy S, Deutsch J. Home-based motor imagery training for gait rehabilitation of people with chronic poststroke hemiparesis. Arch Phys Med Rehabil. 2008;89:1580. doi: 10.1016/j.apmr.2007.12.039. –. [DOI] [PubMed] [Google Scholar]
- 16.Finke RA. The functional equivalence of mental images and errors of movement. Cogn Psychol. 1979;11:235. doi: 10.1016/0010-0285(79)90011-2. –. [DOI] [PubMed] [Google Scholar]
- 17.Grezes J, Decety J. Functional anatomy of execution, mental simulation, observation, and verb generation of actions: a meta-analysis. Hum Brain Mapp. 2001;12:1. doi: 10.1002/1097-0193(200101)12:1<1::AID-HBM10>3.0.CO;2-V. –. [DOI] [PMC free article] [PubMed] [Google Scholar]
- 18.Decety J. Neural representations for action. Rev Neurosci. 1996;7:285. doi: 10.1515/revneuro.1996.7.4.285. –. [DOI] [PubMed] [Google Scholar]
- 19.Porro CA, Francescato MP, Cettolo V, Diamond ME, Baraldi P, Zuiani C. Primary motor and sensory cortex activation during motor performance and motor imagery: a functional magnetic resonance imaging study. J Neurosci. 1996;16:7688. doi: 10.1523/JNEUROSCI.16-23-07688.1996. et al. –. [DOI] [PMC free article] [PubMed] [Google Scholar]
- 20.Lotze M, Montoya P, Erb M, Hülsmann E, Flor H, Klose U. Activation of cortical and cerebellar motor areas during executed and imagined hand movements: an fMRI study. J Cogn Neurosci. 1999;11:491. doi: 10.1162/089892999563553. et al. –. [DOI] [PubMed] [Google Scholar]
- 21.Jeannerod M. Neural aimulation of action: a unifying mechanism for motor cognition. Neuroimage. 2001;14:S103. doi: 10.1006/nimg.2001.0832. –. [DOI] [PubMed] [Google Scholar]
- 22.Guillot A, Collet C, Nguyen VA, Malouin F, Richards C, Doyon J. Brain activity during visual versus kinesthetic imagery: an fMRI study. Hum Brain Mapp. 2009;30:2157. doi: 10.1002/hbm.20658. –. [DOI] [PMC free article] [PubMed] [Google Scholar]
- 23.Ridderinkhof KR, Brass M. How kinesthetic motor imagery works: a predictive-processing theory of visualization in sports and motor expertise. J Physiol Paris. 2015;109:53. doi: 10.1016/j.jphysparis.2015.02.003. –. [DOI] [PubMed] [Google Scholar]
- 24.Moran A. Conceptual and methodological issues in the measurement of mental imagery skills in athletes. J Sport Behav. 1993;16:156. –. [Google Scholar]
- 25.Martin KA, Moritz SE, Hall CR. Imagery use in sport: aliterature review and applied model. Sport Psychol. 1999;13:245. –. [Google Scholar]
- 26.Goss S, Hall C, Buckolz E, Fishburne G. Imagery ability and the acquisition and retention of movements. Mem Cognit. 1986;14:469. doi: 10.3758/BF03202518. –. [DOI] [PubMed] [Google Scholar]
- 27.Collet C, Guillot A, Lebon F, MacIntyre T, Moran A. Measuring motor imagery using psychometric, behavioral, and psychophysiological tools. Exerc Sport Sci Rev. 2011;39:85. doi: 10.1097/JES.0b013e31820ac5e0. –. [DOI] [PubMed] [Google Scholar]
- 28.Hall CR, Martin KA. Measuring movement imagery abilities: a revision of the movement imagery questionnaire. J Ment Imag. 1997;21:143. –. [Google Scholar]
- 29.Gregg M, Hall C, Butler A. The MIQ-RS: a suitable option for examining movement imagery ability. Evidence-based Complement Altern Med. 2010;(7):249. doi: 10.1093/ecam/nem170. –. [DOI] [PMC free article] [PubMed] [Google Scholar]
- 30.Tabrizi YM, Zangiabadi N, Mazhari S, Zolala F. The reliability and validity study of the kinesthetic and visual imagery questionnaire in individuals with multiple sclerosis. Braz J Phys Ther. 2013;17:588. doi: 10.1590/S1413-35552012005000124. –. [DOI] [PMC free article] [PubMed] [Google Scholar]
- 31.Monsma E V, Hall CR, Gregg M, Sullivan P, Monsma E V, Short SE. Psychometric properties of the revised movement imagery questionnaire (MIQ-R) J Imag Res Sport Phys Act. 2009;4(1) doi: 10.2202/1932-0191.1027. et al. [DOI] [Google Scholar]
- 32.Loison B, Moussaddaq AS, Cormier J, Richard I, Ferrapie AL, Ramond A. Translation and validation of the french movement imagery questionnaire - revised second version (MIQ-RS) Ann Phys Rehabil Med. 2013;56:157. doi: 10.1016/j.rehab.2013.01.001. et al. –. [DOI] [PubMed] [Google Scholar]
- 33.Srikanth VK, Fryer JL, Zhai G, Winzenberg TM, Hosmer D, Jones G. A meta-analysis of sex differences prevalence, incidence and severity of osteoarthritis. Osteoarthr Cartil. 2005;13:769. doi: 10.1016/j.joca.2005.04.014. –. [DOI] [PubMed] [Google Scholar]
- 34.Artnik B, Bajt M, Bilban M, Borovničar A, Hitij JB, Djomba JK. Zdravje in vedenjski slog prebivalcev Slovenije: trendi v raziskavah CINDI 2001-2004-2008. Ljubljana: Inštitut za varovanje zdraja Republike Slovenije; 2012. et al. [Google Scholar]
- 35.Hopkins WG. Measures of reliability in sports medicine and science. Sports Med. 2000;30:1. doi: 10.2165/00007256-200030050-00006. –. [DOI] [PubMed] [Google Scholar]
- 36.Donath L, Wolf P. Reliability of force application to instrumented climbing holds in elite climbers. J Appl Biomech. 2015;31:377. doi: 10.1123/jab.2015-0019. –. [DOI] [PubMed] [Google Scholar]
- 37.Hooper D, Coughlan J, Mullen MR. Structural equation modelling: guidelines for determining model fit. Electron J Bus Res Methods. 2008;6:53. doi: 10.1037/1082-989X.12.1.58. –. [DOI] [Google Scholar]
- 38.Williams SE, Cumming J, Ntoumanis N, Nordin-Bates SM, Ramsey R, Hall C. Further validation and development of the movement imagery questionnaire. J Sport Exerc Psychol. 2012;34:621. doi: 10.1123/jsep.34.5.621. –. [DOI] [PubMed] [Google Scholar]
- 39.Campos A, Pérez-Fabello MJ, Gómez-Juncal R. Gender and age differences in measured and self-perceived imaging capacity. Pers Individ Dif. 2004;37:1383. doi: 10.1016/j.paid.2004.01.008. –. [DOI] [Google Scholar]
- 40.Bashore TR, Ridderinkhof KR, van der Molen M. The decline of cognitive processing speed in old age. Curr Dir Psychol Sci. 1997;6:163. –. [Google Scholar]
- 41.Lorant J, Nicolas A. Validation de la traduction Française du movement imagery questionnaire-revised (MIQ-R) Sci Mot. 2004;53:57. doi: 10.3917/sm.053.0057. –. [DOI] [Google Scholar]
- 42.Jeannerod M. Mental imagery in the motor context. Neuropsychol. 1995;33:1419. doi: 10.1016/0028-3932(95)00073-C. –. [DOI] [PubMed] [Google Scholar]
- 43.Olsson C-J, Jonsson B, Larsson A, Nyberg L. Motor representations and practice affect brain systems underlying imagery: an FMRI study of internal imagery in novices and active high jumpers. Open Neuroimag J. 2008;2:5. doi: 10.2174/1874440000802010005. –. [DOI] [PMC free article] [PubMed] [Google Scholar]
- 44.Yao WX, Ranganathan VK, Allexandre D, Siemionow V, Yue GH. Kinesthetic imagery training of forceful muscle contractions increases brain signal and muscle strength. Front Hum Neurosci. 2013;7:561. doi: 10.3389/fnhum.2013.00561. [DOI] [PMC free article] [PubMed] [Google Scholar]