Abstract
Background
The aim of the study is described the regulatory mechanisms and prognostic values of differentially expressed RNAs in prostate cancer and construct an mRNA signature that predicts survival.
Methods
The RNA profiles of 499 prostate cancer tissues and 52 non-prostate cancer tissues from TCGA were analyzed. The differential expression of RNAs was examined using the edgeR package. Survival was analyzed by Kaplan–Meier method. microRNA (miRNA), messenger RNA (mRNA), and long non-coding RNA (lncRNA) networks from the miRcode database were constructed, based on the differentially expressed RNAs between non-prostate and prostate cancer tissues.
Results
A total of 773 lncRNAs, 1417 mRNAs, and 58 miRNAs were differentially expressed between non-prostate and prostate cancer samples. The newly constructed ceRNA network comprised 63 prostate cancer-specific lncRNAs, 13 miRNAs, and 18 mRNAs. Three of 63 differentially expressed lncRNAs and 1 of 18 differentially expressed mRNAs were significantly associated with overall survival in prostate cancer (P value < 0.05). After the univariate and multivariate Cox regression analyses, 4 mRNAs (HOXB5, GPC2, PGA5, and AMBN) were screened and used to establish a predictive model for the overall survival of patients. Our ROC curve analysis revealed that the 4-mRNA signature performed well.
Conclusion
These ceRNAs may play a critical role in the progression and metastasis of prostate cancer and are thus candidate therapeutic targets and potential prognostic biomarkers. A novel model that incorporated these candidates was established and might provide more powerful prognostic information in predicting survival in prostate cancer.
Keywords: Competing endogenous RNAs, Prostate cancer, 4-mRNA signature, Survival
Background
In men, prostate cancer remains the second leading cause of deaths due to cancer in the US [1]. Approximately 26,000 men were expected to die from prostate cancer in 2016 [2]. Siegel et al. [2] also estimated that many patients with advanced prostate cancer will develop castration-resistant prostate cancer (CRPC). Previous studies [3–6] have reported that there are several treatment options for CRPC, including chemotherapy, androgen receptor-targeted agents, and radiopharmaceuticals. Nevertheless, there are currently no effective biomarkers for the early diagnosis and treatment of prostate cancer.
Morphological, immunological, and molecular features have been used to predict the progression and prognosis of prostate cancers [7, 8]. Over the past several decades, urologists have devoted much effort toward identifying prostate cancer-related protein-coding genes [9]. However, only approximately 2% of all transcripts in mammals are protein-coding RNAs [10]. Thus, the functions of non-coding RNAs should be examined [11]. Previous studies [12–16] proposed a competing endogenous RNA (ceRNA) hypothesis, which described an intricate post-transcriptional regulatory network in which mRNAs, lncRNAs, and other RNAs act as natural miRNA sponges to weaken the function of miRNA via sharing one or more miRNA response elements.
In this study, a ceRNA network was constructed to identify the ceRNAs that are involved in prostate cancer using data from the TCGA database. The RNA profiles of 499 prostate cancer tissues and 52 non-prostate cancer tissues were analyzed. Finally, a prostate cancer-associated ceRNA network was established, based on our bioinformatics prediction and correlation analysis, consisting of 63 lncRNAs, 13 miRNAs, and 18 mRNAs. We examined the functions of the differentially expressed miRNAs that we identified and developed a novel model using several candidates to predict survival in prostate cancer patients. This study aimed to identify prostate cancer-specific RNAs as ceRNAs that regulate target genes and are involved in the pathogenesis and prognosis of prostate cancer.
Methods
Data collection
RNA profiles of prostate cancer and control samples were downloaded from the genomic data commons (GDC) data portal and the cancer genome atlas (TCGA, https://tcga-data.nci.nih.gov/tcga/) database. A total of 551 samples were collected, comprising 499 primary prostate cancer samples and 52 normal solid tissue samples.
Differential gene expression analysis
mRNA, lncRNA, and miRNA expression in the prostate cancer samples were analyzed using the RNASeqV2 and Illumina HiSeq 2000 miRNA sequencing platforms. Samples were divided into prostate cancer tissues versus adjacent non-tumor tissues to identify differentially expressed RNAs using edgeR. Differences in the expression of each RNA between prostate cancer and adjacent non-tumor tissue were expressed as fold-change and the associated P value. Downregulated and upregulated RNAs were defined as those that decreased and increased by a fold-change of > 1.5, respectively, with an FDR-adjusted P of < 0.05.
Construction of the ceRNA network
The regulatory network was constructed using data on the mRNAs, lncRNAs, and miRNAs. First, prostate cancer-specific RNAs, including mRNAs, lncRNAs, and miRNAs, were filtered. Downregulated and upregulated RNAs were assigned fold-changes > 1.5 with FDR-adjusted P < 0.05. Then, the mRNAs that were targeted by miRNAs were predicted using Targetscan (http://www.targetscan.org/), miRTarBase (http://mirtarbase.mbc.nctu.edu.tw/), and miRDB (http://www.mirdb.org/). Next, miRanda Tools (http://www.microrna.org/microrna/home.do) was used to predict the interactions between lncRNAs and miRNAs. Finally, miRNAs that regulated the expression of both lncRNAs and mRNAs were selected for construction of the ceRNA network using Cytoscape v.3.8.5.
Survival analysis and definition of mRNA-related prognostic model
The association between differentially expressed mRNAs and overall survival was evaluated by univariate Cox proportional hazards regression analysis using the R survival package. Only mRNAs with P < 0.01 were considered to be candidates and selected for multivariate Cox regression analysis. The best explanatory and most informative predictive model was identified using Akaike Information Criterion (AIC), which assesses the goodness of fit of a statistical model.
Gene ontology and pathway analysis
To understand the underlying biological processes and pathways between differentially expressed genes in the ceRNA network, the database for annotation, visualization, and integrated discovery (DAVID) (http://david.abcc.ncifcrf.gov/) was used to perform functional enrichment analysis. Then, significantly differentially expressed mRNAs were analyzed in the gene ontology (GO) database (http://www.geneontology.org). Finally, significantly enriched GO terms were selected to analyze their biological function. The kyoto encyclopedia of genes and genomes (KEGG; http://www.kegg.jp/) was used to perform the pathway enrichment analysis.
Survival analysis of key members in the ceRNA network
The clinical data on the patients were combined with prostate cancer data in TCGA to evaluate the prognostic value of differential RNAs in the ceRNA network. Survival curves were generated using the survival package in R for samples with differentially expressed mRNAs, lncRNAs, and miRNAs. Survival was analyzed by Kaplan–Meier method, and P values < 0.05 were considered to be significant.
Results
Identification of significantly differentially expressed lncRNAs
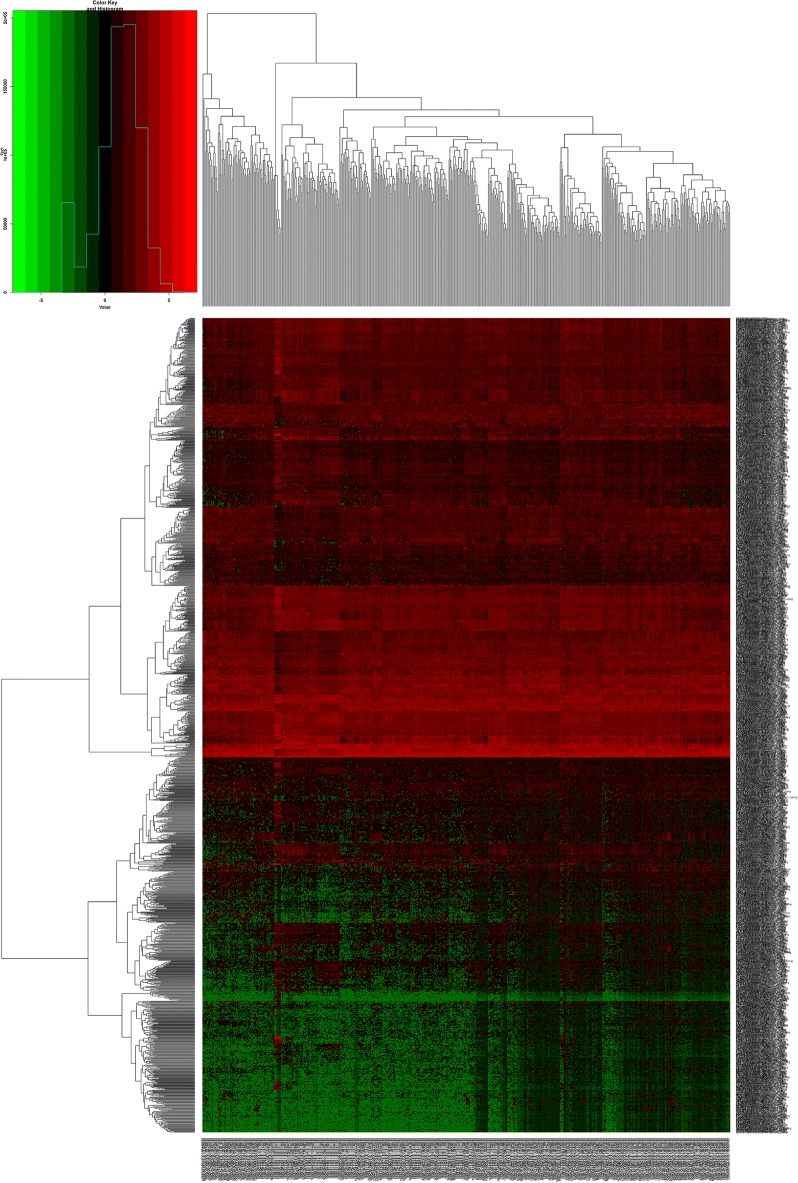
In this study, 551 samples were obtained from the TCGA database. Differential expression was analyzed by comparing the expression of 14,254 lncRNAs in prostate cancer and adjacent normal prostate tissues in the TCGA database. Fold-change > 1.5 and P value < 0.05 were set as cutoffs to identify significantly differentially expressed lncRNAs. As a result, 773 differentially expressed lncRNAs between prostate cancer and adjacent normal prostate tissue were obtained—of which 414 were upregulated and 359 were downregulated (Fig. 1; Table 1).
Fig. 1.
Heat maps of differentially expressed messenger RNAs (mRNAs) in prostate cancer
Table 1.
Top differential mRNAs for prostate cancer
| logFC | logCPM | P value | FDR | |
|---|---|---|---|---|
| SERPINA5 | − 6.78954 | 4.392568 | 0 | 0 |
| MFSD2A | − 5.97025 | 3.451485 | 0 | 0 |
| ACSL6 | − 4.99597 | 2.404013 | 1.15E−299 | 6.83E−296 |
| MCF2 | − 5.26855 | 0.926199 | 5.45E−264 | 2.43E−260 |
| EMX2 | − 6.79059 | 2.24242 | 3.15E−261 | 1.12E−257 |
| HOXB8 | − 6.24965 | 1.044248 | 8.97E−252 | 2.67E−248 |
| CLDN2 | − 7.91887 | 3.217525 | 1.31E−248 | 3.34E−245 |
| AKR1B1 | − 3.87736 | 5.710326 | 1.39E−239 | 3.11E−236 |
| SPINK2 | − 7.41992 | 2.675429 | 9.55E−238 | 1.89E−234 |
| CYP19A1 | − 5.40444 | − 1.22883 | 8.73E−236 | 1.56E−232 |
Identification of significantly differentially expressed mRNAs and miRNAs
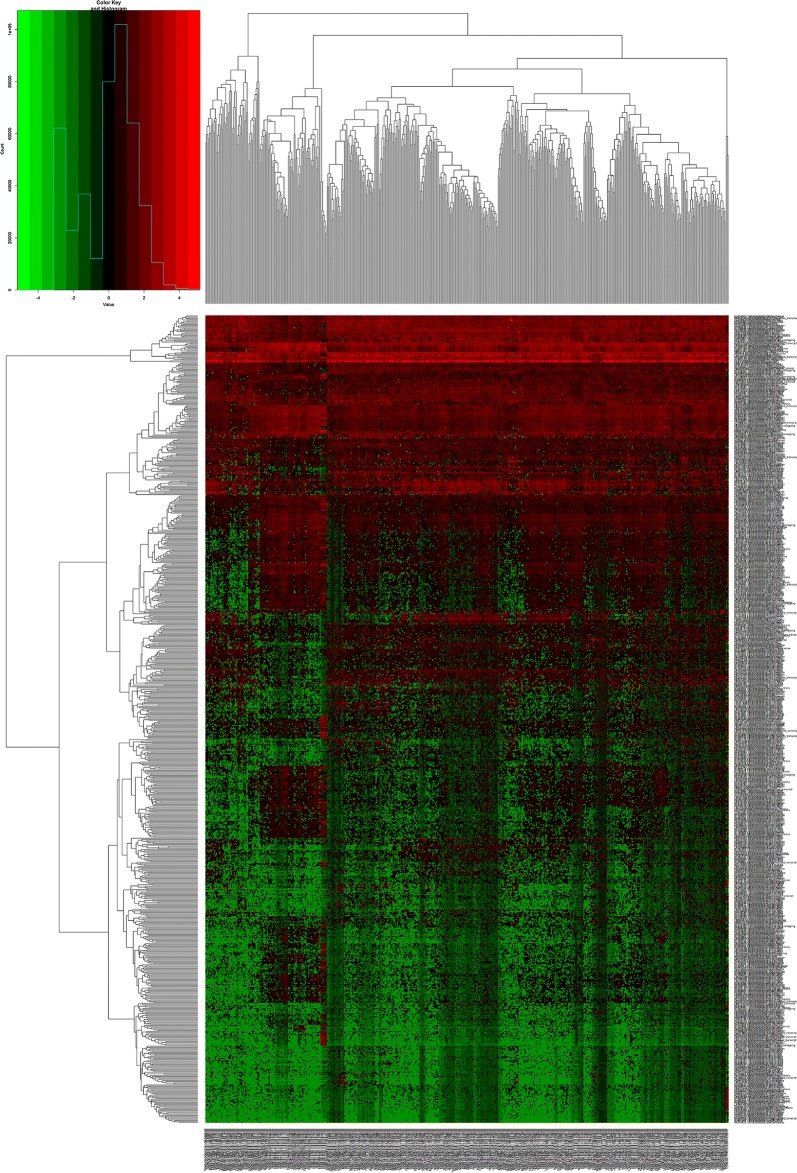
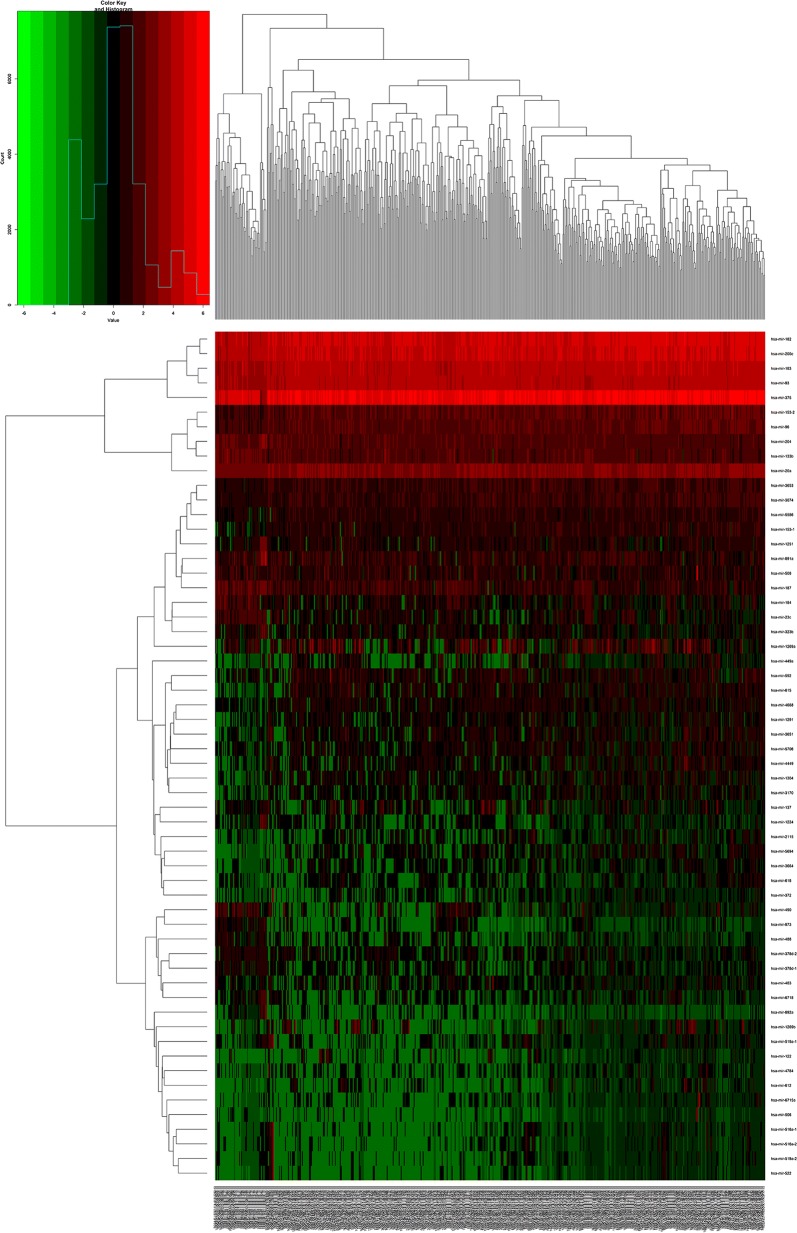
A total of 19,660 mRNAs and 1881 miRNAs were identified from the TCGA database. Using fold-change > 1.5 and P value < 0.05 as cutoffs, we identified 1417 differentially expressed mRNAs (744 downregulated and 673 upregulated) (Fig. 2; Table 2) and 58 differentially expressed miRNAs (16 downregulated and 42 upregulated) (Fig. 3; Table 3).
Fig. 2.
Heat maps of differential long non-coding RNAs (lncRNAs) in prostate cancer
Table 2.
Top differential lncRNAs for prostate cancer
| lncRNAs | logFC | logCPM | P value | FDR |
|---|---|---|---|---|
| EMX2OS | − 5.98142 | 9.023393 | 3.19E−214 | 2.45E−210 |
| LINC02137 | − 5.28623 | 4.228184 | 3.37E−164 | 1.30E−160 |
| LINC01116 | − 3.59594 | 6.425597 | 3.66E−153 | 9.36E−150 |
| LINC00839 | − 4.30616 | 5.907386 | 1.92E−152 | 3.69E−149 |
| AL161645.1 | − 4.9543 | 4.277951 | 3.17E−152 | 4.87E−149 |
| AC012123.1 | − 4.63826 | 4.053666 | 7.30E−150 | 9.35E−147 |
| AL354793.1 | − 5.45876 | 3.374845 | 3.31E−139 | 3.63E−136 |
| LINC02385 | − 5.3465 | 3.172287 | 5.10E−119 | 4.90E−116 |
| HOXB-AS3 | − 5.22943 | 5.154366 | 1.02E−109 | 8.72E−107 |
| AC005674.1 | − 3.98991 | 3.53896 | 1.86E−99 | 1.43E−96 |
Fig. 3.
Heat maps of differential micro RNAs (miRNAs) in prostate cancer
Table 3.
Top differential miRNAs for prostate cancer
| miRNAs | logFC | logCPM | P value | FDR |
|---|---|---|---|---|
| hsa-mir-891a | − 4.85431879 | 4.002176579 | 1.55E−175 | 7.68E−173 |
| hsa-mir-892a | − 5.149514076 | − 0.257215178 | 3.34E−87 | 8.31E−85 |
| hsa-mir-1224 | − 3.661141606 | 0.125808001 | 1.07E−55 | 1.78E−53 |
| hsa-mir-93 | 1.797800506 | 11.66361471 | 2.95E−55 | 3.67E−53 |
| hsa-mir-23c | − 2.963769032 | 1.270390008 | 8.13E−53 | 7.72E−51 |
| hsa-mir-1251 | − 2.763816112 | 1.733525651 | 9.33E−53 | 7.72E−51 |
| hsa-mir-204 | − 1.84293445 | 4.58407729 | 1.85E−50 | 1.31E−48 |
| hsa-mir-323b | − 2.318579119 | 0.539567334 | 8.77E−42 | 4.36E−40 |
| hsa-mir-200c | 1.584566628 | 13.50446843 | 2.04E−40 | 9.21E−39 |
| hsa-mir-96 | 1.987872725 | 4.714552069 | 2.35E−39 | 9.75E−38 |
Predictions of mRNAs and lncRNAs targeted by miRNAs
Next, we predicted the mRNAs and lncRNAs that were targeted by miRNAs, focusing on the relationship between the 58 differentially expressed miRNAs and 773 differentially expressed lncRNAs above. Only 13 of 58 differentially expressed miRNAs were predicted to target 63 of 773 differentially expressed lncRNAs.
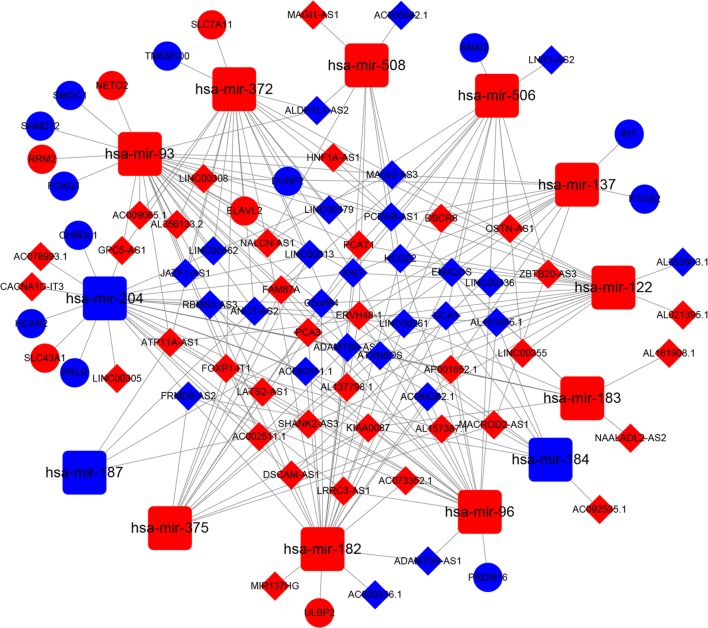
The relationships between these 13 differentially expressed lncRNA-targeting miRNAs were used to predict the targeted mRNAs using Targetscan, miRTarBase, and miRDB. Then, 13 prostate cancer-specific miRNAs were predicted to target the 644 mRNAs. After 644 mRNAs were found, the intersection of 644 mRNAs and 19,660 differentially expressed mRNAs between prostate cancer and adjacent normal prostate tissue were performed. Finally, 18 mRNAs were obtained from the 644 mRNAs. Overall, 63 lncRNAs, 13 miRNAs, and 18 mRNAs were selected to construct the lncRNA-miRNA-mRNA ceRNA network using Cytoscape 3.8.5 (Fig. 4; Tables 4 and 5).
Fig. 4.
CeRNA network in prostate cancer. The blue nodes represent decreased expression, and the red nodes represent increased expression. Rectangles represent miRNAs, ellipses represent protein-coding genes, and diamonds represent lncRNAs; gray edges indicate lncRNA-miRNA-mRNA interactions
Table 4.
Representative interactions between lncRNAs and miRNAs for prostate cancer
| lncRNA | miRNA |
|---|---|
| KIAA0087 | hsa-mir-96, hsa-mir-182, hsa-mir-183, hsa-mir-204, hsa-mir-375 |
| SHANK2-AS3 | hsa-mir-96, hsa-mir-187, hsa-mir-204, hsa-mir-122 |
| FAM87A | hsa-mir-96, hsa-mir-93, hsa-mir-506, hsa-mir-375 |
| LINC00313 | hsa-mir-93, hsa-mir-372, hsa-mir-187, hsa-mir-204, hsa-mir-122, hsa-mir-375 |
| AC092811.1 | hsa-mir-96, hsa-mir-182, hsa-mir-204, hsa-mir-93, hsa-mir-204 |
| UCA1 | hsa-mir-96, hsa-mir-182, hsa-mir-184, hsa-mir-122, hsa-mir-506 |
| AP001652.1 | hsa-mir-96, hsa-mir-137, hsa-mir-182, hsa-mir-183, hsa-mir-204 |
| ATP11A-AS1 | hsa-mir-93, hsa-mir-372, hsa-mir-96, hsa-mir-187, hsa-mir-122 |
| NALCN-AS1 | hsa-mir-93, hsa-mir-372, hsa-mir-182, hsa-mir-508, hsa-mir-506 |
| ERVH48-1 | hsa-mir-96, hsa-mir-137, hsa-mir-182, hsa-mir-184, hsa-mir-187, hsa-mir-508 |
| MAGI2-AS3 | hsa-mir-93, hsa-mir-372, hsa-mir-137, hsa-mir-204, hsa-mir-508, hsa-mir-122 |
| PCAT1 | hsa-mir-93, hsa-mir-372, hsa-mir-182, hsa-mir-122, hsa-mir-506, hsa-mir-375 |
| FRMD6-AS2 | hsa-mir-96, hsa-mir-182, hsa-mir-184, hsa-mir-204, hsa-mir-375 |
| LINC00261 | hsa-mir-182, hsa-mir-183, hsa-mir-204, hsa-mir-508, hsa-mir-506, hsa-mir-375 |
Table 5.
Representative interactions between miRNAs and mRNAs for prostate cancer
| miRNA | mRNA |
|---|---|
| hsa-mir-122-5p | HECW2, DUSP2, ORC2, CLIC4, SLC7A1, BROX, SLC52A2, PKM, NFX1, ANKRD13C, PRKRA, GNPDA2, GYS1, CCNG1, PIP4K2A, RBL1, RBM43, CCDC43, TNRC6A, ALDOA, FAM117B, G6PC3, NPEPPS, TGFBRAP1, HECTD3, SLC9A1, AKT3, PHF14, GALNT3, NT5C3A, P4HA1, FUNDC2 |
| hsa-mir-137 | CTBP1, MITF, HNRNPDL, SLC1A5, EOGT, PTGS2, NCOA3, GLO1, YTHDF3, GLIPR1, FMNL2, RREB1, SNRK, E2F6, KIT, DR1, YBX1, GIGYF1, SFT2D3, RORA, AGO4, NCOA2, CSE1L, LIMCH1, PXN, PAPD7, KDM1A, ESRRA, ZNF326 |
| hsa-mir-182-5p | FLOT1, SESN2, BDNF, PLEKHA8, MTSS1, CITED2, CLOCK, MITF, NR3C1, TCEAL7, FBXW7, THBS1, EVI5, FGF9, FOXO3, KDM5A, CHL1, NPTX1, ADCY6, ULBP2, HOXA9, LSM14A, NUFIP2, PRKAA2, RARG, BRWD1, CYLD, TP53INP1, FOXF2, RECK |
| hsa-mir-183-5p | GLUL, ARHGAP21, FOXN2, LRP6, SRSF2, KIF2A, RCN2, TMED7, NR3C1, FOXO1, SH3D19, PPP2CB, KLHL24, EZR, RALGDS, SUCO, AKAP12, FAM217B, ZEB1, CTDSPL, KLRD1, ARFGAP2, KIF5C, CCNB1, NUFIP2, DAP, ITGB1, KLHL23, PDCD4, FAM175B, CELF1, IDH2, GNG5, PRRC1, PDCD6 |
| hsa-mir-184 | LRRC8A |
| hsa-mir-187-3p | DYRK2 |
| hsa-mir-204-5p | ZFHX3, CREB5, CCNT2, RAB22A, CAPRIN1, M6PR, USP47, TGFBR2, ARAP2, AKAP1, MAPRE2, HAS2, HNRNPA2B1, JARID2, KLHL40, ANGPTL2, PHF13, SH3PXD2A, SAMD5, AP1S2, HOXC8, MAP1LC3B, SP1, RAB40B, RUNX2, FOXC1, COL5A3, MBNL1, SIRT1, CHRDL1, PPP3R1, IKZF2, FARP1, SGPL1, ARHGAP29, PRLR, ZCCHC24, PRDM2, AP1S1, TPPP, ANKFY1, CDH2, ITPR1, SERINC3, SLC43A1, RAB10, WWC3, ANKRD13A, EDEM1, ZBTB22, NPTX1, SLC22A6, ALPL, SYNJ2BP, TMTC2, NTRK2, BCL2, PTPRT, THRB, ELOVL6, SPOP, TCF12, EZR, CHORDC1, HCAR2, IL11, SLC39A9, BIRC2 |
| hsa-mir-372-3p | ZNF532, WEE1, LATS2, SLC22A23, DUSP2, RAB11FIP1, TMEM100, FAM102B, SLAIN2, NR2C2, FEM1C, KLF3, MED17, DPP8, HABP4, MBNL2, ARID4B, PLA2G12A, ATAD2, PFKP, ULK1, CLIP4, TGFBR2, MKNK2, CUL3, ZNF385A, UNK, SERF1B, YOD1, TFAP4, SAR1B, PSD3, CADM2, DAZAP2, ZFYVE26, SIK1, IGF1R, TAOK1, IRF2, MIXL1, SBNO1, SUZ12, TXNIP, SUCO, ELAVL2, INO80D, GALNT3, LEFTY1, BTG1, MPP5, TMEM19, ELK4, HIP1, CREBRF, REST, TIMM17A, FOXJ2, OSTM1, MINK1, RHOC, RAB22A, IRAK4, LIMA1, HMBOX1, SH3GLB1, GNB5, SLC7A11, CCSAP, TNKS2, TRPS1, PAK2, KREMEN1, PTPDC1, NFIB, SERF1A, FBXL7, CPT1A, TNFAIP1, KPNA2 |
| hsa-mir-375 | ELAVL4, RLF |
| hsa-mir-506-3p | CD151, PI4K2B, NUFIP2, TMEM41A, SLC16A1, PARP16, PRR14L, CHSY1, SFT2D3, PTBP3, LRRC1, NEK9, GXYLT1, SNX18, AMOTL1, VIM, MYO10, SCAMP4, PTBP1, ZWINT, CREBRF, LRRC58, SNAI2 |
| hsa-mir-93-5p | MKNK2, KLF3, CDKN1A, GID4, SCAMP2, MAP3K2, BRMS1L, EPS15L1, SAMD12, ZNF800, PANK3, HEG1, CEP97, PPP3R1, TMEM167A, ZNF280B, ORMDL3, ZBTB18, CAPRIN2, RB1, PAFAH1B1, FBXO21, DNAJC27, FCHO2, CCDC71L, PRRG1, KLHL20, PARD6B, HAUS8, MASTL, FNBP1L, NIPA1, NRIP3, CENPQ, BMP8B, SERF1B, POLQ, RCCD1, NETO2, JAK1, NR2C2, RBBP7, PURA, MTF1, DDHD1, NKIRAS1, TET3, FRS2, MED12L, PTPN4, ADARB1, NAGK, SMAD5, AGO1, PTGFRN, HSPA8, FBXO48, PIP4K2A, TMEM64, FJX1, SOWAHC, ANKH, RRAGD, PGP, CAMTA1, DUSP2, ZBTB9, FAM57A, ZADH2, KLHL28, C9orf40, ARHGAP12, SQSTM1, RABEP1, REST, RUNX3, ARHGAP1, SLAIN2, SGTB, BTBD7, SERF1A, F3, STK17B, SFXN5, RAP2C, ZBTB41, ITCH, SEMA4B, KATNAL1, UBE2Q2, RAB10, SALL3, TMEM242, CYBRD1, RAB11FIP1, LYSMD3, TRIP10, GINS4, FAM210A, SEMA7A, STX6, KAT2B, DAB2, STAT3, ENPP5, KLF10, PPP6C, PFKP, OSTM1, RBM12B, IKZF4, DENND5B, FAM102A, CEP170, KIAA0513, TBC1D20, CEP57, CNOT6L, SACS, ZBTB4, ABHD2, POLR3G, ZFP91, FBXO31, KPNA2, FIGNL1, C3orf38, E2F5, TMEM168, RAB22A, KIAA1191, ITGB8, CRK, ZNFX1, CNOT4, GBF1, PLXNA1, TNFAIP1, MAPRE3, SHOC2, HIP1, PIP4K2C, ASF1A, LASP1, EZH1, NABP1, ANKRD33B, HBP1, BMPR2, ZNF107, USP3, RRM2, MFN2, TFAM, HMGB3, LIMA1, RHOC, EPHA4, PLEKHO2, SMOC1, RPS6KA5, ZFYVE9, UXS1, EIF5A2, OXR1, UNKL, KMT2B, FYCO1, MAP3K3, PRR14L, FOXJ2, CNOT7, TANC1, PGM2L1, VPS26A, MCL1, RAPGEF4, KIAA0922, GNB5, VPS13C, EGR2, GPATCH2, ARHGAP35, FAXC, KLF9, EPHA7, SYBU, REEP3, ATL3, CLOCK, ANKRD13C, CAPN15, SOX4, SKIL, NPAT, ATAD2, U2SURP, SESN3, RPF2, FAM126B, FAM46C, KIF23, AKTIP, MIDN, TMEM123, ATG16L1, TOPORS, EGLN3, RAB5B, ABCA1, FOXQ1, NRBP1, TGFBR2, TNKS1BP1, PITPNA, GOLGA1, MORF4L1, SCAMP5, SERTAD2, HAS2, SPOPL, ELK4, RGMB, TMEM127, RNF145, NIN, TNKS2, SLC2A4, CHAF1A, CASP2, TMEM138, WDR37, FAM117B, USP32, CERCAM, WAC, TOLLIP, CFL2, SPRED1, ARAP2, DNM1L, TXLNA, RPA2, MTMR3, SGMS1, TWF1, TP53INP1, C7orf43, CDC37L1, TXNIP, E2F1, GPR137C, TRIM37, YOD1, CSNK1G1, PPP6R3, GNS, FRMD6, PHF6, ZNF202, PLS1, BICD2, CCSER2, CMPK1, SRSF2, CIT, CRY2, SNX16, HIF1A, EIF4H, RUNDC1, C14orf28, LPGAT1, CCND1, 2-Sep, PXK, RORA, NDEL1, VLDLR, LYST, TNFRSF21, UNK, ANKIB1, CREB1, STK11, ATG14, SLC16A9, MLXIP, SIKE1, FOXJ3, GOLGA2, PPP1R3B, ZFYVE26, MYO19, IRF1, BTG3, KIAA1147, BNIP2, FEM1C, PKD2, ZNF217, MINK1, PHTF2, GIGYF1, ZNF148, ANKRD50, IRAK4, ARID4B, SLK, ERAP1, NFAT5, ANKRD12, ULK1, ZC3H12C, PPP1R15B, FBXL5, PAPOLA, TMEM245, CCNG2, DNAJB9, RLIM, DPYSL2, TADA2B, ANKRD52, PTPDC1, KLF11, PDZD11, SASH1, CHIC1, ANKRD29, IFNAR1, EFCAB14, CHD9, OCRL, OSR1, NUP35, ACSL4, RUFY2, ZNF532, MAPK1, SSX2IP, HMBOX1, DDX5, UBXN2A, PKNOX1, NCOA3, LDLR, SNTB2, GAB1, USP28, UBE2J1, DUSP8, MCC, BTBD10, FAM129A, E2F2, ELAVL2, PDE3B, SLC29A2, GPAM, MAPK9, TUSC2, SH3PXD2A, SSH2, NACC2, APBB2, ZBTB7A, CLIP4, TMBIM6, NHLRC3, MFSD8, PTP4A1, SIK1, TSG101, PBX3, SUCO, DYNC1LI2, BBX, PHC3, LAPTM4A, NPAS2, STYX, EEA1, SLC22A23, NAA30 |
| hsa-mir-96-5p | JAZF1, SLC25A25, KRAS, CNNM3, MAP3K3, EDEM1, SLC1A1, SNX7, STK17B, FOXO1, TMEM170B, APPL1, PRKAR1A, MBD4, PRDM16, ADCY6, ZEB1, EIF4EBP2, SCARB1, REV1, TSKU, ABCD1, SNX16, PPP1R9B, TRIB3, NHLRC3, PRKCE, DDIT3, MED1, CASP2, SIN3B, CCNG1, FRS2, PROK2, DDAH1, ALK, ASH1L, MORF4L1, SLC39A1 |
Survival analysis with differentially expressed lncRNAs
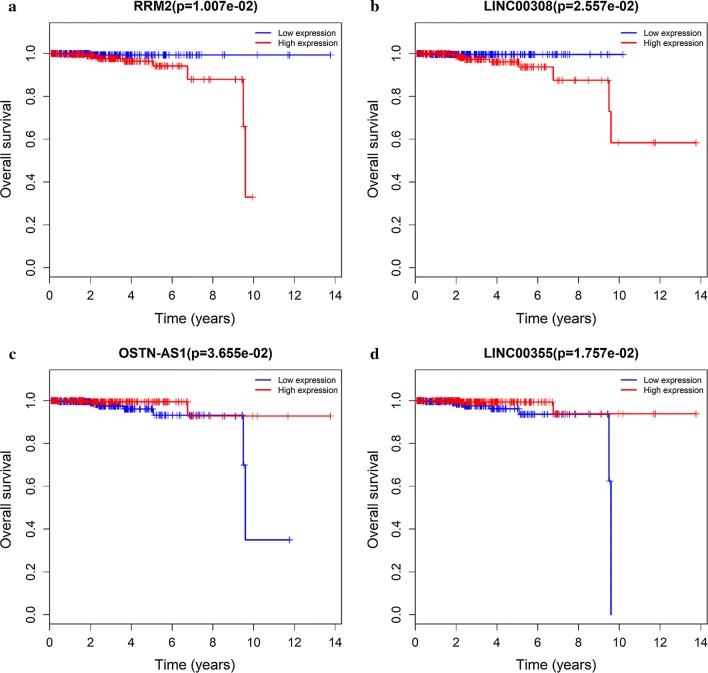
To examine the relationship between the differentially expressed lncRNAs and the prognosis of patients with prostate cancer, the link between overall survival and the 63 differentially expressed lncRNAs in prostate cancer patients was analyzed by Kaplan–Meier method. Three of 63 differentially expressed lncRNAs were linked to the prognosis in prostate cancer: LINC00355 and lncRNA OSTN-AS1 were positively associated with overall survival, whereas LINC00308 correlated negatively with it (log-rank P < 0.05) (Fig. 5).
Fig. 5.
Kaplan–Meier survival curves for 1 protein-coding gene RRM2 (a) and 3 lncRNAs LINC00308 (b), OSTN-AS1 (c) and LINC00355 (d) associated with overall survival in prostate cancer. P < 0.05
Establishment of a 4-mRNA signature associated with overall survival in prostate cancer patients
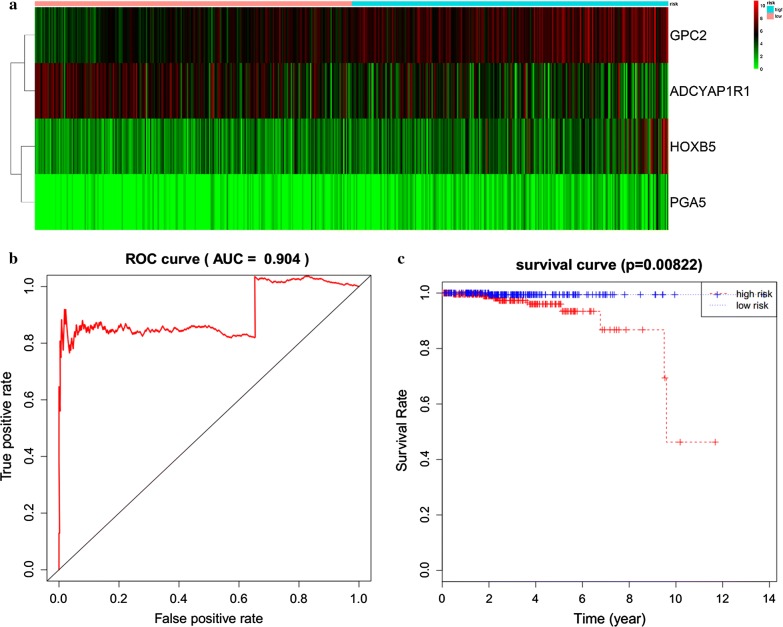
Univariate Cox regression analysis was first used to identify prognosis-related mRNAs, identifying 21 mRNAs that were significantly related to overall survival (P < 0.01). Then, multivariate Cox regression was performed, and 4 mRNAs were ultimately selected to establish a predictive model. The predictive model was defined as the linear combination of the expression levels of the 4 mRNAs, which were weighted using the corresponding relative coefficient in the multivariate Cox regression as follows: survival risk score = (0.420 × expression value of HOXB5 + 0.794 × expression value of GPC2 + 0.947 × PGA5 + 0.473 × AMBN). All 4 mRNAs had positive coefficients in the Cox regression analysis, indicating that their high expression was associated with shorter overall survival in prostate cancer patients.
Risk stratification and ROC curve analysis
The 4-mRNA expression-based survival risk score was used to assign patients into a low-risk or high-risk group using a median risk score of 0.9558 as the cutoff. Ultimately, a total of 247 patients were assigned to the high-risk group, versus 248 in the low-risk group (Fig. 6a). The Kaplan–Meier curves for overall survival demonstrated that there was a significant difference between the 2 groups, based on the 4 mRNAs (Fig. 6b). The 5-year and 10-year overall survival rates were 96.0% and 46.3% in the high-risk group, respectively. The prognostic power of the 4-mRNA signature was evaluated using the area under the ROC curve. In this study, the area under the ROC curve was 0.904, indicating good sensitivity and specificity of the 4-mRNA signature in predicting survival in prostate cancer patients (Fig. 6c; Table 6).
Fig. 6.
Prognostic evaluation of the 4-mRNA signature in prostate cancer patients. a The distribution of mRNA-related survival risk scores and heatmap of the 4 prognostic mRNAs. b Kaplan–Meier analysis of overall survival in prostate cancer patients with the 4-mRNA signature. c ROC curve analysis of the 4-mRNA signature
Table 6.
Multivariate Cox regression analysis of 4 prognostic mRNAs associated with overall survival in prostate cancer patients
| mRNA | coef | exp(coef) | se(coef) | z | P |
|---|---|---|---|---|---|
| HOXB5 | 0.42 | 1.522 | 0.155 | 2.7 | 0.00688 |
| GPC2 | 0.794 | 2.213 | 0.382 | 2.08 | 0.03735 |
| ADCYAP1R1 | − 0.396 | 0.673 | 0.249 | − 1.59 | 0.11195 |
| PGA5 | 0.947 | 2.577 | 0.286 | 3.31 | 0.00094 |
| AMBN | 0.473 | 1.605 | 0.187 | 2.53 | 0.01139 |
Functional assessment
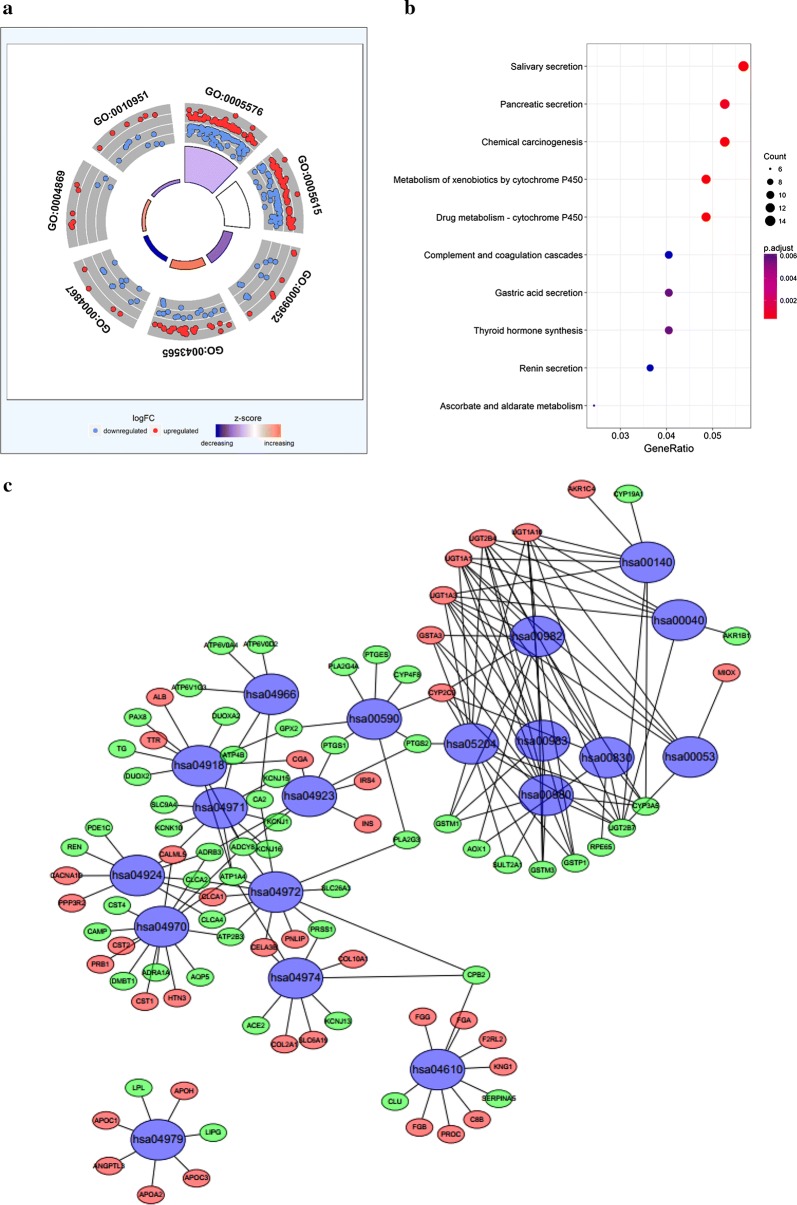
The functions of the differentially expressed mRNAs in the ceRNA network were determined using DAVID bioinformatics resources. The results demonstrated that 7 GO terms and 19 enriched KEGG pathways were involved in the ceRNA network (Fig. 7; Table 7).
Fig. 7.
Plot of enriched GO and KEGG terms for the differentially expressed genes. a Plot of enriched GO terms for differentially expressed mRNAs. b, c Plot of enriched KEGG pathways for differentially expressed mRNAs. GO gene ontology, KEGG kyoto encyclopedia of genes and genomes, FDR false discovery rate
Table 7.
KEEG pathways enriched by mRNAs
| Pathway ID | Description | P-value | Count |
|---|---|---|---|
| hsa04970 | Salivary secretion | 1.38E−06 | 14 |
| hsa05204 | Chemical carcinogenesis | 2.65E−06 | 13 |
| hsa00982 | Drug metabolism—cytochrome P450 | 2.77E−06 | 12 |
| hsa00980 | Metabolism of xenobiotics by cytochrome P450 | 5.08E−06 | 12 |
| hsa04972 | Pancreatic secretion | 1.58E−05 | 13 |
| hsa04918 | Thyroid hormone synthesis | 0.000156 | 10 |
| hsa04971 | Gastric acid secretion | 0.000175 | 10 |
| hsa00053 | Ascorbate and aldarate metabolism | 0.000213 | 6 |
| hsa04610 | Complement and coagulation cascades | 0.00027 | 10 |
| hsa04924 | Renin secretion | 0.000276 | 9 |
| hsa00830 | Retinol metabolism | 0.000311 | 9 |
| hsa00140 | Steroid hormone biosynthesis | 0.000696 | 8 |
| hsa00040 | Pentose and glucuronate interconversions | 0.000795 | 6 |
| hsa00590 | Arachidonic acid metabolism | 0.000974 | 8 |
| hsa00983 | Drug metabolism—other enzymes | 0.001185 | 9 |
| hsa04979 | Cholesterol metabolism | 0.001238 | 7 |
| hsa04966 | Collecting duct acid secretion | 0.001754 | 5 |
| hsa04923 | Regulation of lipolysis in adipocytes | 0.00196 | 7 |
| hsa04974 | Protein digestion and absorption | 0.002961 | 9 |
Discussion
Differentially expressed lncRNAs that correlated significantly with OS were identified by constructing an lncRNA-miRNA-mRNA ceRNA network, based on specific criteria in a large sample of prostate cancer patients in the TCGA database. Thus, there are potential interactions between mRNAs, lncRNAs, and miRNAs in the progression and metastasis of prostate cancer. In this study, ceRNA networks for prostate cancer were built by bioinformatics prediction and correlation analysis of data on significantly differentially expressed mRNAs, lncRNAs, and miRNAs. Further, considering the associations between cancer-specific ceRNAs and clinical characteristics, 3 lncRNAs (LINC00308, OSTN-AS1 and LINC00355) were related to the clinical prognosis. Moreover, 4 mRNAs (HOXB5, GPC2, PGA5, and AMBN) which screened to establish a predictive model were also associated with the clinical prognosis. Both 3 lncRNAs and 4 mRNAs are important because these RNAs are associated with overall survival of patients. These RNAs might provide more powerful prognostic information in predicting survival in prostate cancer.
The mechanisms that underlie the progression and metastasis of prostate cancer remain unknown. However, our understanding of the genesis and characteristics of prostate cancer has grown because of the development of high-throughput sequencing and bioinformatics. Recently, Liu et al. [17] revealed that miRNA genes can be considered tumor suppressor genes and novel oncogenes that are involved in the progression and metastasis of carcinomas. Liu et al. [17] also demonstrated that miR-141 employs several mechanisms to reduce the growth and metastasis of prostate cancer. Liu et al. [18] reported that the microRNA miR-34a inhibits the regeneration and metastasis of prostate cancer by repressing CD44 directly. Tinay et al. [19] demonstrated that 3 miRNAs are significantly overexpressed in serum from prostate cancer patients versus those without cancer. In this study, 58 miRNAs were significantly differentially expressed in prostate cancer compared with adjacent non-tumorous tissues.
lncRNAs are potential biomarkers in carcinogenesis and have significant advantages as diagnostic and prognostic biomarkers [20]. Previous research has confirmed that differentially expressed lncRNAs correlate with the progression and metastasis of carcinomas [21, 22]. Ramnarine et al. [23] reported that the lncRNAs FENDRR, H19, LINC00514, LINC00617, and SSTR5-AS1 are involved in the development of neuroendocrine prostate cancer. Zhang et al. [24] found that cell proliferation in hormone-refractory prostate cancer is promoted by the lncRNA PCGEM1. In this study, 773 lncRNAs were identified. LINC00355 and OSTN-AS1 were positively associated with overall survival, whereas LINC00308 correlated negatively with overall survival. LINC00355, OSTN-AS1, and LINC00308 were included in the ceRNA network, suggesting that these lncRNAs play an important role in the progression and prognosis of prostate cancer.
Only 1 of 18 differentially expressed mRNAs (RRM2), which constructed of ceRNA networks, were significantly associated with overall survival in prostate cancer. Although RRM2 has been studied in colorectal cancer [25], non-small cell lung cancer [26], pancreatic cancer [27], adrenocortical cancer [28], and cervical cancer [29]. However, the role of RRM2 in prostate cancer has not been established yet. In this study, the higher expression of RRM2 was associated with worse survival outcome in prostate cancer. Chang et al. [25] demonstrated that overexpression of RRM2 was associated with survival and recurrence in colorectal cancer patients with k-ras mutation. Yoshida et al. [30] found that the upregulation of RRM2 was essential for the proliferation of colorectal cancer cell lines. Rahman et al. [26] indicated that knockdown of RRM2 was associated with apoptosis of head and neck squamous cell carcinoma and non-small cell lung cancer. These finds mentioned above suggested that RRM2 may be a potential prognostic targets in prostate cancer.
However, there are no reports on the correlation between LINC00308 and disease. Moreover, the function of LINC00308 has not been examined. Thus, the genes that are related to LINC00308 were predicted by constructing an lncRNA-miRNA-mRNA network. The results demonstrated that 2 miRNAs (has-mir-137 and has-mir-93-5p) are associated with LINC00308. The target genes of these 2 miRNAs were then predicted, resulting in 29 has-mir-137 target genes and 385 has-mir-93-5p target genes. We found three common hits between the target genes of these 2 miRNAs: RORA, GIGYF1, and NCOA3. Mocellin et al. [31] reported that RORA is significantly associated with the risk of breast carcinoma, prostate carcinoma, and lung carcinoma. Zhu et al. [32] also found that RORA is a common fragile site gene that is inactivated in several carcinomas and is involved in responses to cellular stress. Moretti et al. [33] reported that RORA is a molecular target for the development of chemotherapeutic strategies for prostate carcinoma. Ajiro et al. [34] demonstrated that the phosphorylation of Akt at Ser 473 is significantly reduced after GIGYF1 knockdown in breast cancer cell lines. Tong et al. [35] revealed that NCOA3 is overexpressed in human hepatocellular carcinoma specimens and promotes the proliferation of human hepatocellular carcinoma. Ngollo et al. [36] showed that NCOA3 is upregulated in prostate cancer compared with normal prostate tissues. Moreover, the expression of NCOA3 also correlates with Gleason score, clinical stage, and PSA levels.
Conventional prognostic systems generally make insufficient predictions for risk stratification and estimations of clinical outcome because of the heterogeneity between patients. Thus, in recent decades, much effort has been made to establish a novel prognostic model to improve the prediction of survival in prostate cancer patients [37–39]. In this study, we generated a 4-mRNA signature that predicted the clinical outcome of prostate cancer. To the best of our knowledge, this is the first mRNA-related predictive model that is based on TCGA RNA-seq data from 495 prostate cancer patients. These 4 mRNAs were identified to establish a predictive model that is based on their linear combination. A significant difference of survival rate was observed between the high-risk and low-risk groups. In the ROC analysis, the AUC was 0.904, indicating high sensitivity and specificity of the mRNA signature. The GCP2 has been explored in several studies [40–42]. However, the role of GCP2 in prostate cancer has not been elucidated yet. Dráberová et al. [41] reported that the immunoreactivity of GCP2 was significantly increased in glioblastoma cells than that in normal brains cells. The GCP2 was also related to the progress of the microvascular proliferation. The dysregulation of GCP2 in glioblastomas may also associated with the alteration of transcriptional checkpoint activity.
The GO term analysis demonstrated that the differentially expressed mRNAs were involved primarily in sequence-specific DNA binding, negative regulation of endopeptidase activity, anterior/posterior pattern specification, extracellular space, extracellular region, cysteine-type endopeptidase inhibitor activity, and serine-type endopeptidase inhibitor activity. Furthermore, the enriched KEGG pathways of the differentially expressed mRNAs included salivary secretion, pancreatic secretion, chemical carcinogenesis, metabolism of xenobiotics by cytochrome P450, drug metabolism-cytochrome P450, complement and coagulation cascades, gastric acid secretion, thyroid hormone synthesis, renin secretion, and ascorbate and aldarate metabolism.
This study has some limitations. Although the data obtained from TCGA database represent an important tool for complex analyzes of biomarkers, it is known that they are produced by extremely heterogeneous samples. All data obtained and statistically analyzed in this study were not validated on representative samples subsequently in this study. Following are some reasons. On the one hand, the original design of this study was using varieties of bioinformatics tools and databases to dig useful and potential targeted mRNAs, miRNAs, and lncRNAs which associated with the prognostic outcomes. On the other hand, we aimed to explore mRNA signatures that predict survival in prostate cancer. To the best of our knowledge, some mRNAs are not transcriptable, which means some mRNAs-related proteins cannot be detected in the immunohistochemistry assay. Third, the prostate cancer tissue and health prostate tissue are difficult to distinguish in the fresh pathological specimens. Thus, it is very difficult for us to do further validation based on the fresh pathological specimens assay of prostate cancer.
Conclusion
In conclusion, we identified three differentially expressed lncRNAs that potentially predict overall survival in prostate cancer patients by analyzing the lncRNA, mRNA, and miRNA profiles in the TCGA database using a ceRNA network. The underlying mechanisms of these lncRNAs in prostate cancer should be determined.
Authors’ contributions
Conceived and designed the study: XG, XYX. Collected the literature: NX. Wrote the manuscript: NX, YPW. Revised the manuscript: HBY, XG. All authors read and approved the final manuscript.
Acknowledgements
None.
Competing interests
The authors declare that they have no competing interests.
Availability of data and materials
Not applicable.
Consent for publication
Not applicable.
Ethics approval and consent to participate
Not applicable.
Funding
None.
Publisher’s Note
Springer Nature remains neutral with regard to jurisdictional claims in published maps and institutional affiliations.
Abbreviations
- miRNA
microRNA
- mRNA
messenger RNA
- lncRNA
long non-coding RNA
- CRPC
castration-resistant prostate cancer
- ceRNAs
competing endogenous RNAs
- GDC
the genomic data commons data portal
- TCGA
the genomic data commons data portal and the cancer genome atlas database
- DAVID
database for annotation, visualization, and integrated discovery
- GO
gene ontology database
- KEGG
the kyoto encyclopedia of genes and genomes
- ROC curve
receiver operating characteristic curve
- AUC
area under curve
- PSA
prostate-specific antigen
References
- 1.Wu J, Wilson KM, Stampfer MJ, Willett WC, Giovannucci EL. A 24-year prospective study of dietary alpha-linolenic acid and lethal prostate cancer. Int J Cancer. 2018;142(11):2207–2214. doi: 10.1002/ijc.31247. [DOI] [PMC free article] [PubMed] [Google Scholar]
- 2.Siegel RL, Miller KD, Jemal A. Cancer statistics, 2016. CA Cancer J Clin. 2016;66(1):7–30. doi: 10.3322/caac.21332. [DOI] [PubMed] [Google Scholar]
- 3.Parker C, Nilsson S, Heinrich D, et al. Alpha emitter radium-223 and survival in metastatic prostate cancer. N Engl J Med. 2013;369(3):213–223. doi: 10.1056/NEJMoa1213755. [DOI] [PubMed] [Google Scholar]
- 4.Beer TM, Armstrong AJ, Rathkopf DE, et al. Enzalutamide in metastatic prostate cancer before chemotherapy. N Engl J Med. 2014;371(5):424–433. doi: 10.1056/NEJMoa1405095. [DOI] [PMC free article] [PubMed] [Google Scholar]
- 5.Ryan CJ, Smith MR, Fizazi K, et al. Abiraterone acetate plus prednisone versus placebo plus prednisone in chemotherapy-naive men with metastatic castration-resistant prostate cancer (COU-AA-302): final overall survival analysis of a randomised, double-blind, placebo-controlled phase 3 study. Lancet Oncol. 2015;16(2):152–160. doi: 10.1016/S1470-2045(14)71205-7. [DOI] [PubMed] [Google Scholar]
- 6.de Bono JS, Oudard S, Ozguroglu M, et al. Prednisone plus cabazitaxel or mitoxantrone for metastatic castration-resistant prostate cancer progressing after docetaxel treatment: a randomised open-label trial. Lancet. 2010;376(9747):1147–1154. doi: 10.1016/S0140-6736(10)61389-X. [DOI] [PubMed] [Google Scholar]
- 7.Klein EA, Santiago-Jimenez M, Yousefi K, et al. Molecular analysis of low grade prostate cancer using a genomic classifier of metastatic potential. J Urol. 2017;197(1):122–128. doi: 10.1016/j.juro.2016.08.091. [DOI] [PubMed] [Google Scholar]
- 8.Sinnott JA, Peisch SF, Tyekucheva S, et al. Prognostic utility of a new mRNA expression signature of gleason score. Clin Cancer Res. 2017;23(1):81–87. doi: 10.1158/1078-0432.CCR-16-1245. [DOI] [PMC free article] [PubMed] [Google Scholar]
- 9.Edwards DR, Moroz K, Zhang H, Mulholland D, Abdel-Mageed AB, Mondal D. PRL3 increases the aggressive phenotype of prostate cancer cells in vitro and its expression correlates with high-grade prostate tumors in patients. Int J Oncol. 2018;52(2):402–412. doi: 10.3892/ijo.2017.4208. [DOI] [PMC free article] [PubMed] [Google Scholar]
- 10.Birney E, Stamatoyannopoulos JA, Dutta A, et al. Identification and analysis of functional elements in 1% of the human genome by the ENCODE pilot project. Nature. 2007;447(7146):799–816. doi: 10.1038/nature05874. [DOI] [PMC free article] [PubMed] [Google Scholar]
- 11.Xiao H, Zhang F, Zou Y, Li J, Liu Y, Huang W. The function and mechanism of long non-coding RNA-ATB in cancers. Front Physiol. 2018;9:321. doi: 10.3389/fphys.2018.00321. [DOI] [PMC free article] [PubMed] [Google Scholar]
- 12.Salmena L, Poliseno L, Tay Y, Kats L, Pandolfi PP. A ceRNA hypothesis: the Rosetta Stone of a hidden RNA language? Cell. 2011;146(3):353–358. doi: 10.1016/j.cell.2011.07.014. [DOI] [PMC free article] [PubMed] [Google Scholar]
- 13.Ebert MS, Neilson JR, Sharp PA. MicroRNA sponges: competitive inhibitors of small RNAs in mammalian cells. Nat Methods. 2007;4(9):721–726. doi: 10.1038/nmeth1079. [DOI] [PMC free article] [PubMed] [Google Scholar]
- 14.Poliseno L, Salmena L, Zhang J, Carver B, Haveman WJ, Pandolfi PP. A coding-independent function of gene and pseudogene mRNAs regulates tumour biology. Nature. 2010;465(7301):1033–1038. doi: 10.1038/nature09144. [DOI] [PMC free article] [PubMed] [Google Scholar]
- 15.Li F, Huang C, Li Q, Wu X. Construction and comprehensive analysis for dysregulated long non-coding RNA (lncRNA)-associated competing endogenous RNA (ceRNA) network in gastric cancer. Med Sci Monit. 2018;24:37–49. doi: 10.12659/MSM.905410. [DOI] [PMC free article] [PubMed] [Google Scholar]
- 16.Lu M, Xu X, Xi B, et al. Molecular network-based identification of competing endogenous RNAs in thyroid carcinoma. Genes. 2018;9(1):44. doi: 10.3390/genes9010044. [DOI] [PMC free article] [PubMed] [Google Scholar]
- 17.Liu C, Liu R, Zhang D, et al. MicroRNA-141 suppresses prostate cancer stem cells and metastasis by targeting a cohort of pro-metastasis genes. Nat Commun. 2017;8:14270. doi: 10.1038/ncomms14270. [DOI] [PMC free article] [PubMed] [Google Scholar]
- 18.Liu C, Kelnar K, Liu B, et al. The microRNA miR-34a inhibits prostate cancer stem cells and metastasis by directly repressing CD44. Nat Med. 2011;17(2):211–215. doi: 10.1038/nm.2284. [DOI] [PMC free article] [PubMed] [Google Scholar]
- 19.Tinay I, Tan M, Gui B, Werner L, Kibel AS, Jia L. Functional roles and potential clinical application of miRNA-345-5p in prostate cancer. Prostate. 2018 doi: 10.1002/pros.23650. [DOI] [PubMed] [Google Scholar]
- 20.Hauptman N, Glavač D. Long non-coding RNA in cancer. Int J Mol Sci. 2013;14(3):4655–4669. doi: 10.3390/ijms14034655. [DOI] [PMC free article] [PubMed] [Google Scholar]
- 21.Augoff K, Mccue B, Plow EF, Sosseyalaoui K. miR-31 and its host gene lncRNA LOC554202 are regulated by promoter hypermethylation in triple-negative breast cancer. Mol Cancer. 2012;11(1):5. doi: 10.1186/1476-4598-11-5. [DOI] [PMC free article] [PubMed] [Google Scholar]
- 22.Rönnau CG, Verhaegh GW, Lunavelez MV, Schalken JA. Noncoding RNAs as novel biomarkers in prostate cancer. Biomed Res Int. 2014;2014:591703. doi: 10.1155/2014/591703. [DOI] [PMC free article] [PubMed] [Google Scholar]
- 23.Ramnarine VR, Alshalalfa M, Mo F, et al. The long noncoding RNA landscape of neuroendocrine prostate cancer and its clinical implications. GigaScience. 2018 doi: 10.1093/gigascience/giy050. [DOI] [PMC free article] [PubMed] [Google Scholar]
- 24.Zhang S, Li Z, Zhang L, Xu Z. MEF2 activated long noncoding RNA PCGEM1 promotes cell proliferation in hormonerefractory prostate cancer through downregulation of miR148a. Mol Med Rep. 2018;18(1):202–208. doi: 10.3892/mmr.2018.8977. [DOI] [PMC free article] [PubMed] [Google Scholar]
- 25.Chang CC, Lin CC, Wang CH, et al. miR-211 regulates the expression of RRM2 in tumoral metastasis and recurrence in colorectal cancer patients with a k-ras gene mutation. Oncol Lett. 2018;15(5):8107–8117. doi: 10.3892/ol.2018.8295. [DOI] [PMC free article] [PubMed] [Google Scholar]
- 26.Rahman MA, Amin AR, Wang D, et al. RRM2 regulates Bcl-2 in head and neck and lung cancers: a potential target for cancer therapy. Clin Cancer Res. 2013;19(13):3416–3428. doi: 10.1158/1078-0432.CCR-13-0073. [DOI] [PMC free article] [PubMed] [Google Scholar]
- 27.Xia G, Wang H, Song Z, Meng Q, Huang X, Huang X. Gambogic acid sensitizes gemcitabine efficacy in pancreatic cancer by reducing the expression of ribonucleotide reductase subunit-M2 (RRM2) J Exp Clin Cancer Res. 2017;36(1):107. doi: 10.1186/s13046-017-0579-0. [DOI] [PMC free article] [PubMed] [Google Scholar]
- 28.Grolmusz VK, Karaszi K, Micsik T, et al. Cell cycle dependent RRM2 may serve as proliferation marker and pharmaceutical target in adrenocortical cancer. Am J Cancer Res. 2016;6(9):2041–2053. [PMC free article] [PubMed] [Google Scholar]
- 29.Wang N, Zhan T, Ke T, et al. Increased expression of RRM2 by human papillomavirus E7 oncoprotein promotes angiogenesis in cervical cancer. Br J Cancer. 2014;110(4):1034–1044. doi: 10.1038/bjc.2013.817. [DOI] [PMC free article] [PubMed] [Google Scholar]
- 30.Yoshida Y, Tsunoda T, Doi K, et al. KRAS-mediated up-regulation of RRM2 expression is essential for the proliferation of colorectal cancer cell lines. Anticancer Res. 2011;31(7):2535–2539. [PubMed] [Google Scholar]
- 31.Mocellin S, Tropea S, Benna C, Rossi CR. Circadian pathway genetic variation and cancer risk: evidence from genome-wide association studies. BMC Med. 2018;16(1):20. doi: 10.1186/s12916-018-1010-1. [DOI] [PMC free article] [PubMed] [Google Scholar]
- 32.Zhu Y, McAvoy S, Kuhn R, Smith DI. RORA, a large common fragile site gene, is involved in cellular stress response. Oncogene. 2006;25(20):2901–2908. doi: 10.1038/sj.onc.1209314. [DOI] [PubMed] [Google Scholar]
- 33.Moretti RM, Montagnani Marelli M, Sala A, Motta M, Limonta P. Activation of the orphan nuclear receptor RORalpha counteracts the proliferative effect of fatty acids on prostate cancer cells: crucial role of 5-lipoxygenase. Int J Cancer. 2004;112(1):87–93. doi: 10.1002/ijc.20387. [DOI] [PubMed] [Google Scholar]
- 34.Ajiro M, Katagiri T, Ueda K, et al. Involvement of RQCD1 overexpression, a novel cancer-testis antigen, in the Akt pathway in breast cancer cells. Int J Oncol. 2009;35(4):673–681. [PubMed] [Google Scholar]
- 35.Tong Z, Li M, Wang W, et al. Steroid receptor coactivator 1 promotes human hepatocellular carcinoma progression by enhancing Wnt/beta-catenin signaling. J Biol Chem. 2015;290(30):18596–18608. doi: 10.1074/jbc.M115.640490. [DOI] [PMC free article] [PubMed] [Google Scholar]
- 36.Ngollo M, Lebert A, Dagdemir A, et al. The association between histone 3 lysine 27 trimethylation (H3K27me3) and prostate cancer: relationship with clinicopathological parameters. BMC Cancer. 2014;14:994. doi: 10.1186/1471-2407-14-994. [DOI] [PMC free article] [PubMed] [Google Scholar]
- 37.Meurs P, Galvin R, Fanning DM, Fahey T. Prognostic value of the CAPRA clinical prediction rule: a systematic review and meta-analysis. BJU Int. 2013;111(3):427–436. doi: 10.1111/j.1464-410X.2012.11400.x. [DOI] [PubMed] [Google Scholar]
- 38.Guinney J, Wang T, Laajala TD, et al. Prediction of overall survival for patients with metastatic castration-resistant prostate cancer: development of a prognostic model through a crowdsourced challenge with open clinical trial data. Lancet Oncol. 2017;18(1):132–142. doi: 10.1016/S1470-2045(16)30560-5. [DOI] [PMC free article] [PubMed] [Google Scholar]
- 39.Uemura K, Miyoshi Y, Kawahara T, et al. Prognostic value of an automated bone scan index for men with metastatic castration-resistant prostate cancer treated with cabazitaxel. BMC Cancer. 2018;18(1):501. doi: 10.1186/s12885-018-4401-y. [DOI] [PMC free article] [PubMed] [Google Scholar]
- 40.Riehlman TD, Olmsted ZT, Branca CN, et al. Functional replacement of fission yeast gamma-tubulin small complex proteins Alp4 and Alp6 by human GCP2 and GCP3. J Cell Sci. 2013;126(Pt 19):4406–4413. doi: 10.1242/jcs.128173. [DOI] [PubMed] [Google Scholar]
- 41.Draberova E, D’Agostino L, Caracciolo V, et al. Overexpression and nucleolar localization of gamma-tubulin small complex proteins GCP2 and GCP3 in glioblastoma. J Neuropathol Exp Neurol. 2015;74(7):723–742. doi: 10.1097/NEN.0000000000000212. [DOI] [PubMed] [Google Scholar]
- 42.Blank BR, Alayoglu P, Engen W, Choi JK, Berkman CE, Anderson MO. N-substituted glutamyl sulfonamides as inhibitors of glutamate carboxypeptidase II (GCP2) Chem Biol Drug Des. 2011;77(4):241–247. doi: 10.1111/j.1747-0285.2011.01085.x. [DOI] [PMC free article] [PubMed] [Google Scholar]
Associated Data
This section collects any data citations, data availability statements, or supplementary materials included in this article.
Data Availability Statement
Not applicable.


