Abstract
Eukaryotic cells traffic proteins and lipids between different compartments using protein-coated vesicles and tubules. The retromer complex is required for generating cargo-selective tubulovesicular carriers from endosomal membranes1–3. Conserved in eukaryotes, retromer controls the cellular localisation and homeostasis of hundreds of transmembrane proteins, and its disruption is associated with major neurodegenerative disorders4–7. How retromer is assembled and how it is recruited to form coated tubules is unknown. Here we describe the structure of the retromer complex (Vps26-Vps29-Vps35) assembled on membrane tubules with the sorting nexin (SNX) BAR protein Vps5, using cryo-electron tomography (cryoET) and sub-tomogram averaging. This reveals a membrane-associated Vps5 array, from which arches of retromer extend away from the membrane surface. Vps35 forms the legs of these arches and Vps29 sits at the apex where it is free to interact with regulatory factors. The bases of the arches connect to each other and to Vps5 through Vps26. We observe the same arches on coated tubules within cells, confirming their functional significance. Vps5 binds to Vps26 at a position analogous to the previously described cargo and Snx3 binding site, implying the existence of distinct retromer-sorting nexin assemblies. The structure provides insights into the architecture of the coat and its mechanism of assembly, and suggests that retromer promotes tubule formation by directing the distribution of SNX proteins on the membrane surface while providing a scaffold for regulatory protein interactions.
Keywords: cryo-electron tomography, endosome, retromer, sorting nexin
Retromer forms complexes associated with different cellular trafficking routes by associating with SNX proteins that contain phox homology (PX) and bin/amphiphysin/rvs (BAR) domains (Vps5 and Vps17 in yeast), or with SNX proteins lacking BAR domains such as Snx3 or Snx278–12. BAR domains form antiparallel homo- and heterodimers that are able to sense and/or modulate membrane curvature13,14. Retromer has previously been described as the cargo sorting complex15,16, although recent studies suggest that the retromer-associated SNX proteins are the essential mediators of cargo binding10,17.
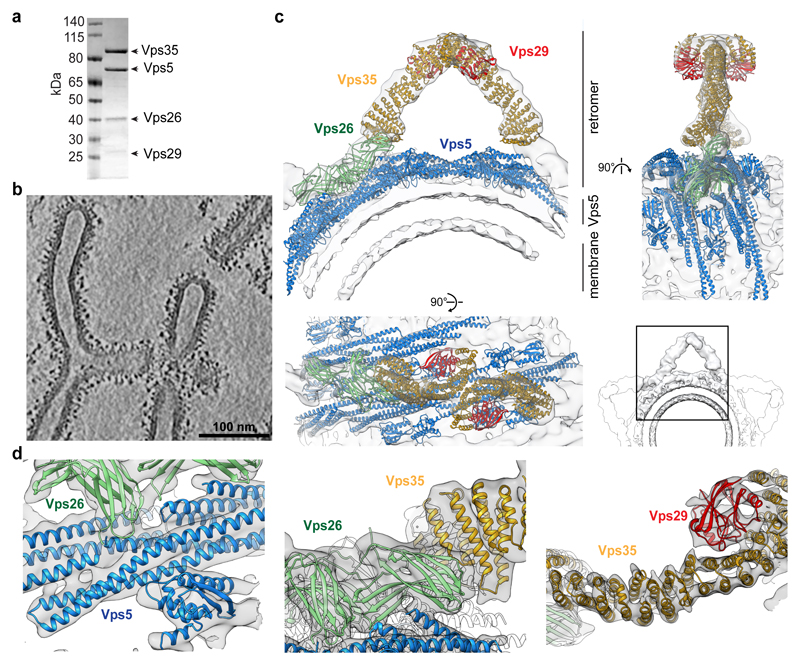
Bacterially co-expressed Vps35, Vps26, Vps35 retromer heterotrimers from Chaetomium thermophilum, (Extended Data Fig. 1a), were co-assembled with recombinant homodimeric Vps5 in solution (Fig. 1a, Extended Data Fig. 1b-d). Coated membrane tubules were produced in vitro by incubating retromer-Vps5 complexes with Folch lipid liposomes, yielding tubules with a membrane-to-membrane diameter of 31 ± 6 nm, (n = 209). The sides and tips of tubules, as well as residual donor liposomes, were decorated with a ~15 nm thick protein coat. Membrane recruitment of retromer was dependent on Vps5, while stable membrane tubulation by Vps5 was enhanced by retromer (Extended Data Fig. 1e, f). We imaged the resulting retromer-Vps5 coated tubules by cryoET (Fig. 1b, Supplementary Videos 1, 2, 3), and applied reference-free subtomogram averaging to determine the structure and arrangement of the coat. Initial alignment revealed the presence of arch-like units on the membrane surface, which were subjected to local alignment procedures to generate overlapping density maps at subnanometer resolutions that together covered the complete, assembled structure (Fig. 1c, Extended Data Fig. 2, 3, Extended Data Table 1, Supplementary Video 4). Consistent with the resolution, α-helices were resolved in the cryoET maps. We determined the crystal structure of C. thermophilum Vps29 at 1.8 Å resolution (Extended Data Fig. 4a and Extended Data Table 2), and generated models of all other coat subunits from crystal structures of human homologues. These structures could be unambiguously modeled within the cryoET density maps to generate a pseudo-atomic structure for the assembled coat (Fig. 1c, d, Extended Data Fig. 5a-c, Supplementary Video 4; see methods). Vps5 forms a pseudo-helical inner array on the membrane surface. Dimers of Vps26 interact directly with Vps5 and provide docking sites for Vps35 subunits that project away from the membrane. As predicted17–19, the Vps35 α-solenoids form highly extended structures, two copies of which meet at their C-termini to form an arch, with Vps29 cradled at the apex. By analogy, Vps26 forms the “foot” between each Vps35 “leg” and the Vps5 layer. Retromer itself makes no direct contact with the membrane surface. Flexibility throughout the retromer-Vps5 coat allows it to adapt to differing membrane curvatures (Extended Data Fig. 5d, e and Supplementary Video 5).
Figure 1. CryoET structure of membrane-associated retromer-Vps5.
(a) Coomassie-stained SDS-PAGE of purified retromer-Vps5. (b) Section through a cryo-electron tomogram of retromer-Vps5 coated membrane tubules. a and b are representative of at least 3 independent experiments. (c) Ribbon model of retromer-Vps5 superimposed on overlapped, low-resolution electron density maps from an intermediate subtomogram alignment (Extended Data Fig. 2e). Lower-right shows three copies of the same density (one is boxed) placed at positions related by the two-fold dimeric interface formed by Vps26, illustrating how the coat can propagate around the tubule. (d) Close-up views of the retromer model fitted into the final high-resolution density maps.
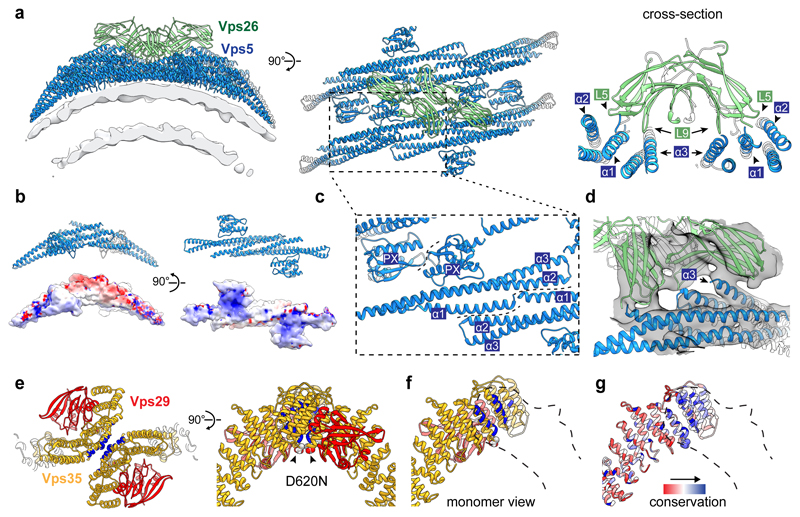
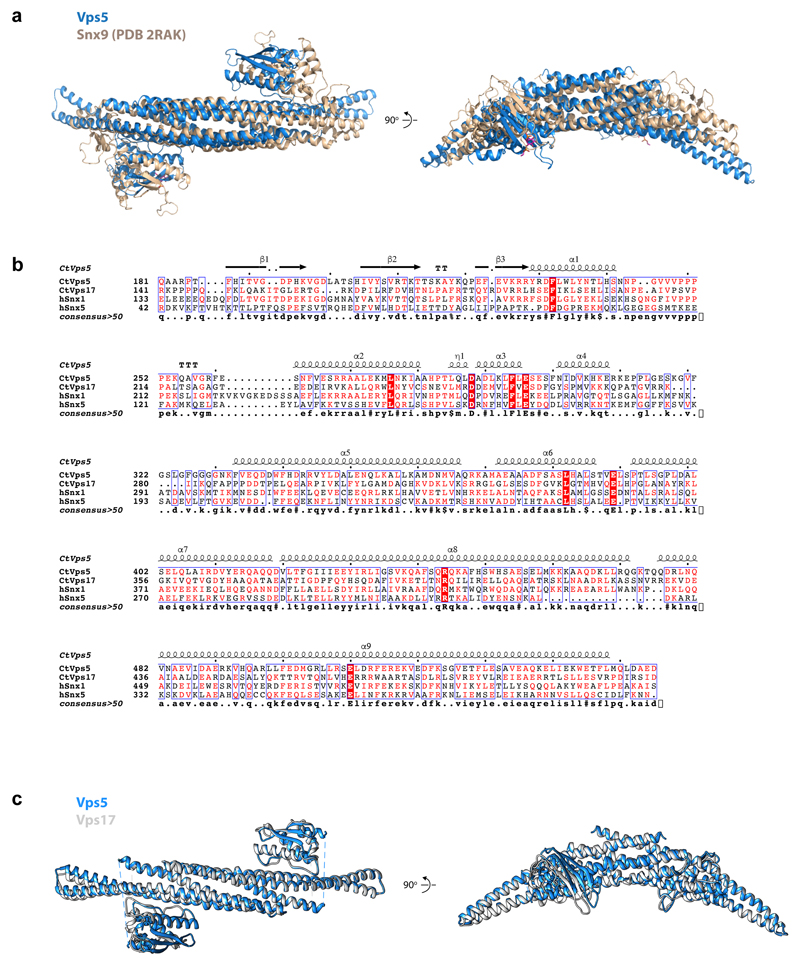
Vps5 forms curved homodimers similar to those of Snx9 and Snx3314 (Fig. 2a, b, Extended Data Fig. 6a). Vps5 dimers bind with their concave surface around the circumference of the tubule, similar to F-BAR and N-BAR domains13,20, contacting the membrane through conserved, positively charged surfaces at the ends of the BAR domains as well as the PX domains (Fig. 2a, b). Vps5 dimers interact with each other to form rows via tip-to-tip contacts between the N-terminal end of the α1 helix of one BAR domain and α2 and α3 helices of the next BAR domain (Fig. 2c). Lateral contacts between rows occur through the PX domains, via the loop between the first and second β-strands and the beginning of the second α-helix (Fig. 2c). Vps17 is likely to be structurally homologous to Vps5, in which case a heterodimeric Vps5/Vps17 array would form via equivalent contacts (Extended Data Fig. 6b, c).
Figure 2. Structures of interfaces within retromer-Vps5.
(a) Ribbon model of Vps26 dimer interacting with four membrane-bound Vps5 dimers. Segmented electron density for the lipid bilayer is illustrated. Top view highlights the two-fold symmetry of the Vps26-Vps5 assembly. Cross-section though the model illustrates interactions between Vps26 loops and Vps5 helices. (b) Ribbon and surface models of Vps5. Surfaces are gradient-coloured by electrostatic potential from red (negative) to blue (positive). (c) Adjacent Vps5 dimers undergo tip-to-tip interactions between BAR domain helices and lateral interactions between PX domains. (d) Overlay of ribbon model and the electron density map showing that the C-terminal α-helix of one Vps5 monomer protrudes towards the Vps26 C-terminal domain. In human Vps26, this is where Dmt1-II cargo binds in cooperation with Snx3 (Extended Data Fig. 4c, d). (e) The apex of the retromer arch viewed looking towards the membrane (left) and from the side (right). It is formed by a homodimeric interaction of Vps35 subunits (interface in blue) on the opposite face to where Vps29 is bound. Vps35 residues D694 (D620 in human Vps35) are indicated (arrows). The human mutation D620N causes Parkinson’s disease. (f) Cut-away view showing one arch leg. (g) As in f coloured by sequence conservation from red (low) to blue (high).
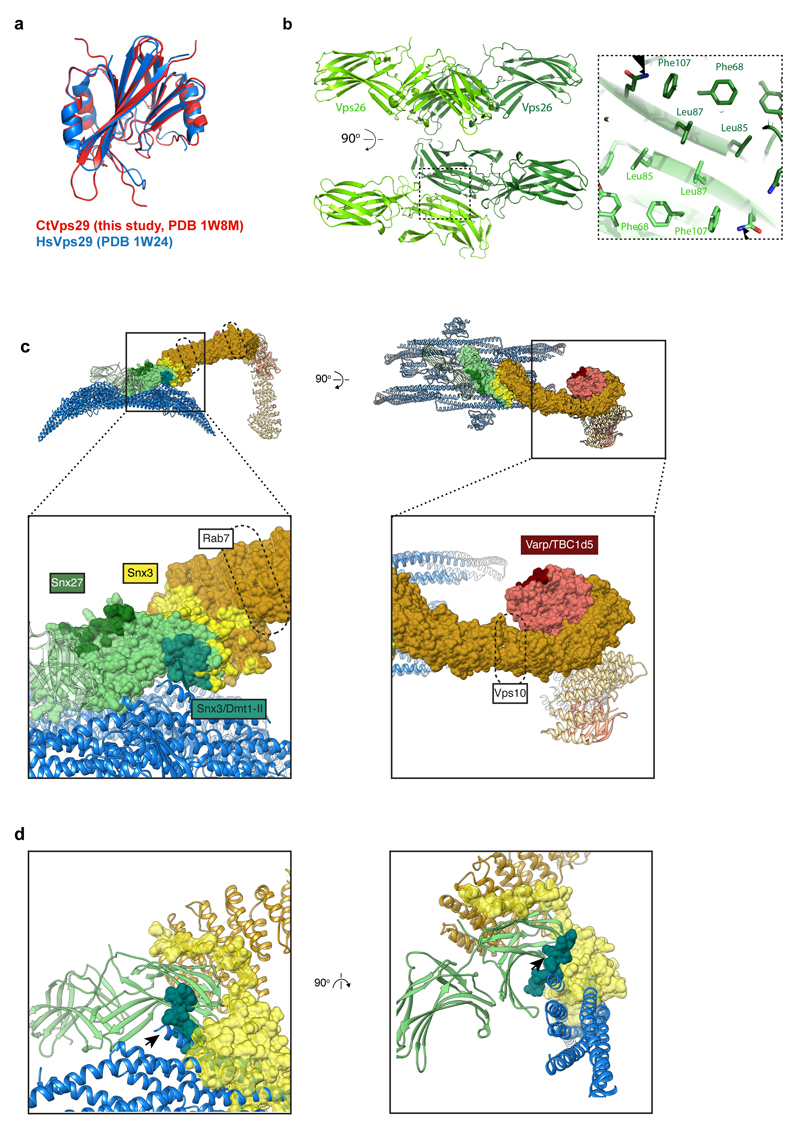
The Vps26 subunit forms the sole contact between retromer and the membrane-proximal Vps5 array. Vps26 forms a homodimer via β-sheet complementation between the β7 strands of the N-terminal domains (Extended Data Fig. 4b). Each Vps26 dimer contacts four Vps5 dimers and bridges two adjoining Vps5 rows (Fig. 2a). The N-terminal sub-domain of Vps26 has two electropositive loops, L5 (54KDGKR58) and L9 (134RRMAD138), which were predicted to play a role in membrane association17. In the retromer-Vps5 complex however, this site instead forms a complementary electrostatic cleft engaging two Vps5 dimers near their tip-to-tip contacts (Fig. 2a). A further electrostatic contact with the C-terminal domain of Vps26 induces movement of the C-terminal α-helix of one Vps5 monomer away from the rest of the coiled-coil bundle towards Vps26 (Fig. 2d), where it occludes the putative cargo-binding pocket identified in the human Vps26/Vps35/Snx3/Dmt1-II peptide complex (Extended Data Fig. 4c, d). This is consistent with findings that retromer-Snx3 may function in distinct cargo sorting events from coats including BAR domain-containing SNX proteins9,12. Thus, cargo-recruitment into retromer-Vps5 tubules could occur through exchange of the SNX proteins bound to Vps26 during coat assembly, or through direct cargo binding to retromer at different positions in the assembled coat (Extended Data Fig. 4c). Notably, human SNX-BAR proteins were recently found to engage cargo through their PX domains, suggesting multiple modes of cargo recognition are possible21,22.
The Vps35 α-solenoids interact via their N-termini with the N-terminal domain of Vps26, and via their C-termini with Vps29, as shown by crystallography17,18. Vps35 dimerises through a conserved interface at the apex of the arch on the opposite surface to Vps29 (Fig. 2e-g). Vps29 is exposed on the outside of the arch apex where it could recruit cytosolic regulatory factors, such as TBC1D523 and Varp24, reminiscent of ArfGAP2 recruitment by the exposed γ-COP appendage domain in the COPI coat25. The D620N mutation in human Vps35 that causes Parkinson’s disease6,7 lies adjacent to the Vps35 homodimerization interface, suggesting it may reduce Vps35 dimerisation efficiency and subsequent coat formation (Fig. 2e).
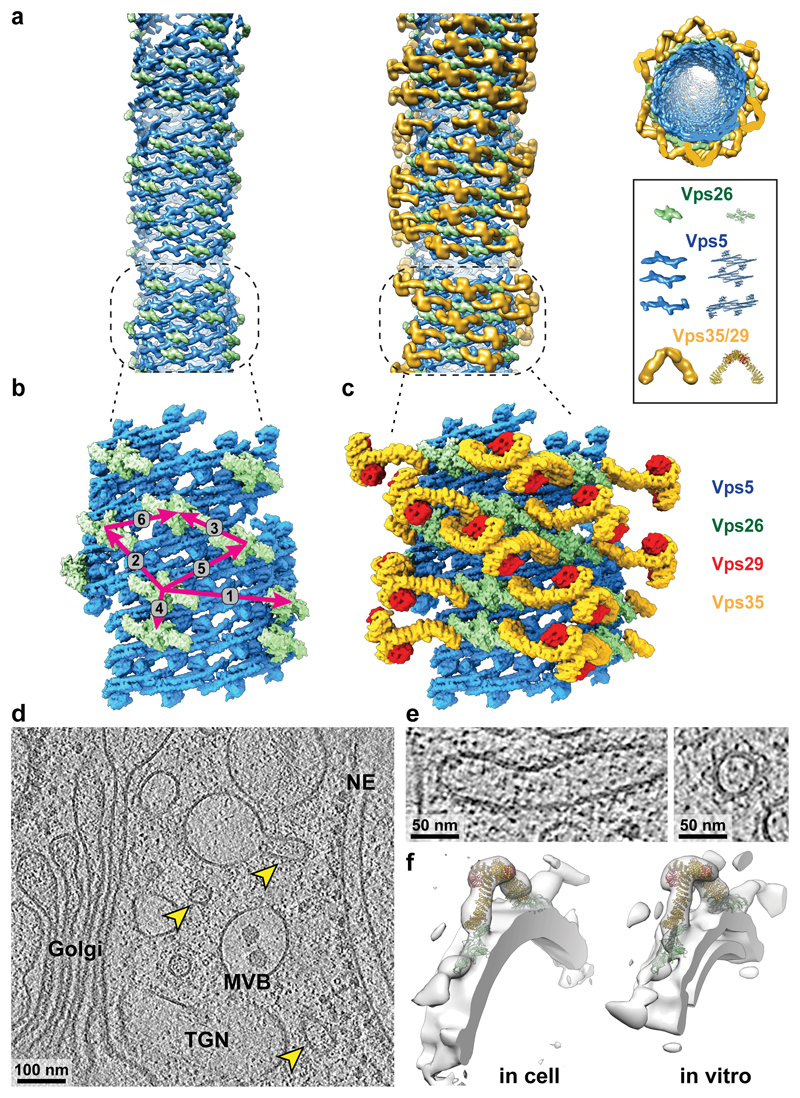
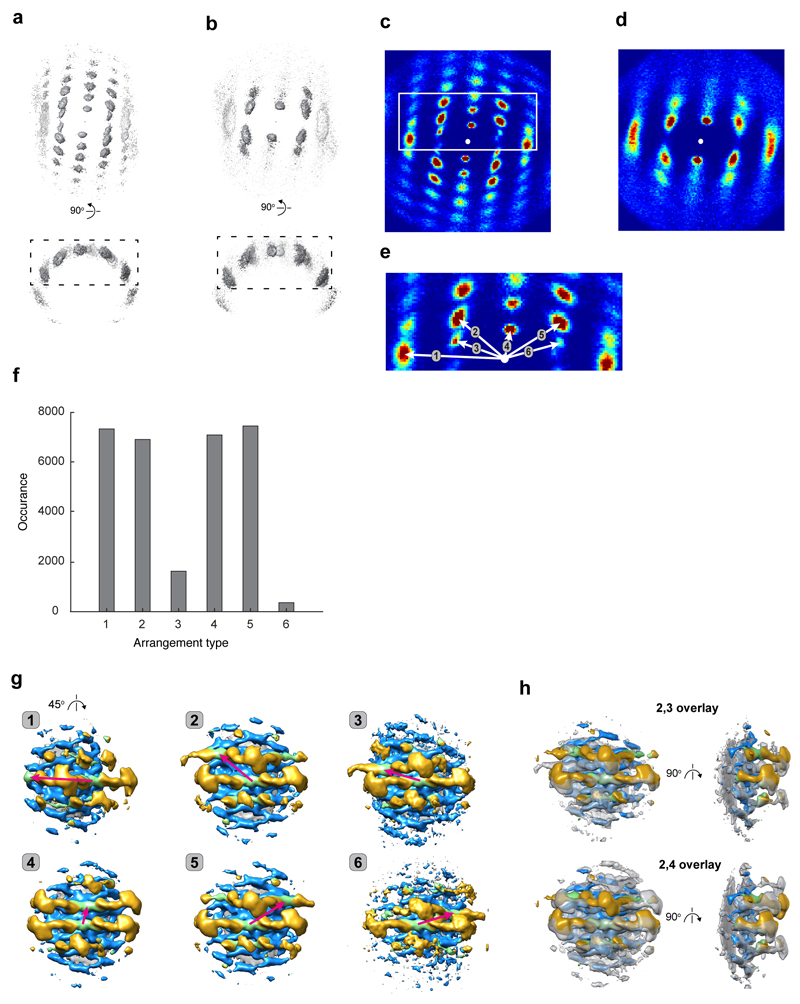
An extended membrane coat is formed via higher-order oligomerisation of retromer-Vps5. We visualized this higher-order arrangement on individual tubules by placing schematic retromer and Vps5 complexes at the positions and orientations determined by subtomogram averaging, revealing a semi-regular membrane coat structure (Fig. 3a). Membrane-associated Vps5 dimers form a pseudo-helical array with limited long-range order, suggesting plasticity that accommodates varying membrane curvatures. This patchwork Vps5 array provides multiple potential docking sites, and retromer complexes are positioned unevenly with respect to each other. We analysed the relative positions of Vps26 dimers (Extended Data Fig. 7), finding six different nearest-neighbour pairs corresponding to docking relationships on the Vps5 layer (Fig. 3b, Extended Data Fig. 7e, f). We determined local structures of the retromer coat for each of these preferred arrangements of Vps26 (Extended Data Fig. 7g). Arrangement 1 corresponds to the positioning of Vps26 at each end of a retromer arch, spanning two Vps5 dimers in adjacent rows. Other arrangements result from binding of Vps26 at alternative positions in nearby rows of the Vps5 array. When Vps26 dimers are docked closely together, the retromer arches can tilt to accommodate closely associated neighbours (Extended Data Fig. 7h). These models were then combined to visualize a section of the retromer coat from a representative tubule (Fig. 3b, c).
Figure 3. Organization of the retromer-Vps5 coat on membrane tubules, and the structure of retromer within the cell.
(a) A typical retromer-Vps5 coated tubule. Models of the individual elements of retromer-Vps5 have been placed at positions and orientations determined by subtomogram averaging. Left panel shows Vps5 and Vps26 layers, right panel shows the complete coat, also viewed along the tube axis of a retromer tubule. Representative models were prepared by segmentation and low-pass filtering of key features, and their respective protein structures are illustrated. (b) A model of the Vps5-Vps26 layers (corresponding to dashed box in a). Vps26 dimers dock in six relative orientations on the underlying Vps5 array, indicated by magenta arrows (Extended Data Fig. 7e). (c) A complete model of the retromer coat section shown in b. (d) Slice thorough one of 12 tomographic reconstructions of a C. reinhardtii cell in which retromer-coated membranes were identified (arrowheads). (e) Magnified views of two of 17 retromer-coated membranes in which arches can be seen. (f) Density maps filtered to 35 Å from retromer structures determined by subtomogram averaging in situ within the cell and in vitro, fitted with retromer models.
We next searched a dataset of cryo-electron tomograms of cryo-focused ion beam milled Chlamydomonas reinhardtii cells26 for protein-coated tubular membranes, and identified 17 coated-tubules emanating from multivesicular bodies, trans-Golgi network or lysosomes (Fig. 3d). In some tubule coats, arch-like features could be directly observed in the tomograms (Fig. 3e). We applied reference-free subtomogram averaging to determine the native, in situ structure of these coats, which revealed an arch-like structure essentially identical at the determined resolution to that determined in vitro (Fig. 3f). While the resolution is insufficient to identify membrane-proximal protein densities, density corresponding to Vps26, Vps29 and Vps35 is clearly seen, indicating that the arch-like arrangement of retromer observed in vitro represents the architecture present within the cell, and furthermore, that this is conserved between yeast and green algae.
The retromer-SNX-BAR coat observed by cryoET (Fig. 1c, 3a-c) is very different from a recently proposed model17. Vps29 and Vps35 subunits are exposed on the outside of the coat and are accessible to interact with peripheral proteins including regulators of actin and Rab GTPases. Previous cryoEM structures of isolated BAR domain-coated tubules have almost exclusively been determined with enforced helical symmetry13,20,27. The irregular array of Vps5 we observe, however, is more similar to that recently described for Bin128, also determined without enforcing helical symmetry, and shows that BAR domain proteins can modulate membrane tubulation without forming a perfect helical scaffold. Our cryoET structure suggests that retromer can stabilise the Vps5 array in two ways. First, each Vps26 dimer staples four Vps5 dimers together. Second, each retromer arch bridges Vps5 proteins that are more than 200 Å apart on the membrane, thereby spanning ~60° angular sections of the tubule and allowing retromer to modulate curvature over long distances. The coat architecture is consistent with a model in which cargo recognition is mediated by SNX proteins alone10,21,22 or in concert with retromer17, and where the primary role of retromer itself is as a structural scaffold that propagates curvature and interacts with regulatory proteins. In general, the retromer-Vps5 architecture shares similarities with other membrane coats including COPI, where α-solenoid subunits provide arch-shaped scaffolds for positioning membrane-associated Arf1 subunits29, supporting the proposed ancestral function for extended α-solenoid structures in organizing membrane-bending and cargo-binding modules at the membrane surface.
Methods
Protein expression and purification
All proteins were expressed in Escherichia coli BL21(DE3) strain with induction by IPTG (Extended Data Table 3). For purification of retromer complex, Vps29 and Vps35 proteins were co-expressed whereas Vps26 was expressed separately. Cell pellets from both expressions were combined and lysed by high-pressure homogenization in R-buffer (20 mM HEPES-KOH pH 7.5, 200 mM NaCl). The homogenate was cleared by centrifugation and loaded onto an HisTrap HP (GE Healthcare) resin cartridge followed by elution with 200 mM imidazole in R-buffer. The eluate was loaded onto a Glutathione-Sepharose 4B (GE Healthcare) cartridge and the retained protein was eluted by PreScission protease cleavage of the GST domain. The eluted retromer, devoid of GST-tag, was further purified by gel filtration chromatography using a Superdex 200 10/300 column (GE Healthcare) in R-buffer with 1 mM TCEP (Extended Data Fig. 1a).
His-tagged Vps5 dimer was isolated using a HisTrap cartridge followed by gel-filtration chromatography as above (Extended Data Fig. 1b, c). To prepare retromer-Vps5 complex, the purified Vps5 was mixed with Vps35-Vps26-Vps29 complex, and the mixture was purified by gel filtration on Superose 6, 10/300 (GE Healthcare) in R-buffer with 1mM TCEP.
GST-tagged Vps29 was expressed and purified essentially as above but using thrombin (Sigma Aldrich) to cleave the linker between GST and Vps29, and 50 mM Tris-HCl pH 8.0, 200 mM NaCl buffer instead of R-buffer. The cleaved protein was further purified by gel filtration chromatography on a Superdex 75 10/300 column (GE Healthcare) in 50 mM Tris-HCl pH 8.0, 200 mM NaCl.
Crystal structure determination of C. thermophilum Vps29
C. thermophilum Vps29 is 201 amino acids in length and thrombin cleavage leaves an additional two non-native N-terminal residues (GlySer). Crystals of Vps29 were produced by hanging drop vapour diffusion using protein at a concentration of 15 mg/ml. Crystals in spacegroup P21 grew from a reservoir solution of 8% PEG20000, 8% PEG550MME, 0.2 M calcium acetate and 0.1 M Tris (pH 8.0), and were cryoprotected in 25% glycerol. Crystals were screened at the UQ ROCX diffraction facility on a Rigaku FR-E Superbright generator with Osmic Vari-Max HF optics and Rigaku Saturn 944 CCD detector. Data for structure determination was collected at the Australian Synchrotron MX1 Beamline. Data was integrated with iMOSFLM30 and scaled with SCALA31. The structure was solved by molecular replacement with PHASER32 using the human Vps29 protein18 as an input model. The resulting models were rebuilt with COOT33 and refined with PHENIX34. Crystallographic data and structure statistics are provided in Extended Data Table 2.
Liposome pelleting and tubulation
Liposomes composed of POPC/POPE (1-palmitoyl-2-oleoyl-sn-glycero-3-phosphocholine and 1-palmitoyl-2-oleoyl-sn-glycero-3-phosphocholine in 70:30 molar ratio, Avanti Polar Lipids), Folch brain extract (Sigma) and Folch brain extract supplemented with 3 mol% of dipalmitoyl-phosphatidylinositol-3-phosphate (PI3P), (Echelon Biosciences) were prepared at 1 mg/ml liposome solution in R-buffer by extrusion through a 0.4 μm polycarbonate filter. For pelleting assays, liposomes at a final concentration of 0.5 mg/ml and protein at a final concentration of 3 μM were mixed in a final volume of 50 μl, incubated at room temperature for 15 min and then spun at 50,000 g for 30 min at 20ºC in a Beckman TLA 100 rotor. Supernatant and pellet fractions were analysed by Coomassie stained SDS-PAGE (Extended Data Fig. 1e). While the relative stoichiometry of retromer to Vps5 cannot be reliably measured by Coomassie staining, we note that there appears to be a reduced stoichiometry of retromer to Vps5 in the assembled structure. A proportion of retromer may dissociate from the pre-assembled retromer-Vps5 complex as tubule formation proceeds.
For tubulation assays, 2.5 μM of proteins were incubated with Folch liposomes (0.5 mg/mL) for 2 h at room temperature in R-buffer (Extended Data Fig. 1f).
CryoEM sample preparation and image acquisition
The retromer-Vps5 liposome tubulation reaction was mixed with 10 nm gold fiducial markers in identical buffer solution. 3 μl of this mixture was applied on a glow-discharged holey carbon grid (CF-2/1-3C, Protochips), blotted from the back and plunge-frozen in liquid ethane (Leica EM GP automatic plunger).
Imaging was performed on an FEI Titan Krios microscope fitted with Gatan Quantum 967 LS and Gatan K2 Summit direct detector operated by Serial-EM software35. 71 tomographic series were acquired using a dose-symmetric scheme36 with tilt range ± 60°, 3° angular increment and defoci between -2.5 μm and -6.5 μm. The acquisition magnification was 105,000x resulting in calibrated pixel size of 1.35 Å. Tilt images were recorded as 10-frame movies in super-resolution mode at dose rate ~1.8 e-/A2/s and a total dose per tomogram of ~131 e/A2. Super-resolution 8K frames were aligned, combined and Fourier-cropped to 3838 × 3710 pixels using the “alignframes” command from the IMOD package. Data collection parameters are summarized in Extended Data Table 1.
Tomogram reconstruction and subtomogram averaging
A small number of high-tilt images were discarded (e.g. those showing significant movement or where other objects obscured the field of view). Tilt-series were filtered according to the cumulative radiation dose37 and aligned based on the gold fiducials using the IMOD package38. CTF correction was performed with “ctfphaseflip” IMOD command39 using defocus values measured by CTFFIND440 on non-dose-filtered images. Tomograms were reconstructed from CTF-corrected, aligned stacks using weighted back-projection in IMOD. Tomograms were further binned 2, 4 and 8 times (hereafter called bin2, bin4 and bin8 tomograms) with anti-aliasing, resulting in pixel sizes of 2.7 Å/px, 5.4 Å/px and 10.8 Å/px respectively.
Subtomogram averaging was performed using MATLAB (MathWorks) functions adapted from the TOM41, AV342 and Dynamo packages43 essentially as described previously44. To define initial subtomogram positions, the central axes of retromer tubules were manually traced in bin4 tomograms and tube radii (measured from tube centre to the middle of the retromer layer) were recorded. The tubular geometry was used to define coordinates and initial rotations of overlapping sub-volumes along the tube surface. Rotations were defined to orient sub-volumes normal to the membrane and with the in-plane angle perpendicular to the main tubular axis; sub-volume spacing was 12 pixels (21.6 Å).
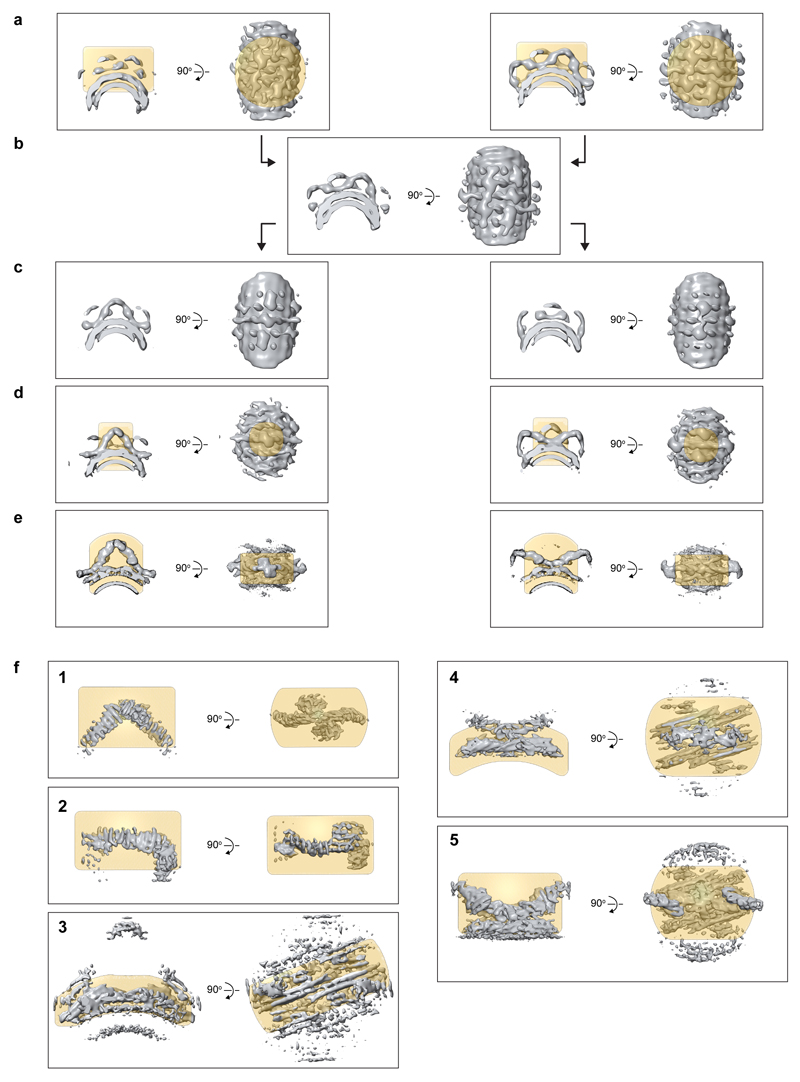
Reference-free subtomogram averaging (SA) was performed independently on 1203 pixel subtomograms extracted from two bin4 tomograms acquired at -2.5 μm and -5.5 μm defoci. A low-pass filter at 50 Å and a soft-edged cylindrical alignment mask were applied throughout. The alignment in both tomograms converged in 5 iterations revealing prominent two-fold symmetrical arch-like structures decorating the membrane layer (Extended Data Fig. 2a). These initial structures were aligned, averaged (Extended Data Fig. 2b) and rotated to place either the arch (“arch” model) or the base between two neighbouring arches (“base” model) in the centre of the reference (Extended Data Fig. 2c). The observed 2-fold symmetry was applied, and the reference was low-pass filtered to 50 Å prior to using it as a starting reference for alignment of the full dataset.
The full dataset was aligned against the “base” and “arch” models in two identical but independent procedures. Initial alignment was performed using 603 pixels subvolumes extracted from bin8 tomograms applying a low-pass filter at 50 Å and 2-fold symmetry. Upon alignment convergence (Extended Data Fig. 2d), where two or more subvolumes had converged to similar positions (within 5 pixels distance), only the subvolume giving the highest cross-correlation value to the reference was retained. Retained subvolumes were divided into odd and even datasets, which were processed independently hereafter.
Subsequent iterations of alignment and averaging were performed on sub-volumes of 723 pixels extracted from bin4 tomograms, and then subvolumes of 1443 pixels from bin2 tomograms. The step-increment of the angular search was gradually decreased and the low pass-filter was gradually moved towards higher resolution (but set at least 3 Fourier pixels lower than the frequency corresponding to 0.5 Fourier-shell correlation between the odd and even datasets). A shell mask that follows the curvature of the membrane layer was applied so that only retromer density was considered during alignment. A population of sub-volumes with lowest cross-correlation (~40 %) were removed by imposing a cross-correlation threshold selected manually for each tomogram. The threshold was set to remove sub-volumes that were not aligned to the membrane. The resolution for both “base” and “arch” alignments reached ~13 Å upon convergence (see maps in Extended Data Fig. 2e).
Further alignments were performed using masks focussed on three different regions of the arch structure (apex, leg and the membrane-associated region below the apex, Extended Data Fig. 2f, panels 1, 2, and 3 respectively) and two different regions of the base structure (immediately adjacent to, and slightly above, the membrane, Extended Data Fig. 2f, panels 4 and 5 respectively) to generate five maps (Extended Data Table 1). Two-fold symmetry was applied except for the alignment focussed on the leg, where two subvolumes were extracted from each arch using dynamo_subboxing_table (Dynamo), and symmetry was not applied.
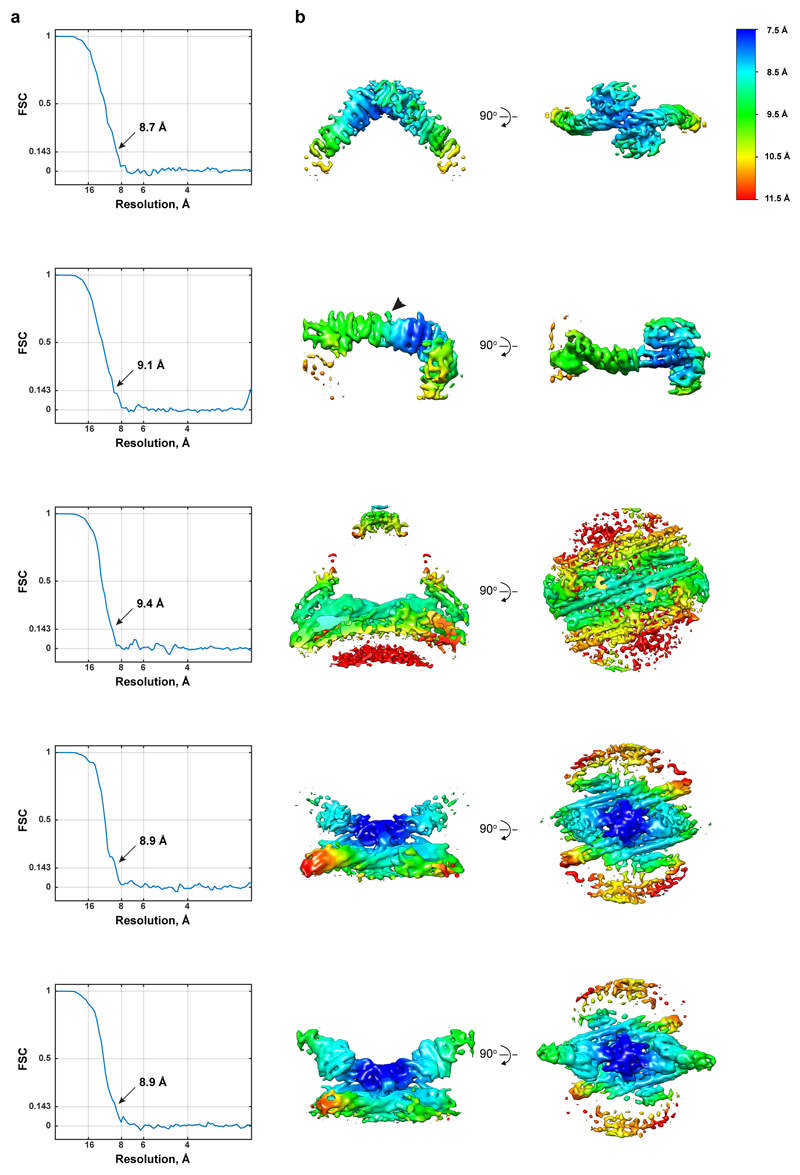
Final converged averages were formed by 37,360 asymmetric units for “arch”-derived and 32,074 asymmetric units for “base”-derived maps. The measured overall resolutions for each average ranged from 8.8 Å to 9.7 Å (Extended Data Fig. 3a). Local resolution maps are provided in Extended Data Fig. 3b. Final maps were reweighted by division by their summed CTFs and sharpened by empirically determined B factors of between 1300 and 1600.
Homology modelling
Human Snx1 (4FSZ) is the deposited atomic model with highest sequence similarity with C. thermophilum Vps5 BAR domain. However, the Snx1 BAR dimer in 4FSZ is highly curved and cannot be docked into the Vps5 BAR densities in our reconstruction. In contrast, the two deposited structures of SNX-BAR domains, Snx9 (2RAJ) and Snx33 (4AKV), correspond well to the shape of our experimentally-determined Vps5 densities. To allow Snx1 to be used as a template for structural homology modelling, we adapted the curvature of the Snx1 to match that of Snx9. This was done by flexibly fitting the Snx1 BAR domain into a density map simulated from the Snx9 structure using VMD and MDFF software (within NAMD)45. Secondary structure changes were prohibited throughout the simulation. The resulting “curvature adjusted” Snx1 BAR model was then used to build a homology model of the Vps5 BAR domain using the i-TASSER online service46. The Vps5 PX domain was modelled on the Snx7 PX domain (3IQ2) with i-TASSER. A complete Vps5 PX-BAR dimer was modelled by aligning the models of Vps5 PX and BAR domains to the Snx9 template as rigid bodies using the match-maker tool in Chimera.
No structures of the full-length retromer complex are available. Two partial homology models were generated using crystal structures of an N-terminal fragment of human Vps35 bound to Vps26 (5F0J) and a C-terminal fragment of human Vps35 bound to Vps29 (2R17). The Vps26-Vps35(N) complex and Vps29-Vps35(C) complex include residues 14-470 and 476-780 respectively, together covering nearly the entire human Vps35 sequence (796 residues in total). These two models were used as templates for modelling C. thermophilum Vps26-Vps35(N) and Vps29-Vps35(C) respectively using the “hetero-project” pipeline on the Swiss-Model web-server47. In the latter model the modelled Vps29 was then replaced by our X-ray structure of C. thermophilum Vps29 (1W8M).
Model building
UCSF Chimera48 and ChimeraX49 were used for rigid-body fitting and visualization. The relative orientations of the locally aligned maps were determined by sequential alignment of the maps using their overlapping regions using the “fit” command preceded by rough manual placement. The obtained composite was used to visualize the relative positions of structural models built in individual locally-aligned maps and to transfer models between the maps.
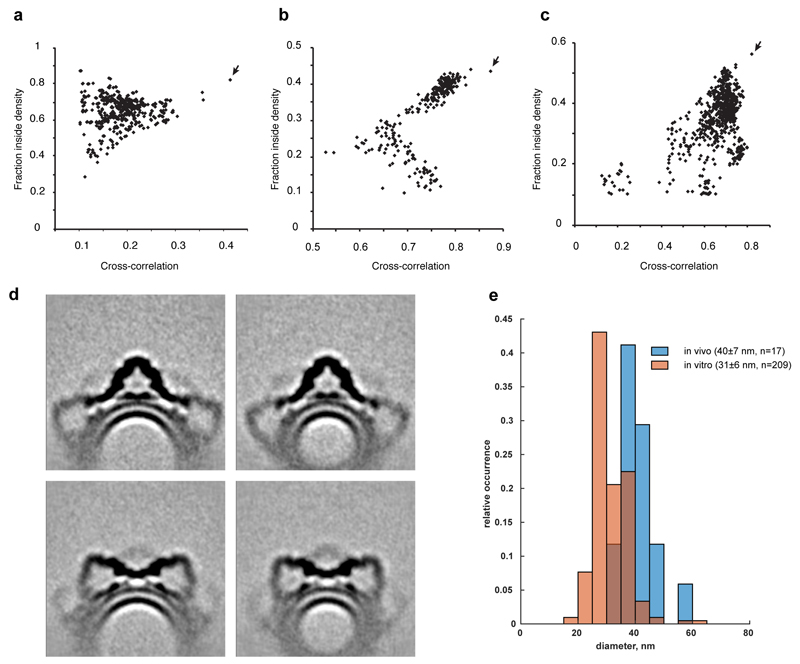
Vps26-Vps35(N), Vps29-Vps35(C) and Vps5 dimer homology models were fit into locally aligned maps using the Chimera fit command with random initial placement. Unique docking positions were identified displaying the highest cross-correlation and coverage scores (Extended Data Fig. 5a-c).
The results of rigid body fitting showed excellent correspondence with the observed density. For Vps5 and the central region of Vps35, some small differences in the positions of helices were observed between the fitted model and the EM density. Vps5 and residues 122-816 of Vps35 were therefore flexibly fit into the density maps with the highest local resolution using the MDFF software within NAMD45, maintaining all secondary structure. A long yeast-specific loop (305-387) and a long linker between N- and C-portions of Vps35 (537-559) were excluded from the Vps35 model. An unoccupied density (indicated by arrowhead in Extended Data Fig. 3b) may correspond to the putative helical region (340-370) in the 305-387 loop of Vps35.
We note that Vps5 dimers that contact Vps26 via their C-terminal helix (“stabilised dimers”) are better resolved than dimers with free C-termini (Extended Data Fig. 3b). In the final model, the “stabilised” Vps5 dimer that was fit into the map with highest local resolution was copied to all other positions where “stabilised” dimers were present and was fitted locally as a rigid body. For “unstabilised” Vps5 dimers, the fit into the map with highest local resolution was copied to another equivalent position.
Arrangement of the retromer coat
The arrangement of the retromer coat on individual tubules was visualised by placing models of protein components of the coat at the coordinates and rotations to which subtomograms converged during alignment (see example in Fig. 3a). Simplified models were prepared by segmenting densities of interest from the corresponding Gaussian-smoothed subtomogram averages using UCSF Chimera.
To assess the long-range order of the retromer coat, we determined the relative orientation of neighbouring retromer subunits. To do this, we took the positions and rotational orientations of all subtomograms in the final alignment, and plotted the relative positions of all neighbouring subtomograms (those within 416 Å). We performed this operation for subtomograms aligned on Vps26 and for subtomograms aligned on the apex of the retromer arch. In this way, the positions of 16037 and 18680 sets respectively of distance-selected neighbours were plotted to generate a 3D density plot (Extended Data Fig. 7a, b). To simplify visualisation, we flattened and projected the 3D density plot to give a 2D density plot (Extended Data Fig. 7c, d). The presence of peaks in the density plot shows that neighbours are found in preferred relative positions. The membrane-associated layer of the coat (represented by Vps26 dimers) shows more long-range order than the retromer arches, likely due to relative structural flexibility in the arch (compare Extended Data Fig. 7c and d).
Analysing the 3D density plot for Vps26 neighbours reveals six positions at which the nearest-neighbour Vps26 is located. Subtomograms were divided into groups according to whether a neighbour was identified in each of the six peaks (numbered in Extended Data Fig. 7e). Peaks related by the two-fold symmetry of Vps26 are equivalent and were therefore included in the same groups. Each of the six groups of subtomograms was then separately averaged (at bin4) to generate six local density maps of the retromer coat (Extended Data Fig. 7g). Each of the structures therefore shows the conformation of retromer when a nearest-neighbour is present in one of the six preferred positions (Fig 3b).
Models shown in Fig. 3a were prepared by segmentation and low-pass filtering, their respective protein structures are illustrated in the boxed panels. The models shown in Fig. 3b and c were built by fitting retromer components into the six density maps for each relation (Extended Data Fig. 7g), and combining the fitted structures in the relative arrangements observed in Fig. 3a.
Determination of the retromer coat structure within C. reinhardtii
In a previously described study, C. reinhardtii cells were vitrified, and thin lamellae containing regions of the cell interior were prepared by cryo-focused ion beam milling50,51 before imaging by cryo-electron tomography26,52. We reanalyzed these tomograms, identifying 17 coated tubular membranes in 12 tomograms. The coat on these tubes appeared distinct from previously observed COPI, COPII and clathrin coats. For 9 tubes, we could determine the morphology of the compartment they emanated from: 4 budded from multivesicular bodies, 4 from TGN compartments (rounded translucent cisternae without luminal vesicles), and 1 from a lysosome-like compartment. In tomographic slices of some of the tubes positioned perpendicular to the XY plane, we observed that the coat was formed by arch-like densities. We performed reference-free subtomogram averaging to determine the structure of the coat, essentially as described in 26, using a modified wedge mask that accounts for the amplitudes of the determined CTF and applied exposure filters at each tilt53. We extracted subtomograms from binned tomograms (pixel size 1.36 nm) normal to the tube surface with a spacing of 8 pixels (11 nm) and box size of 64 pixels. Subtomogram positions were randomized by 4 pixels along the tube axis to avoid any artefacts from periodic picking. The initial average was created and subtomograms were aligned to it with only z-axis shifts followed by 12 iterations of alignment with a soft cylindrical mask of 16 nm diameter and 37 nm height, with a lowpass filter set to 60 Å. The resulting average displayed two arches. The centermost arch was shifted to the center of the box and used as a reference for 4 additional iterations of alignment with two-fold symmetry applied. Overlapping subtomograms were removed with the distance threshold of 8 pixels (11 nm), the dataset was split in two halves from which the averages were generated. The resolution was estimated using mask-corrected FSC between these references, and was 37 Å at 0.5 cross-correlation, extending significantly beyond the 60 Å lowpass filter used during alignment.
Extended Data
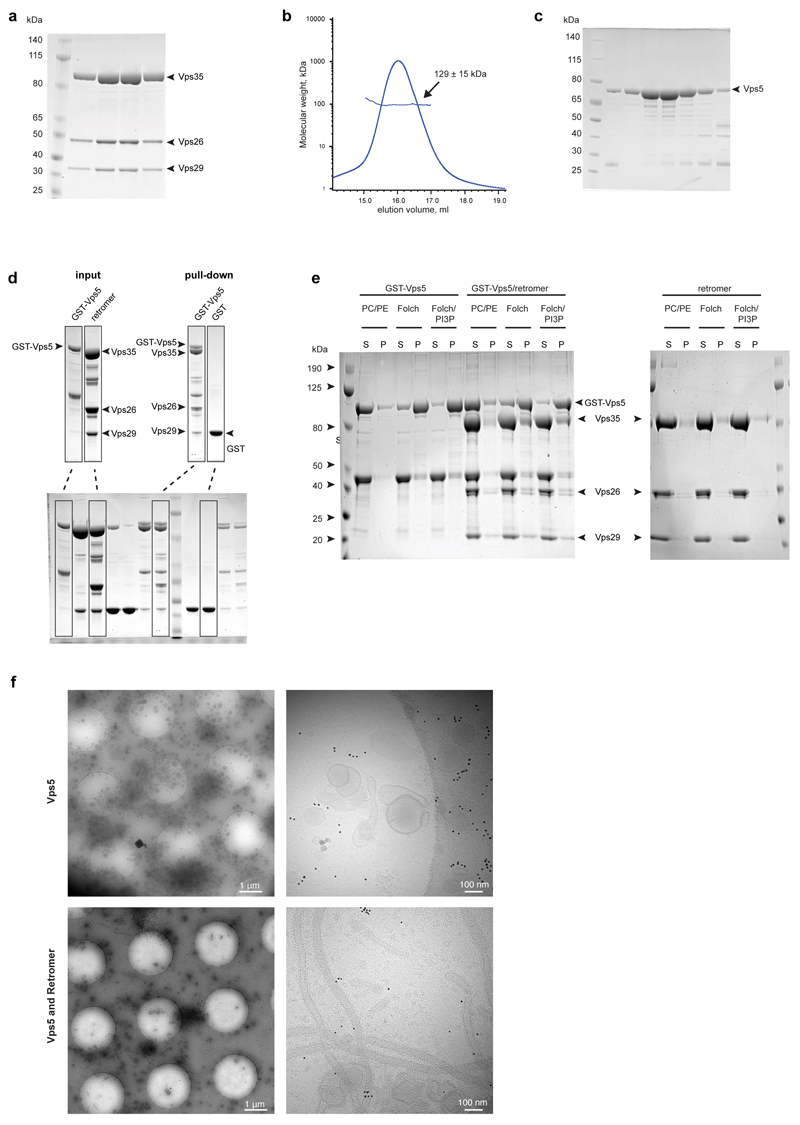
Extended Data Figure 1. The retromer-Vps5 complex in solution and binding to membranes.
(a) Retromer forms a stable complex in solution. Fractions containing retromer (Vps35, Vps26 and Vps29) after gel-filtration on a Superdex 200 column analysed by Coomassie-stained SDS-PAGE. (b) Gel-filtration profile of Vps5 and MALLS analysis of molecular weight. Mean molecular weight and standard deviation from three independent gel-filtration experiments are shown. The expected molecular weight of Vps5 monomer is 67 kDa, so the observed molecular weight of 129 kDa indicates formation of a homodimer (c). A Coomassie-stained SDS-PAGE of Vps5 fractions from b. (d) Vps5 binds to retromer in solution. SDS-PAGE of GST-Vps5 and of retromer are given in the “input” panels. Retromer was incubated with GST-tagged Vps5 or GST baits, and the resultant complex was isolated on Gluthathione Sepharose beads (“pull-down” panels). The bottom panel shows the intact PAGE gel used to extract lanes for the upper panel. (e) Retromer membrane recruitment is dependent on Vps5. GST-Vps5 alone, GST-Vps5 with retromer complex, and retromer complex alone were incubated with liposomes and pelleted to isolate the liposome-bound protein fraction. Supernatant (S) and pelleted fraction (P) were compared with Coomassie stained SDS-PAGE. PC/PE liposomes were used as a negative control. Vps5 is efficiently pelleted by Folch brain extract liposomes, and the introduction of PI3P does not increase the amount of pelleted protein. The retromer complex shows no membrane association on its own, but is recruited to Folch and Folch/PI3P membranes when it interacts with Vps5. (f) Retromer promotes tubule formation by Vps5. Characteristic cryoEM images at medium (left) and high (right) magnification of Folch liposomes incubated either with Vps5 alone (top panels) or in the presence of the retromer complex (bottom panels). Data shown in all panels are representative of at least three independent experiments.
Extended Data Figure 2. Overview of the subtomogram averaging procedure.
Stages in the subtomogram averaging procedure are shown from top to bottom. Key steps are illustrated by average volumes (grey) overlaid with the corresponding alignment mask (gold). Alignment masks are shown at 0.5 value threshold. Volumes in a-c are low-pass filtered to 50 Å. (a) The final iteration of reference-free subtomogram averaging procedure independently conducted in bin4 tomograms that were acquired at -2.5 mm (left) and -5.5 mm (right) defoci, filtered to 50 Å resolution. (b) The average of the references shown in a. (c) The volume from b was rotated to place either the apex of the arch (left) or the base of the arch (right) in the box centre, 2-fold symmetrized, and filtered to 50 Å. These two volumes were used as starting references for further alignments. (d) The references after alignment at bin8. (e) The references after alignment at bin2. After SA convergence in bin2, focused alignment was conducted on individual structural features. The final maps are shown in f1-f3 and f4-f5 for alignments focussed on the regions within the gold alignment masks.
Extended Data Figure 3. CryoET map and reconstruction resolution.
(a) Mask-corrected FSC curves for each of the final focused maps shown in Extended Data Fig. 2f. The overall resolution at the 0.143 criterion is marked. (b) Sharpened maps coloured by local resolution according to the indicated colour map determined by FSC within a moving local mask. Arrowheads indicate an unassigned density, which may correspond to a helical element in loop 305-387 of Vps35.
Extended Data Figure 4. Crystal structure of C. thermophilum Vps29, and comparison of cryoET structures with previous crystal structures.
(a) Crystal structure of C. thermophilum Vps29 (red) overlaid with the crystal structure of human Vps29 (blue)18. Crystallographic structure determination statistics are given in Extended Data Table 2. (b) The fitted Vps26 dimer model with monomers coloured in dark green and light green. The homodimeric interface is formed by β-sheet extension of two N-terminal β-sandwich domains. The positions of the docked Vps26 models suggest formation of an extended hydrophobic core between subunits. Close-up images of fitted Vps26 subunits highlight the extended hydrophobic core. (c) Surface representation of the Vps26-Vps35-Vps29 trimer mapped with binding regions for retromer effectors. Neighbouring Vps5 and retromer proteins in the assembled array are shown as ribbons. Retromer components are coloured as in Fig. 1. Lower panels show higher magnification views of the overviews in the upper panels. Binding sites observed in structural data are coloured according to colour of the corresponding label; dashed lines indicate binding regions identified in biochemical assays. The binding interfaces of human Snx27, Snx3, Snx3/Dmt1-II, Varp/TBC1d5 were modelled using coordinates with PDB accession numbers 4P2A, 5F0L and 5GTU respectively; the Dmt1-II cargo peptide is shown as a ribbon. The Snx3/Dmt1-II binding site overlaps with that of Vps5. The binding site of the Snx27 PDZ domain on Vps2610 is accessible although due to a lack of structural information on full-length Snx27 it is unclear whether this binding is simultaneously consistent with membrane binding by the Snx27 PX domains. The regulatory factors Varp and TBC1d5 share a binding interface on Vps29 that is exposed towards the outer extremity of the coat. This site in human Vps29 is also hijacked by the RidL protein from the pathogen Legionella pneumophila54,55. However, as for Snx27, full-length structures of Varp, TBC1d5 and RidL are not available so we cannot be sure how they will be arranged in the fully assembled array. Rab7 has been speculated to contribute to membrane recruitment of retromer by binding to Vps35 in the region indicated by the dashed line56,57. The deletion of this helical region (helix 6 in S. cerevisiae) resulted in loss of interaction with Ypt757 (the Rab7 homologue in yeast). It has been shown recently that retromer binding to the PX-BAR complex displaces Rab7 during formation of tubules58,59. The Vps10 “binding site” (dashed line) indicates a region where point mutations affect Vps10 recycling16, however, no biochemical interactions between Vps10 and retromer have been shown, and our efforts at detecting a physical interaction between Vps35 and the cytosolic domains of Vps10 have not shown any direct binding. (d) Snx3 and Dmt1-II (transparent yellow and dark green surfaces respectively), as bound to Vps35/Vps26 from PDB 5F0L17, overlayed with our retromer-Vps5 complex structure (ribbons, coloured as above) demonstrating a sterical clash between Vps5 BAR and Snx3 PX domains. Note that C-terminal helix of Vps5 BAR (arrowheads) clashes with the Dmt1-II cargo peptide density. Left panel shows the same view as in the panel above in C; right panel shows the model rotated by 90 degrees around the vertical axis to provide the view along the long axis of BAR domain.
Extended Data Fig 5. Global rigid body docking of Vps5, Vps26/Vps35(N) and Vps35(C)/Vps29, and adaptation of the retromer coat to different membrane curvatures.
(a-c) Fitting of structures to electron density maps was performed from 10000 random initial placements of atomic models using Chimera fit command. The cross-correlation between model and EM map, is plotted against the fraction of the structural model within the EM density threshold for: (a) Global fit of Vps5 dimer into the membrane-associated BAR domain density under the arch (map f3 in Extended Data Fig. 2); (b) Global fit of Vps26/Vps35(N) into the base of the arch (map f5 in Extended Data Fig. 2). (c) Global fit of Vps29/Vps35(C) into the apex of the arch (map f1 in Extended Data Fig. 2). Arrows indicate the high-scoring rigid body fits which were used as starting points for flexible fitting. (d, e) For a subset of ~50% of the data we calculated tube centroids by spline fitting, and determined local membrane curvature as the inverse of the distance from the subtomogram to the tube centroid. (d) Slices through averages of 20% of the subtomograms from the dataset with lowest (left) and highest (right) membrane curvature, focused on the arch (top) or Vps26-dimer (bottom). See also animation in Supplementary Video 5. (e) Distribution of membrane curvatures of retromer tubules in situ and in vitro. Lumenal diameter of each tube were measured manually from which mean and standard deviation were calculated.
Extended Data Figure 6. Comparison of yeast PX-BAR proteins Vps5 and Vps17.
(a) Overlay of the Vps5 heterodimer model after flexible fitting into the cryoET structure (blue) with the human Snx9 PX-BAR domains (beige; the bound PI3P headgroup is also shown in magenta in stick representation). The PX and BAR domains in Vps5 adopt a very similar architecture to the Snx9 protein, but there are variations in the angle between the BAR domains, and in the orientations of the lateral PX domains. The second and third α helices of the Vps5 BAR domain are also longer than in Snx9. (b) Sequence alignment of Chaetomium thermophilum (CtVps5, CtVps17) and human (hSnx1, hSnx5) PX-BARs. CtVps5 secondary structure is indicated above the sequences. Sequence alignment and its representation were prepared in MultAlign60 and ESPript 3.061. (c) Overlay of ribbon models of CtVps5 (blue) and CtVps17 (grey). CtVps17 structure was modelled using CtVps5 as a template (SWISS-MODEL).
Extended Data Figure 7. Arrangement of the retromer coat on membrane tubules by cryoET.
3D plots that visualise the relative positions of (a) neighbouring Vps26 dimers or (b) neighbouring Vps35/Vps29 arches (see supplementary information for details). The isosurface for visualization is set at 8σ. (c, d) Flattened cylindrical projections through the boxed regions in volumes a and b respectively. Blue to red gradient colouring is proportional to pixel values. The white circle shows the position of the central Vps26 dimer or arch. (e) A close-up view at the boxed region in c with arrows indicating position and the identity of neighbours corresponding to each of six nearest-neighbour relative arrangements between Vps26 dimers. (f) Bar plot of frequency occurrence of arrangements from e for 15795 analysed Vps26 dimers. The arrangements numbered 3 and 6, where Vps26 dimers are very closely packed, are less frequent than other arrangements. Models of these relative arrangements are shown in Fig. 3b, c. (g) Density maps are shown for the local retromer structure for each of the six different relative Vps26 arrangements. Numbering corresponds to arrangements shown in Fig. 3b. Maps are radially coloured in grey, blue, green and gold for the membrane, Vps5, Vps26 and Vps35/Vps29 layers respectively. (h) Overlay of density maps for arrangements 2 and 3, and 2 and 4, showing that in some arrangements, the Vps35 arch can tilt relative to the tubule to accommodate nearby arches. The average of arrangement 2 is coloured as above, while arrangement 3 and 4 averages are coloured transparent grey.
Extended Data Table 1. CryoET data collection and processing parameters.
| 1 | 2 | 3 | 4 | 5 | In cell | |
|---|---|---|---|---|---|---|
| EMDB entry | 0156 | 0157 | 0158 | 0159 | 0160 | 0161 |
| Voltage (kV) | 300 | |||||
| Detector | Gatan K2 | |||||
| Energy filter slit width (eV) | 20 | |||||
| Electron exposure (e/ Å2) | ~130 | ~100 | ||||
| Defocus range (µm) | -2.5 to -6.5 | -4.5 to -6.5 | ||||
| Tilt range (min/max, step) | -60°/+60, 3° | -60°/+60, 2° | ||||
| Tilt scheme | dose-symmetrical (Hagen scheme) | bi-directional | ||||
| Tomogram used/acquired (no.) | 71/73 | 12/60 | ||||
| Pixel size (Å) | 1.35 | 3.42 | ||||
| Tubules (no.) | 209 | 17 | ||||
| Symmetry imposed | C2 | none | C2 | C2 | C2 | C2 |
| Final subtomograms (no.) | 18680 | 37250 | 18680 | 16037 | 16037 | 553 |
| Map resolution (Å) | 8.7 | 9.1 | 9.4 | 8.9 | 8.9 | 37 |
| FSC threshold | 0.143 | 0.143 | 0.143 | 0.143 | 0.143 | 0.5 |
| Map resolution range (Å) | 7.6-22.1 | 7.5-20.8 | 7.1-19.4 | 6.7-19.5 | 7.2-19.3 | ~ |
Extended Data Table 2. X-ray crystallography data collection and refinement statistics for C. thermophilum Vps29.
*Values in parentheses are for highest-resolution shell.
| Ct Vps29 | |
|---|---|
| Data collection | |
| Space group | P21 |
| Cell dimensions | |
| a, b, c (Å) | 65.5, 106.7, 88.1 |
| α, β, γ (°) | 90, 95.5, 90 |
| Resolution (Å) | 48.8-1.52 (1.55-1.52)* |
| Rmerge | 0.094 (0.707) |
| Rmeas | 0.110 (0.0.831) |
| Rpim | 0.057 (0.431) |
| / / σ/ | 0.9 (2.1) |
| Completeness (%) | 99.8 (97.7) |
| Redundancy | 7.5 (7.2) |
| CC1/2 | 0.997 (0.681) |
| Refinement | |
| Resolution (Å) | 45.59-1.52 (1.56-1.52) |
| No. reflections/No. Rfree | 184620 (12809) / 2000 (140) |
| Rwork/Rfree | 0.155 (0.228) / 0.176 (0.246) |
| No. atoms | |
| Protein | 8939 |
| Water | 1304 |
| B-factors | |
| Protein | 22.8 |
| Water | 29.6 |
| R.m.s. deviations | |
| Bond lengths (Å) | 0.0097 |
| Bond angles (°) | 1.30 |
Extended Data Table 3. E. coli expression constructs for C. thermophilum proteins used in this study.
| Name of construct | Method of cloning | Comments/experiments |
|---|---|---|
| pGEX4T2 Vps29 | Gene was amplified from synthetic template (GenScript) and ligated using BamHI/Xhol restriction digestion sites | protein crystallization |
| pGEX4T2psp Vps29 | Introduced additional cleavage site for PreScission protease | co-expression and purification of complex |
| pET28aH6 Vps35 | Gene was amplified from synthetic template (GenScript) and ligated using Ncol/Xhol restriction digestion sites, His-tag introduced with amplification primers | co-expression and purification of complex |
| pET28aH6 Vps26 | Gene was amplified from synthetic template (GenScript) and ligated using Ncol/Xhol, His-tag introduced with amplification primers | co-expression and purification of complex |
| pGEX4T2 Vps5 | Gene was amplified from synthetic template (GenScript) and ligated using BamHI/Xhol | liposome pelleting |
| pRSFDuetH6 Vps5 | Gene was amplified from synthetic template (GenScript), cloned into MCS1, Ncol | dimerization, complex purification. |
Supplementary Material
Acknowledgements
We acknowledge support from the University of Queensland Remote Operation Crystallisation Facility, the Centre for Microscopy and Microanalysis (CMM), and the Australian Synchrotron. We thank Suzanne Norwood for assistance and discussion, Jürgen Plitzko and Wolfgang Baumeister for enabling in situ cryoET, and Wim Hagen for supporting data collection. Work in BMCs lab was supported by the Australian Research Council (DP160101743) and National Health and Medical Research Council (NHMRC) (APP1042082; APP1058734). MS and BJE were supported by the Max-Planck Society. RDT and BMC are supported by NHMRC Senior Research Fellowships (APP1041929; APP1136021). NL and DJO are supported by WT grant 207455/Z/17/Z. JAGB, YB and OK were supported by the European Molecular Biology Laboratory (EMBL) and the Medical Research Council (MC_UP_1201/16).
Footnotes
Data availability statement
CryoET structures and representative tomograms are deposited in the Electron Microscopy Data Bank (EMDB) under accession codes EMD-0154, EMD-0155, EMD-0156, EMD-0157, EMD-0158, EMD-0159, EMD-0160, EMD-0161, EMD-0162 and EMD-0163, and the molecular model in the protein data bank (PDB) under accession 6H7W. Coordinates and structure factors for Vps29 are in the PDB under accession 5W8M, with raw data available at espace.library.uq.edu.au/view/UQ:682629. Gel source data can be found in Supplementary Figure 1.
Author contributions
OK, NL, RDT, DJO, JAGB and BMC designed the project. OK performed cryoET, tomogram reconstruction, subtomogram averaging and model building with assistance from JAGB. OK and NL performed EM sample preparation and screening. NL performed biochemical characterisation and protein preparation, crystal structure determination and assisted with tomogram reconstruction. NA assisted NL with preliminary EM sample screening. YSB performed image analysis for in situ cryoET. MS and BDE performed in situ cryoET. OK, NL, JAGB and BMC prepared the manuscript with input from all authors in the final version.
Author Information
Reprints and permissions information is available at www.nature.com/reprints.
The authors declare that they have no competing financial interests
References
- 1.Burd C, Cullen PJ. Retromer: a master conductor of endosome sorting. Cold Spring Harbor perspectives in biology. 2014;6 doi: 10.1101/cshperspect.a016774. [DOI] [PMC free article] [PubMed] [Google Scholar]
- 2.Seaman MN. The retromer complex - endosomal protein recycling and beyond. Journal of cell science. 2012;125:4693–4702. doi: 10.1242/jcs.103440. [DOI] [PMC free article] [PubMed] [Google Scholar]
- 3.Trousdale C, Kim K. Retromer: Structure, function, and roles in mammalian disease. European journal of cell biology. 2015;94:513–521. doi: 10.1016/j.ejcb.2015.07.002. [DOI] [PubMed] [Google Scholar]
- 4.McMillan KJ, Korswagen HC, Cullen PJ. The emerging role of retromer in neuroprotection. Current opinion in cell biology. 2017;47:72–82. doi: 10.1016/j.ceb.2017.02.004. [DOI] [PMC free article] [PubMed] [Google Scholar]
- 5.Small SA, Petsko GA. Retromer in Alzheimer disease, Parkinson disease and other neurological disorders. Nature reviews. Neuroscience. 2015;16:126–132. doi: 10.1038/nrn3896. [DOI] [PubMed] [Google Scholar]
- 6.Vilarino-Guell C, et al. VPS35 mutations in Parkinson disease. American journal of human genetics. 2011;89:162–167. doi: 10.1016/j.ajhg.2011.06.001. [DOI] [PMC free article] [PubMed] [Google Scholar]
- 7.Zimprich A, et al. A mutation in VPS35, encoding a subunit of the retromer complex, causes late-onset Parkinson disease. American journal of human genetics. 2011;89:168–175. doi: 10.1016/j.ajhg.2011.06.008. [DOI] [PMC free article] [PubMed] [Google Scholar]
- 8.Feng S, et al. The Sorting Nexin 3 Retromer Pathway Regulates the Cell Surface Localization and Activity of a Wnt-Activated Polycystin Channel Complex. J Am Soc Nephrol. 2017;28:2973–2984. doi: 10.1681/ASN.2016121349. [DOI] [PMC free article] [PubMed] [Google Scholar]
- 9.Bean BD, Davey M, Conibear E. Cargo selectivity of yeast sorting nexins. Traffic. 2017;18:110–122. doi: 10.1111/tra.12459. [DOI] [PubMed] [Google Scholar]
- 10.Gallon M, et al. A unique PDZ domain and arrestin-like fold interaction reveals mechanistic details of endocytic recycling by SNX27-retromer. Proceedings of the National Academy of Sciences of the United States of America. 2014;111:E3604–3613. doi: 10.1073/pnas.1410552111. [DOI] [PMC free article] [PubMed] [Google Scholar]
- 11.Zhang P, Wu Y, Belenkaya TY, Lin X. SNX3 controls Wingless/Wnt secretion through regulating retromer-dependent recycling of Wntless. Cell Res. 2011;21:1677–1690. doi: 10.1038/cr.2011.167. [DOI] [PMC free article] [PubMed] [Google Scholar]
- 12.Harterink M, et al. A SNX3-dependent retromer pathway mediates retrograde transport of the Wnt sorting receptor Wntless and is required for Wnt secretion. Nature cell biology. 2011;13:914–923. doi: 10.1038/ncb2281. [DOI] [PMC free article] [PubMed] [Google Scholar]
- 13.Mim C, et al. Structural basis of membrane bending by the N-BAR protein endophilin. Cell. 2012;149:137–145. doi: 10.1016/j.cell.2012.01.048. [DOI] [PMC free article] [PubMed] [Google Scholar]
- 14.Pylypenko O, Lundmark R, Rasmuson E, Carlsson SR, Rak A. The PX-BAR membrane-remodeling unit of sorting nexin 9. The EMBO journal. 2007;26:4788–4800. doi: 10.1038/sj.emboj.7601889. [DOI] [PMC free article] [PubMed] [Google Scholar]
- 15.Seaman MN, McCaffery JM, Emr SD. A membrane coat complex essential for endosome-to-Golgi retrograde transport in yeast. J Cell Biol. 1998;142:665–681. doi: 10.1083/jcb.142.3.665. [DOI] [PMC free article] [PubMed] [Google Scholar]
- 16.Nothwehr SF, Bruinsma P, Strawn LA. Distinct domains within Vps35p mediate the retrieval of two different cargo proteins from the yeast prevacuolar/endosomal compartment. Mol Biol Cell. 1999;10:875–890. doi: 10.1091/mbc.10.4.875. [DOI] [PMC free article] [PubMed] [Google Scholar]
- 17.Lucas M, et al. Structural Mechanism for Cargo Recognition by the Retromer Complex. Cell. 2016;167:1623–1635 e1614. doi: 10.1016/j.cell.2016.10.056. [DOI] [PMC free article] [PubMed] [Google Scholar]
- 18.Hierro A, et al. Functional architecture of the retromer cargo-recognition complex. Nature. 2007;449:1063–1067. doi: 10.1038/nature06216. [DOI] [PMC free article] [PubMed] [Google Scholar]
- 19.Norwood SJ, et al. Assembly and solution structure of the core retromer protein complex. Traffic. 2011;12:56–71. doi: 10.1111/j.1600-0854.2010.01124.x. [DOI] [PubMed] [Google Scholar]
- 20.Frost A, et al. Structural basis of membrane invagination by F-BAR domains. Cell. 2008;132:807–817. doi: 10.1016/j.cell.2007.12.041. [DOI] [PMC free article] [PubMed] [Google Scholar]
- 21.Kvainickas A, et al. Cargo-selective SNX-BAR proteins mediate retromer trimer independent retrograde transport. J Cell Biol. 2017 doi: 10.1083/jcb.201702137. [DOI] [PMC free article] [PubMed] [Google Scholar]
- 22.Simonetti B, Danson CM, Heesom KJ, Cullen PJ. Sequence-dependent cargo recognition by SNX-BARs mediates retromer-independent transport of CI-MPR. J Cell Biol. 2017 doi: 10.1083/jcb.201703015. [DOI] [PMC free article] [PubMed] [Google Scholar]
- 23.Jia D, et al. Structural and mechanistic insights into regulation of the retromer coat by TBC1d5. Nature communications. 2016;7 doi: 10.1038/ncomms13305. 13305. [DOI] [PMC free article] [PubMed] [Google Scholar]
- 24.Hesketh GG, et al. VARP is recruited on to endosomes by direct interaction with retromer, where together they function in export to the cell surface. Developmental cell. 2014;29:591–606. doi: 10.1016/j.devcel.2014.04.010. [DOI] [PMC free article] [PubMed] [Google Scholar]
- 25.Dodonova SO, et al. 9A structure of the COPI coat reveals that the Arf1 GTPase occupies two contrasting molecular environments. Elife. 2017;6 doi: 10.7554/eLife.26691. [DOI] [PMC free article] [PubMed] [Google Scholar]
- 26.Bykov YS, et al. The structure of the COPI coat determined within the cell. Elife. 2017;6 doi: 10.7554/eLife.32493. [DOI] [PMC free article] [PubMed] [Google Scholar]
- 27.Adam J, Basnet N, Mizuno N. Structural insights into the cooperative remodeling of membranes by amphiphysin/BIN1. Scientific reports. 2015;5 doi: 10.1038/srep15452. 15452. [DOI] [PMC free article] [PubMed] [Google Scholar]
- 28.Daum B, et al. Supramolecular organization of the human N-BAR domain in shaping the sarcolemma membrane. Journal of structural biology. 2016;194:375–382. doi: 10.1016/j.jsb.2016.03.017. [DOI] [PubMed] [Google Scholar]
- 29.Dodonova SO, et al. VESICULAR TRANSPORT. A structure of the COPI coat and the role of coat proteins in membrane vesicle assembly. Science. 2015;349:195–198. doi: 10.1126/science.aab1121. [DOI] [PubMed] [Google Scholar]
- 30.Battye TG, Kontogiannis L, Johnson O, Powell HR, Leslie AG. iMOSFLM: a new graphical interface for diffraction-image processing with MOSFLM. Acta crystallographica. Section D, Biological crystallography. 2011;67:271–281. doi: 10.1107/S0907444910048675. [DOI] [PMC free article] [PubMed] [Google Scholar]
- 31.Evans P. Scaling and assessment of data quality. Acta crystallographica. Section D, Biological crystallography. 2006;62:72–82. doi: 10.1107/S0907444905036693. [DOI] [PubMed] [Google Scholar]
- 32.McCoy AJ, et al. Phaser crystallographic software. J Appl Crystallogr. 2007;40:658–674. doi: 10.1107/S0021889807021206. [DOI] [PMC free article] [PubMed] [Google Scholar]
- 33.Emsley P, Lohkamp B, Scott WG, Cowtan K. Features and development of Coot. Acta crystallographica. Section D, Biological crystallography. 2010;66:486–501. doi: 10.1107/S0907444910007493. [DOI] [PMC free article] [PubMed] [Google Scholar]
- 34.Adams PD, et al. PHENIX: a comprehensive Python-based system for macromolecular structure solution. Acta crystallographica. Section D, Biological crystallography. 2010;66:213–221. doi: 10.1107/S0907444909052925. [DOI] [PMC free article] [PubMed] [Google Scholar]
- 35.Mastronarde DN. Automated electron microscope tomography using robust prediction of specimen movements. Journal of structural biology. 2005;152:36–51. doi: 10.1016/j.jsb.2005.07.007. [DOI] [PubMed] [Google Scholar]
- 36.Hagen WJ, Wan W, Briggs JA. Implementation of a cryo-electron tomography tilt-scheme optimized for high resolution subtomogram averaging. Journal of structural biology. 2017;197:191–198. doi: 10.1016/j.jsb.2016.06.007. [DOI] [PMC free article] [PubMed] [Google Scholar]
- 37.Grant T, Grigorieff N. Measuring the optimal exposure for single particle cryo-EM using a 2.6 A reconstruction of rotavirus VP6. Elife. 2015;4:e06980. doi: 10.7554/eLife.06980. [DOI] [PMC free article] [PubMed] [Google Scholar]
- 38.Kremer JR, Mastronarde DN, McIntosh JR. Computer visualization of three-dimensional image data using IMOD. Journal of structural biology. 1996;116:71–76. doi: 10.1006/jsbi.1996.0013. [DOI] [PubMed] [Google Scholar]
- 39.Xiong Q, Morphew MK, Schwartz CL, Hoenger AH, Mastronarde DN. CTF determination and correction for low dose tomographic tilt series. Journal of structural biology. 2009;168:378–387. doi: 10.1016/j.jsb.2009.08.016. [DOI] [PMC free article] [PubMed] [Google Scholar]
- 40.Rohou A, Grigorieff N. CTFFIND4: Fast and accurate defocus estimation from electron micrographs. Journal of structural biology. 2015;192:216–221. doi: 10.1016/j.jsb.2015.08.008. [DOI] [PMC free article] [PubMed] [Google Scholar]
- 41.Forster F, Medalia O, Zauberman N, Baumeister W, Fass D. Retrovirus envelope protein complex structure in situ studied by cryo-electron tomography. Proceedings of the National Academy of Sciences of the United States of America. 2005;102:4729–4734. doi: 10.1073/pnas.0409178102. [DOI] [PMC free article] [PubMed] [Google Scholar]
- 42.Nickell S, et al. TOM software toolbox: acquisition and analysis for electron tomography. Journal of structural biology. 2005;149:227–234. doi: 10.1016/j.jsb.2004.10.006. [DOI] [PubMed] [Google Scholar]
- 43.Castano-Diez D, Kudryashev M, Arheit M, Stahlberg H. Dynamo: a flexible, user-friendly development tool for subtomogram averaging of cryo-EM data in high-performance computing environments. Journal of structural biology. 2012;178:139–151. doi: 10.1016/j.jsb.2011.12.017. [DOI] [PubMed] [Google Scholar]
- 44.Schur FK, et al. An atomic model of HIV-1 capsid-SP1 reveals structures regulating assembly and maturation. Science. 2016;353:506–508. doi: 10.1126/science.aaf9620. [DOI] [PubMed] [Google Scholar]
- 45.Trabuco LG, Villa E, Mitra K, Frank J, Schulten K. Flexible fitting of atomic structures into electron microscopy maps using molecular dynamics. Structure. 2008;16:673–683. doi: 10.1016/j.str.2008.03.005. [DOI] [PMC free article] [PubMed] [Google Scholar]
- 46.Yang J, et al. The I-TASSER Suite: protein structure and function prediction. Nature methods. 2015;12:7–8. doi: 10.1038/nmeth.3213. [DOI] [PMC free article] [PubMed] [Google Scholar]
- 47.Biasini M, et al. SWISS-MODEL: modelling protein tertiary and quaternary structure using evolutionary information. Nucleic acids research. 2014;42:W252–258. doi: 10.1093/nar/gku340. [DOI] [PMC free article] [PubMed] [Google Scholar]
- 48.Pettersen EF, et al. UCSF Chimera--a visualization system for exploratory research and analysis. Journal of computational chemistry. 2004;25:1605–1612. doi: 10.1002/jcc.20084. [DOI] [PubMed] [Google Scholar]
- 49.Goddard TD, et al. UCSF ChimeraX: Meeting modern challenges in visualization and analysis. Protein Sci. 2017 doi: 10.1002/pro.3235. [DOI] [PMC free article] [PubMed] [Google Scholar]
- 50.Schaffer M, et al. Cryo-focused Ion Beam Sample Preparation for Imaging Vitreous Cells by Cryo-electron Tomography. Bio Protoc. 2015;5 doi: 10.21769/bioprotoc.1575. [DOI] [PMC free article] [PubMed] [Google Scholar]
- 51.Schaffer M, et al. Optimized cryo-focused ion beam sample preparation aimed at in situ structural studies of membrane proteins. Journal of structural biology. 2017;197:73–82. doi: 10.1016/j.jsb.2016.07.010. [DOI] [PubMed] [Google Scholar]
- 52.Albert S, et al. Proteasomes tether to two distinct sites at the nuclear pore complex. Proceedings of the National Academy of Sciences of the United States of America. 2017;114:13726–13731. doi: 10.1073/pnas.1716305114. [DOI] [PMC free article] [PubMed] [Google Scholar]
- 53.Wan W, et al. Structure and assembly of the Ebola virus nucleocapsid. Nature. 2017;551:394–397. doi: 10.1038/nature24490. [DOI] [PMC free article] [PubMed] [Google Scholar]
- 54.Barlocher K, et al. Structural insights into Legionella RidL-Vps29 retromer subunit interaction reveal displacement of the regulator TBC1D5. Nature communications. 2017;8 doi: 10.1038/s41467-017-01512-5. 1543. [DOI] [PMC free article] [PubMed] [Google Scholar]
- 55.Romano-Moreno M, et al. Molecular mechanism for the subversion of the retromer coat by the Legionella effector RidL. Proceedings of the National Academy of Sciences of the United States of America. 2017;114:E11151–E11160. doi: 10.1073/pnas.1715361115. [DOI] [PMC free article] [PubMed] [Google Scholar]
- 56.Harrison MS, et al. A mechanism for retromer endosomal coat complex assembly with cargo. Proceedings of the National Academy of Sciences of the United States of America. 2014;111:267–272. doi: 10.1073/pnas.1316482111. [DOI] [PMC free article] [PubMed] [Google Scholar]
- 57.Liu TT, Gomez TS, Sackey BK, Billadeau DD, Burd CG. Rab GTPase regulation of retromer-mediated cargo export during endosome maturation. Mol Biol Cell. 2012;23:2505–2515. doi: 10.1091/mbc.E11-11-0915. [DOI] [PMC free article] [PubMed] [Google Scholar]
- 58.Purushothaman LK, Arlt H, Kuhlee A, Raunser S, Ungermann C. Retromer-driven membrane tubulation separates endosomal recycling from Rab7/Ypt7-dependent fusion. Mol Biol Cell. 2017;28:783–791. doi: 10.1091/mbc.E16-08-0582. [DOI] [PMC free article] [PubMed] [Google Scholar]
- 59.Arlt H, Reggiori F, Ungermann C. Retromer and the dynamin Vps1 cooperate in the retrieval of transmembrane proteins from vacuoles. Journal of cell science. 2015;128:645–655. doi: 10.1242/jcs.132720. [DOI] [PubMed] [Google Scholar]
- 60.Corpet F. Multiple sequence alignment with hierarchical clustering. Nucleic acids research. 1988;16:10881–10890. doi: 10.1093/nar/16.22.10881. [DOI] [PMC free article] [PubMed] [Google Scholar]
- 61.Robert X, Gouet P. Deciphering key features in protein structures with the new ENDscript server. Nucleic acids research. 2014;42:W320–324. doi: 10.1093/nar/gku316. [DOI] [PMC free article] [PubMed] [Google Scholar]
Associated Data
This section collects any data citations, data availability statements, or supplementary materials included in this article.


