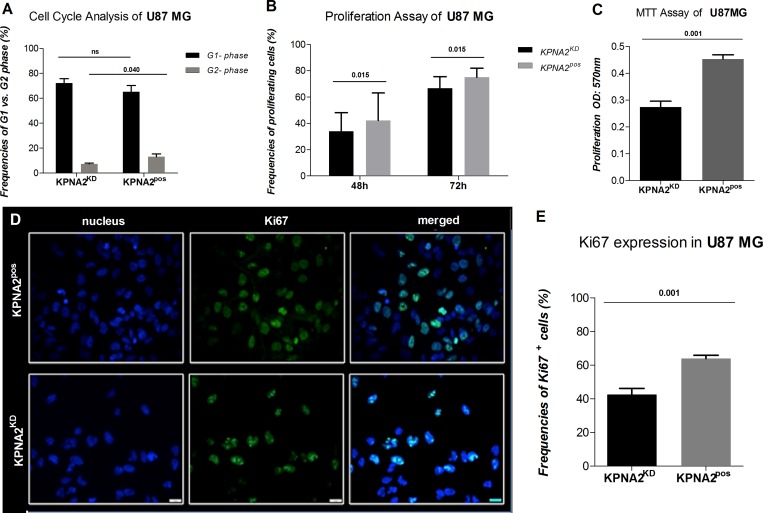
Figure 2. Silencing of KPNA2 is associated with cell-cycle phase arrest and decreased proliferation capacity of the cell line U87 MG.
(A) Cell Cycle analysis via flow cytometry displays a significant reduction of the cells detected in the G2-phase in the KPNA2KD cells in comparison to KPNA2pos (p = 0.040). Results are presented as frequencies of cells in the distinct phases of the cell cycle. (B) Proliferation of KPNA2KD vs. KPNA2pos cells is considerably inhibited after 48 h (p = 0.015) and 72 h (p = 0.015) of proliferation. Assays are performed with the CFSE-proliferation dye and analysed via flow cytometry (BD Calibur). (C) Proliferation of KPNA2KD vs. KPNA2pos cells is considerably inhibited after 48 h (p < 0.001) of proliferation. Assays are performed by the MTT-Assay (Roche) and analysed via BioTek ELISA-Reader. (D) Ki67 expression determined by intracellular immunofluorescence staining shows a significant reduction in expression levels after silencing of KPNA2. Nuclear staining was performed with DAPI. Ki67 (BD monoclonal MIB-1 antibody) with green fluorescence displays different proliferation states of the individual cells. Knockdown of KPNA2 reduces expression levels and alters the expression pattern of Ki67 in the siRNA treated cells. (E) Quantification of Ki67 expression displays meaningful reduction (p = 0.001) in the KPNA2KD cells in comparison to the KPNA2pos cells.

