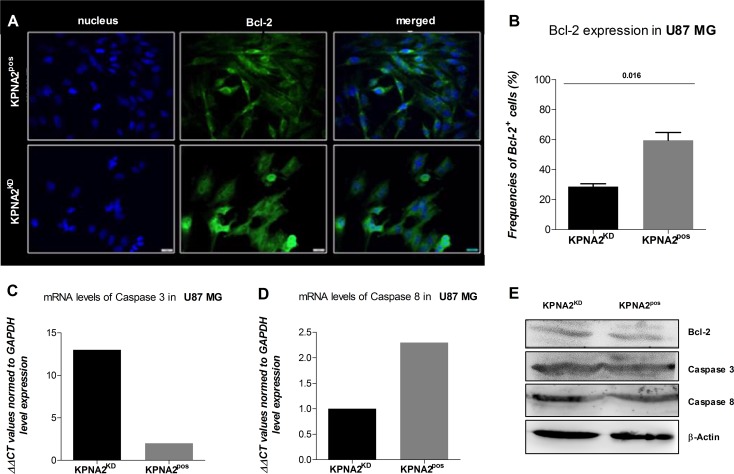
Figure 3. KPNA2 expression maintains survival and morphology of the GBM cell line U87 MG.
(A) The silencing of KPNA2 with siRNA interference alters the cell morphology of the U87 MG cells by reducing the filopodia of the affected cells. Bcl-2 expression (green) is expressed in KPNA2KD vs. KPNA2pos in significantly lower amounts based on relative expression of total cell counts, but different distribution patterns. While in the negative control the Bcl-2 molecules are detected closely and organized in the cell-body in close proximity to the nucleus, expression of Bcl-2 in the KPNA2KD cells is diffuse and scattered. (B) Quantification of Bcl-2 expression displays a significant reduction (p = 0.016) in the KPNA2KD cells in comparison to the KPNA2pos cells. (C and D) Relative mRNA expression of caspase 3 and caspase 8 via quantitative Real-Time PCR reveals an up-regulation of the effector caspase 3 in the KPNA2KD cells in comparison to the KPNA2pos ones and a down-regulation of the initiator caspase 8 in the former. (E) The survival protein Bcl-2 and the apoptotic proteins caspase 3 and 8 were determined via western blot. Hereby, total protein is displayed with the normalizing loading control β-actin. No cleaved forms of either caspase 3 or caspase 8 were detected in KPNA2pos nor in KPNA2KD cells.

