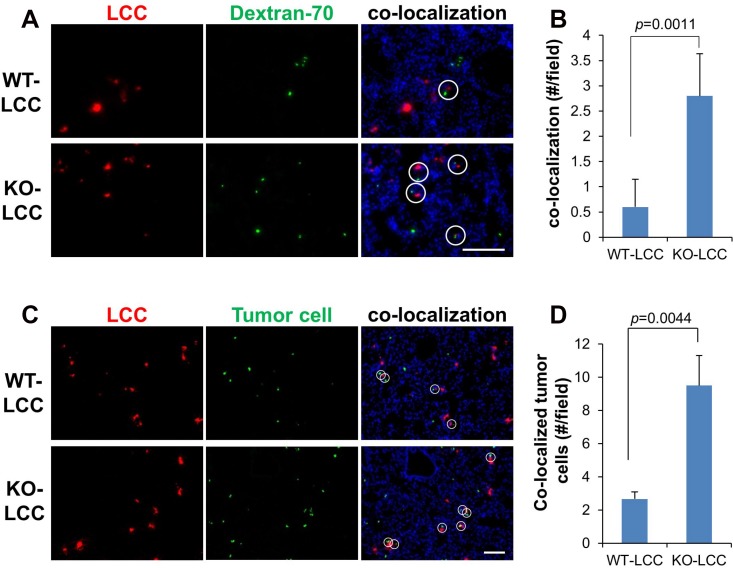
Figure 3. KO lung fibroblasts and melanoma cells home to foci of vascular leakiness in the lung.
Fluorescent lung images of the WT- or KO-LCC pre-labeled with Cell Tracker-Red 6 h after i.v. co-injection with FITC-dextran-70 (green) (A) or Cell Tracker-Green-labeled B16F10-luc (C), to monitor sites of vascular leakage. Nuclei (blue) were identified by DAPI staining. White circles, co-localization of fibroblasts with dextran-70 foci. Mean of fibroblast/dextran-70 (B) or fibroblast/tumor (D) co-localization per microscopic field. Error bars, SEM of 6 independent microscopic fields/lung for three lungs.

