Abstract
Multi-energy computed tomography (CT) is an emerging medical image modality with a number of potential applications in diagnosis and therapy. However, high system cost and technical barriers obstruct its step into routine clinical practice. In this study, we propose a framework to realize multi-energy cone beam CT (ME-CBCT) on the CBCT system that is widely available and has been routinely used for radiotherapy image guidance. In our method, a kVp switching technique is realized, which acquires x-ray projections with kVp levels cycling through a number of values. For this kVp-switching based ME-CBCT acquisition, x-ray projections of each energy channel are only a subset of all the acquired projections. This leads to an undersampling issue, posing challenges to the reconstruction problem. We propose a spatial spectral non-local means (ssNLM) method to reconstruct ME-CBCT, which employs image correlations along both spatial and spectral directions to suppress noisy and streak artifacts. To address the intensity scale difference at different energy channels, a histogram matching method is incorporated. Our method is different from conventionally used NLM methods in that spectral dimension is included, which helps to effectively remove streak artifacts appearing at different directions in images with different energy channels. Convergence analysis of our algorithm is provided. A comprehensive set of simulation and real experimental studies demonstrate feasibility of our ME-CBCT scheme and the capability of achieving superior image quality compared to conventional filtered backprojection-type (FBP) and NLM reconstruction methods.
Keywords: multi-energy cone-beam CT, reconstruction, spatial spectral non-local means
1. Introduction.
Computed tomography (CT) is the most widely used imaging modality in medicine [55, 26]. In a CT scan, an x-ray tube continuously rotates around a patient and emits x-ray. A detector measures the attenuated x-ray signal, after the x-ray travels through the patient body. For an energy-integrated detector, the measured signal s(de, E) at a detector element de can be expressed as [27]
| (1) |
where μ(x;E) is the x-ray attenuation coefficient of the patient at position x and energy E. I0 is the x-ray source intenstiy and ψ(E) is the x-ray beam spectrum, typically polychromatic. The second integral is along a straight line Lde connecting the x-ray source and the detector element. CT reconstruction refers to the problem of determining the image μ based on measurements s.
It is highly desirable to restore μ(x, E), namely dependence of the x-ray attenuation coefficients on both spatial coordinate and energy. Yet, due to the energy integration of the detector, recovering energy dependence is practically challenging. Standard approach is to ignore the energy dependence of μ and only reconstruct the attenuation coefficient as a function of x[27]. For a given energy spetrum ψ(E), it has been shown that the image reconstructed as such approximately corresponds to x-ray attenuation at an effective energy Eeff[37]. The forward model can be hence written in a simpler form of
| (2) |
or equivalently,
| (3) |
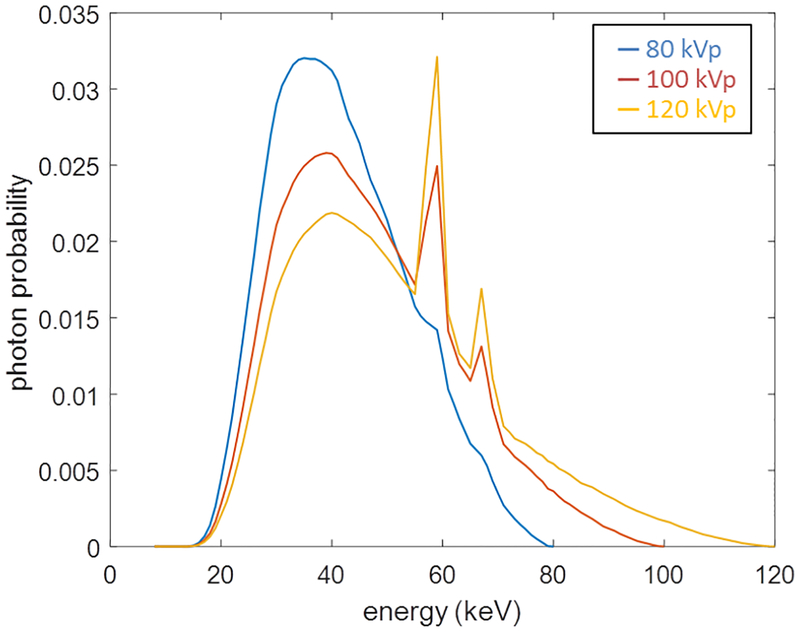
The effective energy Eeff depends on the x-ray spectrum ψ(E). For an x-ray spectrum, it is conventionally named by its highest (peak) energy. Fig. 1 presents three spectra with the highest energy of 80, 100, and 120 keV, which are hence termed as 80, 100, and 120 kVp, respectively. Here the letter p standards for peak energy. When acquiring data under different kVp values in a scan, we can explicitly label the forward model with an index i of the kVp:
| (4) |
Here the x-ray attenuation coefficient is also associated with the index i, as Eeff is kVp-dependent. Inverting this model allows the reconstruction of multiple images μi(x), each under a specific spectrum i, or kVp value. This method of varying the kVp value is one way to achieve multi-energy CT (MECT)[19, 28]. Note that each image obtained as such does not truly represent x-ray attenuation at a specific energy value, but approximately at an effective energy of a spectrum. Hence, the images are in fact multi-kVp CT. However, it is the convention to still call these images as multi-energy CT. Following this convention, in the rest of this paper, we will use the terms kVp and energy interchangeably.
Fig. 1.
Three typical x-ray spectra at 80, 100, and 120 kVp.
Because of the remarkable capability of imaging both spatial (anatomical) information and spectral property of an object, MECT has demonstrated its tremendous potential value in diagnosis and therapy [4, 50, 36]. Compared to the spatial in formation offered by a single-kVp CT, the additional information along the spectral dimension in MECT enables better delineation of patient tissue properties such as electron density and effective atomic number[36, 29]. Over the years, this fact has spurred a great range of new applications. For diagnosis, MECT has been success fully applied for virtual non-contrast enhanced imaging [34], virtual monoenergetic imaging [41], automated bone and plaque removal [53], and urinary stone delineation [42]. Applications for radiotherapy are also attractive. The x-ray attenuation coefficients under different kVp channels permit better tissue composition calculation than conventional CT. This directly translates into enhanced accuracy of radiation dose calculation for both conventional photon therapy[4, 21] and advanced particle therapy [58, 49, 29].
1.1. Motivation and contributions.
High system cost and several technical barriers [50] obstruct the step of MECT imaging into clinical practice. A natural thought for an alternative approach to achieve MECT would be to scan an object multiple times with different kVp levels. Yet increased scan time and x-ray radiation dose prevent this from clinical applications. In cancer radiotherapy field, cone beam CT (CBCT) is currently the most widely used imaging modality. At the moment, CBCT is primarily used for patient setup purpose. Prior to a treatment, CBCT is employed to acquire patient anatomy. The patient is then positioned such that the tumor is accurately aligned with the therapeutic beam. Given the wide availability of this CBCT hardware in many hospitals, the first objective of this paper is to realize ME-CBCT function on the conventional CBCT platform. Specifically, we will employ a kVp switching scheme to acquire x-ray projections with different kVp levels in a single rotation. Our approach will potentially open a door to realize energy-resolved CT images in a cost-effective manner.
Apart from the engineering challenges to acquire projection data for ME-CBCT, its reconstruction problem also requires special attention. Under the kVp switching scheme, all the projections are distributed into different energy channels, yielding an angular undersampling problem in each energy channel. The reduced number of projections causes severe streak artifacts, if a conventional FBP-type algorithms [17] is used for reconstruction. Hence, an advanced reconstruction algorithm is needed. Recently, non-local means (NLM) type of methods [6, 5, 7, 32, 24, 3] have shown their effectiveness in noise and artifacts reduction in a spectrum of problems, including CT reconstruction. Ma et al. [33] utilized a normal-dose scan as prior information with NLM method to restore low-dose CT images. Tian et al. [51] applied a temporal NLM method on 4D-CT reconstruction by exploring the spatial similarity and temporal correlation among different image phases. Jia et al. [24] developed a novel computational techniques on graphics processing unit (GPU) to overcome the computational burden when extending this method to CBCT. Zhang et al. [61, 62] used the NLM-based regularization for statistical image reconstruction to reconstruct low-dose CT images from low mAs acquisitions. Li et al. [30] proposed a hybrid NLM regularization model with penalized weighted least-squares algorithm for CT perfusion. While these studies demonstrated the efficacy of NLM-type methods for noise reduction by utilizing redundant image information in spatial domain, a simple extension to the ME-CBCT reconstruction problem to process each energy channel individually is not suitable. In fact, NLM-type algorithm is known to be capable of preserving edge features. When it is applied to our ME-CBCT problem, the strong streak artifacts induced by angular undersampling projections would be retained. However, since the streak artifacts are along directions of x-ray projections, which are different among images at different energy channels, we propose to extend the NLM algorithm to include the spectral dimension. The spatial spectral non-local means (ssNLM) method is potentially capable of delivering high-quality ME-CBCT images.
One challenge when extending the NLM method to the spectral domain is ac curate cross-comparison of images with different intensity scales. Since images to be reconstructed represent x-ray attenuation coefficients at different effective energies, they have distinct image intensities. Yet the ssNLM approach requires comparing these images to identify similar features. To solve this problem, we also propose to employ a tissue-specific histogram matching scheme to equalize image intensities.
1.2. Outline of the paper.
The rest of this paper is organized as follows. Section 2 will first present our ME-CBCT data acquisition method. We will then briefly review the conventional NLM method. After that, we will introduce the proposed ssNLM algorithm. We will present derivations of the algorithm, a mathematical analysis on its convergence property, and details of our implementation. Section 3 will be devoted to the presentation of our comprehensive tests in both simulation and experimental studies. Finally, discussion and conclusions will follow in section 4 and section 5, respectively.
2. Method.
2.1. Multi-energy Cone beam CT and data acquisition.
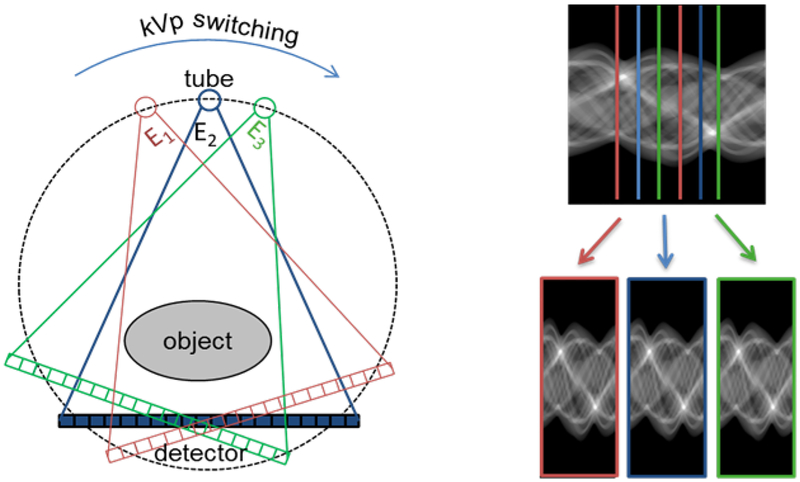
We employed a kVp-switching scheme as our ME-CBCT acquisition method. Specifically, for ME CBCT with N energy channels, the kVp level of the x-ray tube was controlled to loop sequentially through these channels, one per projection. This yielded a set of projections that contain N subsets corresponding to different energy channels. For each channel, the projections were acquired at a number of angles that were separated by a certain angular gap. Projection angles in different energy channels were different. Fig. 2 shows an example of a tri-energy ME-CBCT data acquisition. The whole dataset consists of 360 projections acquired with 1° angular increment. For the three energy subsets, each subset has 120 projections with an angular increment of 3°.
Fig. 2.
Illustration of a tri-energy kVp-switching ME-CBCT system (left) wtih the projection data divided into three subsets (right).
2.2. Non-local means method in CT reconstruction problem.
Mathematically, after discretizing the forward model in Eq. (4), a CT system can be ex-pressed as a linear model Ax = y, where denotes the system matrix, is the desired images of attenuation coefficients to be reconstructed and is the measured projection data. m, n are the numbers of projection pixels and image voxels, respectively. In a typical CBCT data acquisition, m is usually larger than n (See for example the settings in the evaluation cases in Section 3). Hence the system matrix A is often over-determined. In reality, since the projection data y is always contaminated by noise, reconstruction of x can be achieved by solving the following constrained least square problem:
| (5) |
To further suppress noise and artifacts while preserving edges, an additional regularization term is typically included in the objective function. Several regularization functionals have been proposed to reduce noise while enhancing edges, such as total variation (TV) [2, 20, 23, 52, 8] and tight frame (TF) [11, 10, 22, 15, 9]. Non-local means (NLM) [48, 32, 24, 14, 59] is another approach that can effectively remove noise and artifacts while preserving structures. Its main idea is to incorporate useful information among similar voxels by applying the so-called NLM filter, which can be expressed as:
| (6) |
where es is a canonical unit vector with its s-th element being 1 and all others being 0. extracts the t-th voxel of an image and relocates it non-locally to the s-th voxel. The weight is obtained by evaluating similarity between the s-th and the t-th voxel in a reference image x*, i.e.
| (7) |
denotes Euclidean distance weighted by a Gaussian kernel whose standard deviation is σ > 0. xs denotes the s-th voxel in x, and h controls the similarity level and usually corresponds to the noise level. is a patch generator that extracts a local patch centered in the voxel . Ws is a patch generator that . With x* as a guidance to reconstruction, the weights w* should contain closely related similarity property, as the desired images x does.
Note that (7) is not directly applicable to the reconstruction problem, because a reference image x* for weight construction is not readily available before solving the reconstructed by solving only the least square problem in (5) to estimate the weights. One step further, one can iteratively apply NLM filter, i.e. x(k+1) = NL(x(k)) until the steady state, where x = NL(x), is achieved. This allows to update weights using the latest available image x(k) at iteration step k[39, 1, 64, 31, 59]:
| (8) |
Recently, a flexible plug-and-play framework has been proposed to integrate state-of-the-art regularization terms with data fidelity terms [54, 43, 38, 12]. This leads to the variational form for the NLM regularization
| (9) |
Where .
2.3. Spatial spectral non-local means method.
In our ME-CBCT system, the kVp switching scheme reduced the number of projections in each energy channel to 1/N of that in a conventional CBCT scan, where N is the number of energy channels. This led to difficulty in CBCT reconstruction, as the reduced number of projections would cause severe streak artifacts. However, if the conventional NLM algorithm were applied to process image of each energy, the streak artifacts would remain, because the artifacts appeared as straight edges and would be identified as true image structures due to the edge-preserving nature of the NLM method [60, 13]. To overcome this problem, we propose to process the images at all energy channels simultaneously, using not only the information along the spatial direction, but also along the spectral direction. In fact, the projection angles of different energy levels are distinct, and hence the streak artifacts exist with different directions. Therefore, it is expected that, when the NLM method is extended to including the spectral direction, the streak artifacts would not be incorrectly considered as a true structure and hence, they will be suppressed by the reconstruction algorithm.
2.3.1. Reconstruction Algorithm.
Let us define a CBCT image of the i-th energy channel, as a column vector and its corresponding projection data where energy channel is i = 1,…,N and mi = m/N is the projection number of i-th energy channel. The system matrix depends on the energy channel and is denoted as . Similar to the variational form of the conventional NLM method in Eq. (9), a variational model of the ssNLM method can be expressed as:
| (10) |
Where JssNLM (X) is
| (11) |
characterizes the similarity between the s-th voxel in the i-th energy channel and the t-th voxel in the j-th energy channel. Gi,j maps the intensity level of the reference CBCT images at the j-th channels to that of i-th energy channel. The purpose of introducing this mapping is to overcome the difficulty that CBCT images at different channels have different intensity scales. The choice of the weighting factor and mapping function gi,j will be described in the following two subsections.
The optimal solution of (10) should guarantee that the gradient of objective function equals to zero:
| (12) |
where . Then to obtain the optimal solution , we consider the implicit gradient descent method with nonnegative projection to iteratively update intermediate image according to
with the iteration index k and the step size of 1/λ. One more difficulty is that the reference images are not available for the reconstruction problem. To overcome this, we propose to replace with the latest solution available during iteration, namely . By simply moving all the terms related to to the left hand side of the equation, the implicit gradient descent formula can be represented as:
| (13) |
In is the identity matrix with its size of n × n. To simplify the presentation, we define the ssNLM filter
| (14) |
and an intermediate variable
| (15) |
We are able to summarize an iterative algorithm with three major steps as following. The first step is an image regularization step using the ssNLM filter. Images from the last iteration contain noise and streak artifacts. The regularization step aims at removing noise and suppressing the artifacts, i.e. update the image by summing the weighted non-local information from spatial direction (within itself) and spectral direction (across all the for j ≠ i). Specifically,
| (16) |
In the second step, the image of each channel Xi is updated based on the regularized image with its own projection matrix Ai and the measured projection data Yi to enforce fidelity of the solution.
| (17) |
This linear problem is solved using a CG algorithm. The third step enforces the non-negative constraint in order to obtain a physically meaningful solution of x-ray attenuation coefficients:
| (18) |
Note that α and λ are two parameters that control the contribution of regularization and step size of gradient descent respectively. In our implementation, we focus more on regularization parameter which might affect the final results significantly. We are able to show with any α ∈ [0,1], setting λ correspondingly guarantees convergence of the algorithm. More specifically, let , if we simplify the parameter setup by considering λ = β * α, the proposed algorithm converges (to be discussed in detailed in section 2.3.4) and can be summarized as
| (19) |
| (20) |
| (21) |
2.3.2. Weight Computation.
The weights family characterizes similarity between the s-th voxel fn the i-th energy channel and the t-th voxel of the j-th energy channel as
where Ws,I is a normalization factor that enforces . For each voxel to be reconstructed, those voxels with similar spatial structure would be assigned to larger weights by the Gaussian function, such that the structures will be reinforced in (19). Similar to the discussion in the above subsection, the weight here should be constructed using the reference image X*. The aforementioned alternative approach using the intermediate solution for weight estimation can be applied in practice.
2.3.3. Histogram matching.
Inspired by [45, 35], we assume a linear relationship between the attenuation coefficients xi and xj of the same material but at different energy channels, expressed as xi = ai,j xj + bi,j where ai,j and bi,j are parameters to be estimated. Moreover, it is expected that the linear relationship depends on specific human tissue type.
In order to scale the intensity of images at different energy levels, we first segmented the spatial domain into Nυ subregions Ωυ, υ = 1,…,Nυ, representing Nυ types of tissues. We then performed estimations on the region-specific parameters for any two images at different energy channels. As such, to map ME-CBCT images X* at j-th energy channel to i-th energy channel, a histogram matching method was applied to seek for and such that and have similar intensity histograms. Let us define , then the mapped image voxel for . Since there are only two parameters to be estimated based on two histograms, we tried to match the first and the second moments of the two histograms [65], yielding
where σ (·) gives the standard deviation and is the mean value. Note that the histogram matching should be performed on reference image X*. However, similar to the problem in weight construction, the reference image is not readily known before reconstruction process. Alternatively, the scaling parameters were calculated based on the latest solution images in each iteration. In practice, the CBCT images were segmented into air, soft tissue, and bone tissue regions and we performed aforementioned matching for different tissues. A threshold segmentation method was employed for simplicity.
2.3.4. Convergence analysis.
We prove that the proposed algorithm converges when the weights and intensity correction coefficients are fixed. To ease the presentation, we first express the algorithm in a concise form. Assume we have in total N energy channels, our goal is to reconstruct a set of images simultaneously based on ME-CBCT acquired projection data . Furthermore, let
| (22) |
denotes the projection matrix for all spectral channels, which is a diagonal block matrix with its size m × nN.
With this notation, we can rewrite the algorithm of Eqs. (19), (20) and (21) to a concise form as
| (23) |
| (24) |
| (25) |
Here, where . p,q give indices combining spatial and spectral directions. We can compute their corresponding spectral channels and and their spatial indexes s(p) = p − (i − 1)n and t(q) = q − (j − 1)n. Let us simplify the notation i(p), j(q), s(p), t(q) as I, j, s, t, respectively. The weights in (23) are identical to in (14). Further let . 1 We are ready to present our main theorem of convergence.
Theorem 1. The proposed algorithm presented in (23), (24) and (25) converges, if the smallest eigenvalue of ATA is larger than or equal to .
Proof. Let us define , , and . Combining (23), (24) and (25) gives
It is easy to see that
and hence
where p (·) is the spectral radius.
It is our goal to show that , which implies that the algorithm converges due to Banach fixed-point theorem. For this purpose, we analyze the spectral radius of two matrices H and Ψ.
For the matrix H, for any unit vector i:e: uT u = 1, we have
where W is a matrix of the weights family and . According to Perron Frobenius theorem, the following inequality holds true,
| (26) |
and hence
| (27) |
As for the spectral radius of Ψ under the assumption that the smallest eigenvalue of matrix ATA is larger than or equal to , it is straightforward to show that
| (28) |
By combining the two estimates (27) and (28), we have
which completes the proof.
Remark.
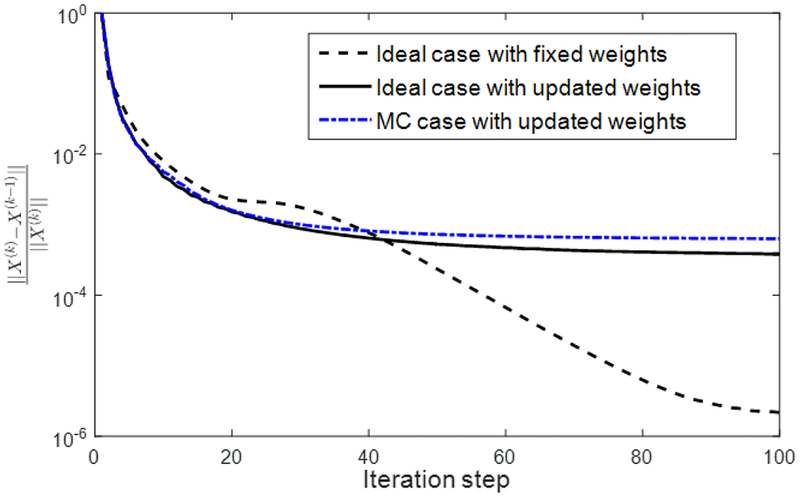
As we mention in subsection 2.2, the weight for NLM-type method is usually computed on a reference image, which should be as close as possible to the true image, so that they share the same structures. However, the reference image is not available beforehand for the reconstruction problem. Alternatively, We calculate the weights based on the reconstructed image and then regularize the image by assuming that the weights are fixed. We also discuss the computation of scaling parameters , in subsection 2.3.3, which are performed on-the-y using the current image estimate. Similar to the convergence discussion in Chan et al. [12], we provided a fixed point convergence analysis of our algorithm instead of its global one. We prove that our algorithm converges for a fixed set of weights and scaling parameters. Although no proof of global convergence has been established, we numerically demonstrate in Figure 3 that the proposed algorithm with updating weights and scaling parameters seems also converge, but at a slower rate.
Fig. 3.
Convergence curves of the ideal case with fixed weights, the ideal case and the MC case with updated weights.
2.3.5. Implementation.
One drawback of the ssNLM reconstruction algorithm is its high computational burden, especially in the weight construction step. To boost the computation efficiency, we implemented the algorithm on CUDA programing environment using an NVIDIA GeForce GTX Titan GPU card. This GPU card has 2880 processor cores, each with a clock speed of 0.9 GHz. It is also equipped with 6 GB memory, shared by all processor cores. Utilizing such a GPU card with tremendous parallel computing ability can considerably elevate the computation efficiency of our algorithm.
Specifically, in the iteration step of Eq. (24), the system matrix A is actually a forward projection calculation, which can be easily computed by a ray-tracing method. AT is a backward projection operation, which can be computed in a efficient parallel fashion [23]. Multiple threads of the GPU card can compute projections of a large number of rays or image of a massive number voxels simultaneously. Hence high efficiency can be achieved.
In the weights construction step, a cubic patch (or similarity window) D(Xp) centering at the voxel Xp is compared with patches centering at all other voxel Xq to calculate the weighting factor wp,q. In practice, the voxels that are similar to Xp will locate mainly in its neighboring voxels in both spatial and spectral domain. Therefore, it is adequate to search for the similar voxels only within a search window instead of searching over the entire image. Moreover, the 3D Gaussian kernel based convolution can be conducted by sequentially performing three 1D convolution in three dimensional direction respectively. This also can extremely ease the computation burden [24]. As the weights family can be parallel-computed, quite high efficiency is expected given the massive parallelization ability of the GPU card.
3. Validation studies.
To validate the proposed ME-CBCT and the ssNLM reconstruction method, we conducted comprehensive tests including both simulation studies and experimental studies.
3.1. Simulation study.
We first performed simulation study to test the ME CBCT reconstruction using the ssNLM algorithm. We generated projection data of a numerical NCAT phantom [46] by using Siddon ray-tracing method [47]. This was referred as an ideal case, where noise and x-ray scattering typically existing in practical situations were not considered in simulation. We then moved onto a more realistic one (referred as MC case) with both of the two issues considered. A Monte-Carlo (MC) code package [25] was employed to generate the x-ray projection data. In these two studies, three polychromatic spectra of 80,100 and 120 kVp were considered, which were generated by a x-ray spectrum generator software Spekcalc [40]. To mimic a kVp-switching scan, 120 projections for each energy channel were considered, which were generated by a x-ray spectrum generator software Spekcalc [40]. To mimic a kVp-switching scan, 120 projections for each energy channel were simulated with interleaved sampling angle 3°. The generated projection data were input to our reconstruction methods. The detector resolution was 512×384 and pixel size is 0.078×0.078 cm2, while image resolution was 512×512×70 and pixel size was 0.049 × 0.049 × 0.2 cm3.
We performed ME-CBCT reconstructions using three methods: conventional FBP method [17], conventional NLM method that only considers spatial similarity[6], and our proposed ssNLM method. A common ramp filter was used in FBP method. For the two NLM type methods, a trail-and-error strategy was employed for parameter selection. For the weight calculation, a patch size of similarity window was 5×5×5, and the size of search window was 9×9×9. For a non-local type method, the search window should be large enough to bring sufficient information at different places for the purpose of enhancing image quality. However, a large search window would inevitably prolong computation. We chose a relatively small size of search window for the consideration of computational efficiency. We found that such a choice was sufficient to ensure a satisfactory image quality at affordable computation time, and further enlarging the window size did not improve image quality significantly. The controlling factor h was manually selected and β was chosen to 1 throughout the paper. For the threshold segmentation in histogram matching step, 0.10 and 0.30 cm−1 were empirically chosen to separate lung, soft and bony tissues. All the parameters are tuned for optimal image visualization while remain identical within conventional NLM and ssNLM methods.
For evaluation purpose, it is desired to compare these reconstruction results with ground truth images. Yet, there is in fact no such a ground truth due to the polychromatic nature of the x-ray. The simulation takes inputs of x-ray attenuation μ(x, E) at each voxel and the polychromatic x-ray spectra, and computes projection data via Eq. (1) using either ray-tracing or MC method. The reconstructed image indeed corresponds to x-ray attenuation coefficients at an effective energy Eeff. However, there is no simple relationship between Eeff and the beam spectrum. In fact, it is the other way around: Eeff is defined to be such an energy value, at which the reconstructed image approximately equals to μ(x,Eeff). Therefore, although there is the ground truth of x-ray attenuation μ(x,E) used in simulation, there is no ground-truth such that the reconstructed image is expected to be identical in the best scenario. To circumvent this issue, we simulated 1440 projections uniformly placed in a 360° angular range for each energy channel, and then used the conventional FBP method to reconstruct the ME-CBCT images. The FBP method is the standard reconstruction approach in current clinic. With a large number of projections, the resulting image is expected to be free of artifacts and is probably the best image that can be achieved clinically. Hence, it was considered as the ground truth to evaluate our reconstruction algorithm.
3.1.1. Convergence.
To investigate the convergence behavior of our algorithm, we first performed reconstruction but with weights fixed to the values estimated using the ground truth images. The relative change of the solution ‖X(k) −X(k−1)‖/‖X(k)‖ between two successive steps is plotted in Fig. 3. In this case, the relative change continuously decreased to machine precision of ~ 10−6, demonstrating the convergence property of our algorithm under fixed weights. Note that we used single-precision float point numbers, as it is better supported by GPU than double precision numbers. In reality, the weights have to be estimated during the iterative process. The convergence behaviors for the ideal case and the MC case are plotted in Fig. 3. It was observed that the weight estimation slows down the convergence. After 100 iteration steps, the relative differences were small and the curves appeared to have a small descending trend. This indicates that the algorithm with updated weights may con verge but with a much slower rate than with the fixed weights. In addition, it could be expected that the curves may show jumps, whenever the weights are recomputed. However, since we updated the weights at every iteration step, the jump behavior may become unobvious.
3.1.2. Ideal case.
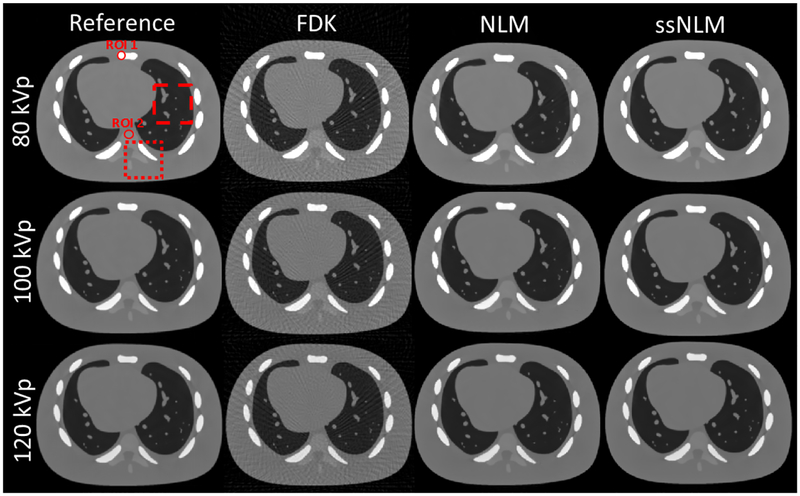
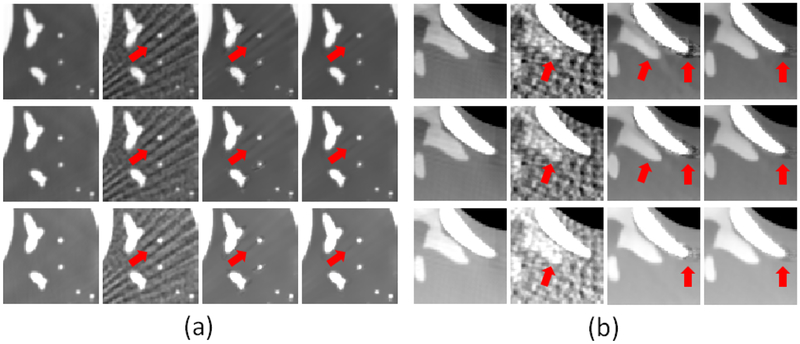
In Fig. 4, the FBP results contain severe artifacts due to undersampled projections. Although noise was remarkably removed by the NLM method, streak artifacts still appeared. A lung and a bone region, which contain abundant detailed anatommical features, were selected to demonstrate image quality improvement. They are shown in the zoom-in views in Fig. 5. As indicated by the arrows, lung region was heavily degraded by noise and streak artifacts, and it was di cult to distinguish the spines from noisy artifacts in FBP results. In NLM results, there still remained some streak artifacts in lung image, while some spiky and shaded artifacts were observed in bone image. In contrast, artifacts has been significantly reduced in reconstructed images by ssNLM, which illustrated the benefits of incorporating both spatial and spectral correlation.
Fig. 4.
From left to right: ground truth images, images reconstructed by FBP, NLM and ssNLM methods, respectively. The display window is [0.0 0.5] cm−1. The dash square indicates a lung region and the dot square a bone region. Two ROIs are selected representing dense bone and spine, respectively.
Fig. 5.
Zoom-in figures of (a)A lung region and (b)a bone region of interest, as indicated in Fig. 4, respectively. The display windows of lung region are [0, 0.25], [0, 0.20] and [0, 0.15] cm−1 for 80, 100 and 120 kVp, respectively. The display windows of bone region are [0.20, 0.30], [0.18,0.28] and [0.15, 0.25] cm−1 for 80, 100 and 120 kVp, respectively.
For quantitative analysis, the results were evaluated in terms of root-mean-square error (RMSE), structural similarity (SSIM) and feature similarity (FSIM) index [57, 63]. SSIM and FSIM have been widely used in image quality assessment, as they can represent human visual perception. The higher values of SSIM and FSIM are, the better the image quality is. Values of unity in SSIM and FSIM mean that images of evaluated and reference one are perfectly matched. We computed the three quality metrics for the lung and bone regions of interest, which are illustrated in Fig. 5. In Table. 1, it showed that ssNLM achieved the greatest SSIM and FSIM values, while yielding the smallest RMSE in all the energy channels. The results indicated that our proposed ssNLM method can accurately reconstruct ME-CBCT images with noisy artifacts suppression.
Table 1.
RMSE, SSIM, FSIM and CNR comparison between conventional FBP, NLM and ssNLM methods in the ideal case.
| Region | Lung | Bone | ROI 1 | ROI 2 | |||||
|---|---|---|---|---|---|---|---|---|---|
| Energy | Method | FSIM | FSIM | CNR | |||||
| 80 kVp | FBP | 0.726 | 0.868 | 2.2 | 26.7 | ||||
| NLM | 0.956 | 0.979 | 9.7 | 61.1 | |||||
| ssNLM | 0.987 | 0.992 | 13.4 | 110.7 | |||||
| 100 kVp | FBP | 0.753 | 0.867 | 2.6 | 25.3 | ||||
| NLM | 0.971 | 0.982 | 13.6 | 111.8 | |||||
| ssNLM | 0.989 | 0.994 | 14.9 | 114.6 | |||||
| 120 kVp | FBP | 0.769 | 0.866 | 2.8 | 24.3 | ||||
| NLM | 0.977 | 0.988 | 15.8 | 109.3 | |||||
| ssNLM | 0.989 | 0.995 | 15.9 | 118.9 | |||||
Contrast-to-noise ratio (CNR) was also used as an evaluation metric, which is another critical index for physician’s diagnosis purpose. It can be calculated by , where is the mean value of region-of-interest (ROI), is the mean value of the background and σbg is its standard deviation. Two ROIs were selected (shown in Fig. 4) in order to perform CNR evaluation. Generally, CNR values were approximately 15 and 115 in low and high contrast region respectively, for ssNLM method. In contrast, conventional FBP method and NLM method yielded the CNR values of 3 and 14 in low contrast region, 25 and 100 in high contrast region (Table. 1). Especially in 80 kVp channel, CNRs in the ssNLM method were more than 4 times higher than FBP and 40% higher than NLM method.
3.1.3. MC case.
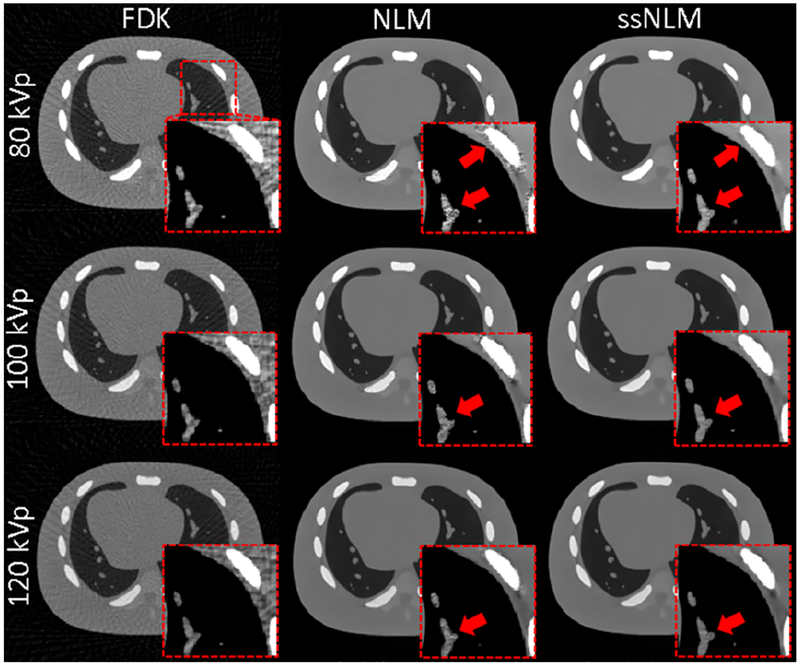
Projections generated by the MC method were contaminated with scattering and noisy signal. We evaluated our results using the same strategy as in the previous case. Through visual inspection (Fig 6), the FBP results contain severe noise and streak artifacts. Although the conventional NLM suppressed noise and artifacts in the homogeneous region to a large degree, noticeable artifacts still remained in the edge areas of bone or lung nodules, as indicated in the zoom-in image patches. The ssNLM effectively removed these noise and artifacts while preserving fine structures.
Fig. 6.
From left to right: images reconstructed by FBP, NLM and ssNLM methods, respectively. The display window is [0.0 0.5] cm−1. The dash square in the first subfigure indicates location of zoomed-in view. ROIs to measure CNR are same as those in Fig 4.
The ssNLM method also had the best overall image quality in terms of quantitative evaluation. To be concrete, ssNLM yielded as high as 0.98 of SSIM and FSIM, while RMSE value was as low as 3.56 (Table. 2). For CNR comparison, ssNLM results were about 2 times higher than FBP in images of all energy channels, and 50% times higher than NLM method in image of 80 kVp. It was observed that images of 80 kVp always had worse image quality than that of higher energy reconstructed by FBP and NLM methods. In contrast, the ssNLM method improved the images quality through the whole energy channels, especially in the 80 kVp energy channel.
Table 2.
RMSE, SSIM, FSIM and CNR comparison between conventional FBP, NLM and ssNLM methods in the MC case.
| Region | Lung | Bone | ROI 1 | ROI 2 | |||||
|---|---|---|---|---|---|---|---|---|---|
| Energy | Method | FSIM | FSIM | CNR | |||||
| 80 kVp | FBP | 0.656 | 0.765 | 1.2 | 20.4 | ||||
| NLM | 0.924 | 0.897 | 3.7 | 27.2 | |||||
| ssNLM | 0.969 | 0.966 | 5.5 | 56.4 | |||||
| 100 kVp | FBP | 0.695 | 0.814 | 1.8 | 19.8 | ||||
| NLM | 0.957 | 0.943 | 6.5 | 54.6 | |||||
| ssNLM | 0.973 | 0.972 | 6.7 | 61.1 | |||||
| 120 kVp | FBP | 0.723 | 0.804 | 2.1 | 20.8 | ||||
| NLM | 0.963 | 0.961 | 6.6 | 65.0 | |||||
| ssNLM | 0.974 | 0.974 | 6.9 | 65.1 | |||||
3.2. Experimental study.
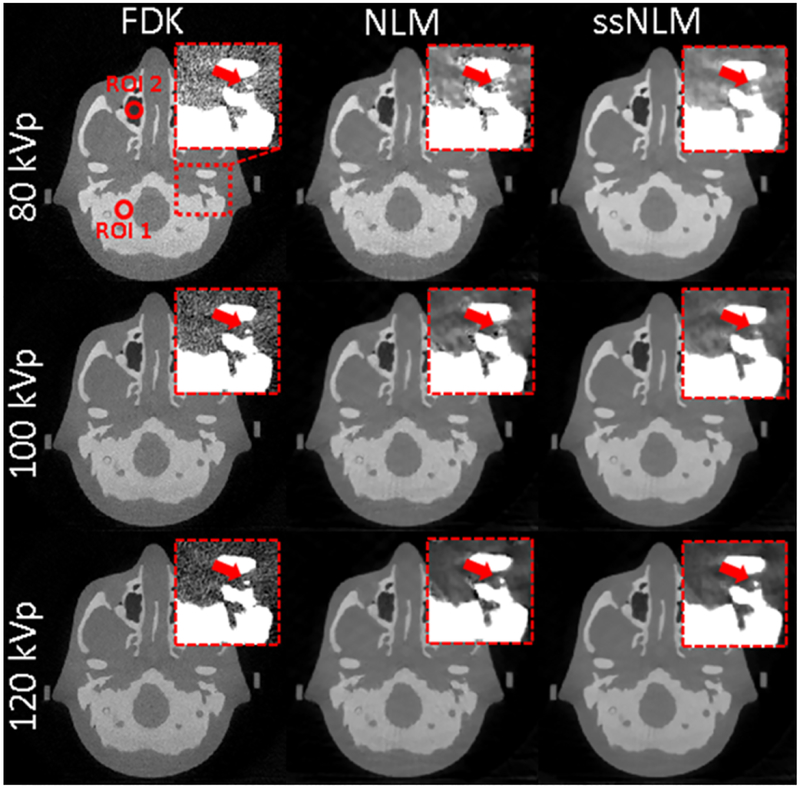
We also performed an experimental study to test the feasibility of ME-CBCT on a conventional CBCT platform, as well as the effectiveness of our ssNLM method. As such, we conducted experiments using a commercial Varian (Varian Medical System, Palo Alto, CA) TrueBeam on-board CBCT system, with three commonly used phantoms: a Catphan 600 phantom (The Phantom Laboratory, Inc., Salem, NY), a Gammex RMI phantom (Gammex, Middleton, WI), and an anthropomorphic head phantom. Energy levels were chosen to be 80,100 and 120 kVp, and tube mAs were 1.4, 0.8 and 0.5 per view to make the noise level roughly similar. In a full 360° gantry rotation, we acquired 360 projections with angular increment of 1°. Hence, the projection dataset consists of 3 subsets with 120 projections for each energy level. The source-to-axis distance was 100 cm and the source-to-detector distance was 150 cm.
3.2.1. Catphan phantom.
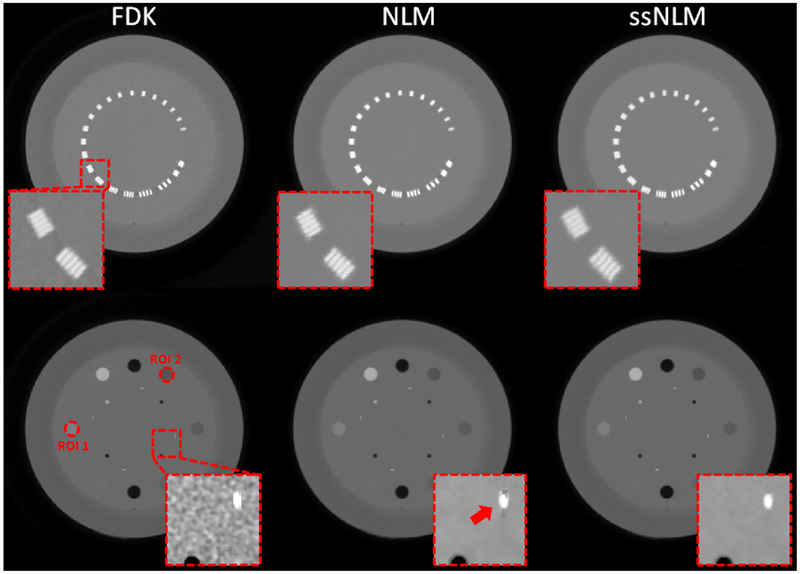
Catphan 600 phantom is commonly used for quantitative image quality evaluation. In this experiment, we tested the spatial and contrast resolution with line pair slice and contrast rod slice, respectively. As shown in Fig. 7, all the three methods achieved a spatial resolution of 8-th line pairs, which demonstrates that the two NLM methods can preserve spatial resolution while removing noise. To quantitatively evaluate contrast performance, we selected two contrast rods with a slightly lower and higher intensity compared with water-like background, and then measured their CNRs. In Table. 3, it was found that the CNR of approximately 60 for ssNLM were substantially higher than 10 and 50 for FBP and conventional NLM method, respectively.
Fig. 7.
Images of 80 kVp reconstructed by FBP, NLM and ssNLM methods, respectively. The display window is [0 0.5] cm−1. Red dash squares indicate location of the zoomed-in images. The left and right zoomed-in images’ display window are [0 0.5] and [0.18 0.25] cm−1, respectively. Red arrow shows residual artifacts in the image reconstructed by NLM. Two ROIs are extracted from the contrast rods indicated by the dash circles.
Table 3.
CNR comparison of three phantom images reconstructed by FBP, NLM and ssNLM methods, respectively.
| Phantom | ROI 1 | ROI 2 | |||||
|---|---|---|---|---|---|---|---|
| ssNLM | ssNLM | ||||||
| Catphan | 80 kVp | 59.4 | 60.0 | ||||
| 100 kVp | 66.2 | 64.6 | |||||
| 120 kVp | 59.5 | 65.4 | |||||
| Gammex | 80 kVp | 135.4 | 30.7 | ||||
| 100 kVp | 139.0 | 28.5 | |||||
| 120 kVp | 123.3 | 34.4 | |||||
| Head | 80 kVp | 43.6 | 66.8 | ||||
| 100 kVp | 46.4 | 65.0 | |||||
| 120 kVp | 39.7 | 33.5 | |||||
3.2.2. Gammex phantom.
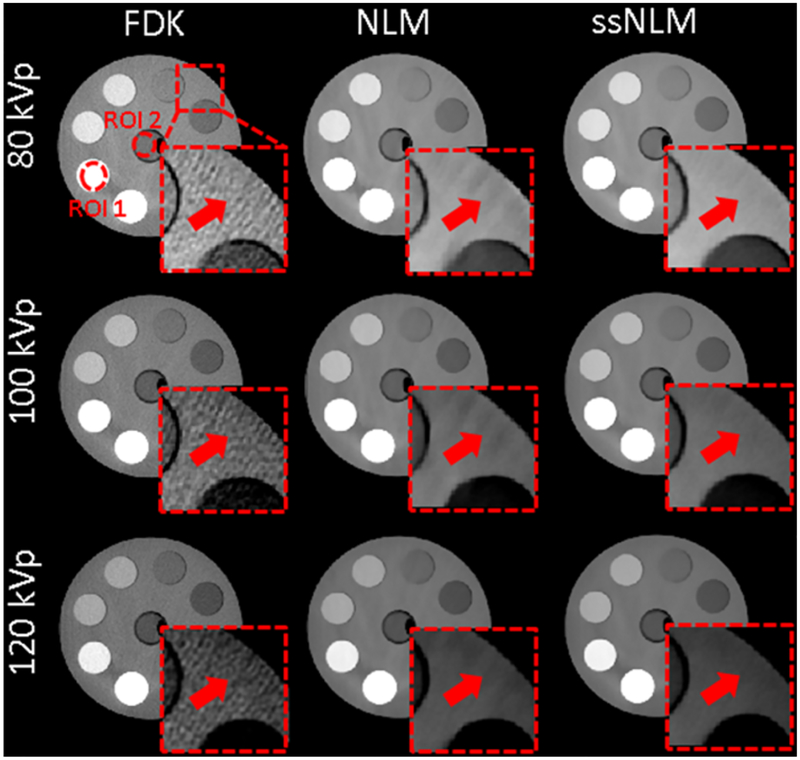
Gammex phantom is a cylinder phantom with a number of cylindrical inserts containing different materials. They are all tissue-equivalent materials to evaluate CBCT imaging quality in terms of performance in real human tissues. In the images reconstructed by NLM method, there still existed streak artifacts although most noise had been removed. In contrast, our proposed ssNLM method could suppress these artifacts by incorporating spectral correlation of images in different energy channels, as indicated by red arrows in Fig. 8. To quantitatively evaluate the reconstruction results, CNR was measured in two ROIs and summarized in Table. 3. For ssNLM method, CNR were more than 4 times higher than FBP method and around 40% higher than NLM method.
Fig. 8.
From left to right: images reconstructed by FBP, NLM and ssNLM methods, respectively. The display window is [0.15 0.3] cm−1. A red dash square indicates location of the zoomed-in images. The zoomed-in images’ display window is [0.2 0.25] cm−1. Two ROIs are selected as indicated by dash circles.
3.2.3. Anthropomorphic head phantom.
Finally, we used an anthropomorphic head phantom study to test the performance of our system in a clinically realistic context. Generally, our ssNLM method can preserve the fine structure while effectively removing noise and artifacts. In contrast, conventional NLM method reduced noise and artifacts to some extents compared to FBP method, but some fine structure were degraded by residual artifact and hard to distinguish (zoomed-in views in Fig. 9). CNR measurement showed that ssNLM method were more than 3 times higher than FBP and around 90% higher than conventional NLM method. These clearly demonstrated validated ssNLM method could achieve high-quality images by removing noisy artifacts and preserving structure, and outperform the conventional methods in clinical practice.
Fig. 9.
From left to right: images reconstructed by FBP, NLM and ssNLM methods, respectively. The display window is [0 0.5] cm−1. A red dash square indicates location of the zoomed-in images. The zoomed-in images’ display window is [0.18 0.28] cm−1. Two red circles indicates the selected ROI of low-density and high-density regions for CNR measurement.
4. Discussions.
4.1. Histogram matching.
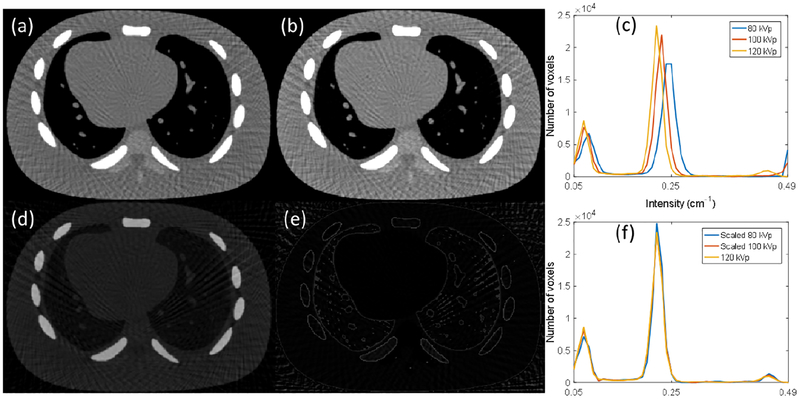
The histogram matching is an important step for the success of our algorithm, as it enables mapping of image intensities between different energy channels to allow cross-comparison of images for quality improvement. In our study, a simple linear relationship between image intensities at different channels were assumed. The parameters in this mapping were estimated using intermediate images during reconstruction. To demonstrate the validity, we chose two intermediate images of 80 and 120 kVp, and then performed histogram matching to map 80 kVp image to 120 kVp image. As shown in Fig. 10, the difference between the images of 80 kVp and 120 kVp is significant, especially in the bone region. Through histogram matching, the intensities of images are closer to each other. Comparing histograms before and after the matching step also demonstrates the necessity and effectiveness of histogram matching.
Fig. 10.
(a) and (b) are intermediate images of 120 kVp and 80 kVp, respectively. The display window is [0.1 0.4] cm−1. (d) and (e) are difference images between the two images before and after histogram matching. The display window is [0.0 0.2] cm−1. (c) and (f) are histograms of three energies before and after histogram matching, respectively.
The mapping parameters are expected to be independent of specific experiment, as they map x-ray attenuation coefficients of a material between different energy levels. Hence, an alternative approach to determine these parameters is to perform a calibration study. Specifically, we could scan a tissue material under the energy channels of interest. After reconstructing images, a histogram matching step will yield parameters that relate image intensity between different channels for this tissue material.
4.2. Parameter selection.
Proper selection of parameters is a crucial task to achieve superior image quality for all iterative reconstruction algorithms. In the proposed algorithm, β is a major parameter controlling the balance between data fidelity and image regularization, and h controls the similarity between neighboring images (both spatial and spectral domain). In our work, an trial-and-error strategy was utilized to select optimal parameters. However, in real clinical practice, all the parameters should be pre-determined or adaptively adjusted on-the-fly. Several strategies have been investigated [16, 18, 56, 44] for optimal parameter selection based on projection or image property. A deep insights into adaptive parameter selection for our approach may be a topic for future work.
4.3. Clinical applications.
The proposed approach was developed with the aim of accurately reconstructing ME-CBCT images based on the cost-efficient kVp-switching scanning protocol. We expect incorporating the ME-CBCT imaging into applications in radiotherapy. For instance, our approach can be utilized to estimate stopping-power ratio (SPR) for proton treatment planning, as several studies have proven multi-energy CT imaging is more accurate in SPR prediction than single-energy CT [58, 49]. A future work will be performed for this application. Another application could be improving accuracy in MC-based dose calculation for photon treatment planning. It is well known that dose calculation is sensitive to the accuracy of tissue compositions. While multi-energy imaging has the ability of accurate tissue decomposition in radiotherapy[4, 21], we expect an accurate dosimetry performance by utilizing our proposed ME-CBCT imaging.
5. Conclusions.
Aiming at achieving ME-CBCT on a conventional CBCT plat form, we employed a kVp switching technique to acquire x-ray projections with kVp levels cycling through a number of values. We also proposed an ssNLM method to address the angular undersampling issue associated with this kVp-switching based data acquisition. In our method, a histogram matching method was incorporated to overcome the problem of intensity scale difference among energy channels. The use of image correlation along the spectral direction enabled the algorithm to identify streak artifacts appearing at different directions in images with different energy channels and therefore to effectively remove them. Convergence analysis of our algorithm was also studied. We performed a comprehensive set of simulation and real experimental studies. These studies demonstrated feasibility of our ME-CBCT scheme and the capability of achieving higher image quality than that of the conventional FBP and NLM reconstruction methods.
Acknowledgments.
This project is supported in part by grant R21EB017978 from the National Institute of Health, grant RP160661 from the Cancer Prevention and Research Institute of Texas, grant 81571771 from National Natural Science Foundation of China, and grant 2015BAI01B10 from Ministry of Science and Technology of China.
Footnotes
Note that . It is easy to get δ ≥ 2 where equality only holds for .
REFERENCES
- [1].Adluru G, Tasdizen T, Schabel MC, and DiBella EV, Reconstruction of 3d dynamic contrast-enhanced magnetic resonance imaging using nonlocal means, Journal of Magnetic Resonance Imaging, 32 (2010), pp. 1217–1227. [DOI] [PubMed] [Google Scholar]
- [2].Allard WK, Total variation regularization for image denoising, ii. examples, SIAM Journal on Imaging Sciences, 1 (2008), pp. 400–417. [Google Scholar]
- [3].Arias-Castro E, Salmon J, and Willett R, Oracle inequalities and minimax rates for nonlocal means and related adaptive kernel-based methods, SIAM Journal on Imaging Sciences, 5 (2012), pp. 944–992. [Google Scholar]
- [4].Bazalova M, Carrier J-F, Beaulieu L, and Verhaegen F, Tissue segmentation in monte carlo treatment planning: a simulation study using dual-energy ct images, Radio-therapy and Oncology, 86 (2008), pp. 93–98. [DOI] [PubMed] [Google Scholar]
- [5].Buades A, Coli B, and Morel J, A review of image de-noising methods with a new one, SIAM J. Mult. Model. Sim, 4 (2005), pp. 490–530. [Google Scholar]
- [6].Buades A, Coll B, and Morel J-M, A non-local algorithm for image denoising, in 2005 IEEE Computer Society Conference on Computer Vision and Pattern Recognition (CVPR’05), vol. 2, IEEE, 2005, pp. 60–65. [Google Scholar]
- [7].Buades A, Coll B, and Morel J-M, Image denoising methods. a new nonlocal principle, SIAM review, 52 (2010), pp. 113–147. [Google Scholar]
- [8].Cai J-F, Dong B, Osher S, and Shen Z, Image restoration: total variation, wavelet frames, and beyond, Journal of the American Mathematical Society, 25 (2012), pp. 1033–1089. [Google Scholar]
- [9].Cai J-F, Ji H, Shen Z, and Ye G-B, Data-driven tight frame construction and image denoising, Applied and Computational Harmonic Analysis, 37 (2014), pp. 89–105. [Google Scholar]
- [10].Cai J-F, Osher S, and Shen Z, Linearized bregman iterations for frame-based image de-blurring, SIAM Journal on Imaging Sciences, 2 (2009), pp. 226–252. [Google Scholar]
- [11].Chan RH, Riemenschneider SD, Shen L, and Shen Z, Tight frame: an efficient way for high-resolution image reconstruction, Applied and Computational Harmonic Analysis, 17 (2004), pp. 91–115. [Google Scholar]
- [12].Chan SH, Wang X, and Elgendy OA, Plug-and-play admm for image restoration: Fixed-point convergence and applications, IEEE Transactions on Computational Imaging, 3 (2017), pp. 84–98. [Google Scholar]
- [13].Coupé P, Hellier P, Kervrann C, and Barillot C, Nonlocal means-based speckle filtering images, IEEE transactions on image processing, 18 (2009), pp. 2221–2229. [DOI] [PMC free article] [PubMed] [Google Scholar]
- [14].Dai J, Au OC, Fang L, Pang C, Zou F, and Li J, Multichannel nonlocal means fusion for color image denoising, IEEE Transactions on Circuits and Systems for Video Technology, 23 (2013), pp. 1873–1886. [Google Scholar]
- [15].Dong B, Li J, and Shen Z, X-ray ct image reconstruction via wavelet frame based regularization and radon domain inpainting, Journal of Scientific Computing, 54 (2013), pp. 333–349. [Google Scholar]
- [16].Duval V, Aujol J-F, and Gousseau Y, A bias-variance approach for the nonlocal means, SIAM Journal on Imaging Sciences, 4 (2011), pp. 760–788. [Google Scholar]
- [17].Feldkamp L, Davis L, and Kress J, Practical cone-beam algorithm, JOSA A, 1 (1984), pp. 612–619. [Google Scholar]
- [18].Feng J, Qin C, Jia K, Han D, Liu K, Zhu S, Yang X, and Tian J, An adaptive regularization parameter choice strategy for multispectral bioluminescence tomography, Medical physics, 38 (2011), pp. 5933–5944. [DOI] [PubMed] [Google Scholar]
- [19].Fornaro J, Leschka S, Hibbeln D, Butler A, Anderson N, Pache G, Scheffel H, Wildermuth S, Alkadhi H, and Stolzmann P, Dual-and multi-energy ct: approach to functional imaging, Insights into imaging, 2 (2011), pp. 149–159. [DOI] [PMC free article] [PubMed] [Google Scholar]
- [20].Goldstein T and Osher S, The split bregman method for l1-regularized problems, SIAM journal on imaging sciences, 2 (2009), pp. 323–343. [Google Scholar]
- [21].Hünemohr N, Paganetti H, Greilich S, Jäkel O, and Seco J, Tissue decomposition from dual energy ct data for mc based dose calculation in particle therapy, Medical physics, 41 (2014). [DOI] [PMC free article] [PubMed] [Google Scholar]
- [22].Jia X, Dong B, Lou Y, and Jiang SB, Gpu-based iterative cone-beam ct reconstruction using tight frame regularization, Physics in medicine and biology, 56 (2011), p. 3787. [DOI] [PubMed] [Google Scholar]
- [23].Jia X, Lou Y, Li R, Song WY, and Jiang SB, Gpu-based fast cone beam ct reconstruc tion from undersampled and noisy projection data via total variation, Medical Physics, 37 (2010), pp. 1757–1760. [DOI] [PubMed] [Google Scholar]
- [24].Jia X, Tian Z, Lou Y, Sonke J-J, and Jiang SB, Four-dimensional cone beam ct reconstruction and enhancement using a temporal nonlocal means method, Medical physics, 39 (2012), pp. 5592–5602. [DOI] [PMC free article] [PubMed] [Google Scholar]
- [25].Jia X, Yan H, Cerviño L, Folkerts M, and Jiang SB, A gpu tool for efficient, accurate, and realistic simulation of cone beam ct projections, Medical physics, 39 (2012), pp. 7368–7378. [DOI] [PMC free article] [PubMed] [Google Scholar]
- [26].Kachelrie M and Noo F, Advances and trends in image formation in xray ct, Medical Physics, 44 (2017). [DOI] [PubMed] [Google Scholar]
- [27].Kak A and Slaney M, Principles of Computerized Tomographic Imaging, Society for Industrial and Applied Mathematics, 2001, doi:10.1137/1.9780898719277 , http://epubs.siam.org/doi/abs/10.1137/1.9780898719277 , arXiv: 10.1137/1.9780898719277http://epubs.siam.org/doi/abs/10.1137/1.9780898719277http://epubs.siam.org/doi/pdf/10.1137/1.9780898719277, http://epubs.siam.org/doi/abs/10.1137/1.9780898719277 , arXiv: http://epubs.siam.org/doi/pdf/10.1137/1.9780898719277 . [DOI] [Google Scholar]
- [28].Kim K, Ye JC, Worstell W, Ouyang J, Rakvongthai Y, El Fakhri G, and Li Q, Sparse-view spectral ct reconstruction using spectral patch-based low-rank penalty, IEEE transactions on medical imaging, 34 (2015), pp. 748–760. [DOI] [PubMed] [Google Scholar]
- [29].Li B, Lee HC, Duan X, Shen C, Zhou L, Jia X, and Yang M, Comprehensive analysis of proton range uncertainties related to stopping-power-ratio estimation using dual-energy ct imaging, Physics in Medicine and Biology, 62 (2017), p. 7056, http://stacks.iop.org/0031-9155/62/i=17/a=7056. [DOI] [PMC free article] [PubMed] [Google Scholar]
- [30].Li B, Lyu Q, Ma J, and Wang J, Iterative reconstruction for ct perfusion with a prior-image induced hybrid nonlocal means regularization: Phantom studies, Medical physics, 43 (2016), pp. 1688–1699. [DOI] [PMC free article] [PubMed] [Google Scholar]
- [31].Liang D, Wang H, Chang Y, and Ying L, Sensitivity encoding reconstruction with nonlocal total variation regularization, Magnetic resonance in medicine, 65 (2011), pp. 1384–1392. [DOI] [PubMed] [Google Scholar]
- [32].Lou Y, Zhang X, Osher S, and Bertozzi A, Image recovery via nonlocal operators, Journal of Scientific Computing, 42 (2010), pp. 185–197. [Google Scholar]
- [33].Ma J, Huang J, Feng Q, Zhang H, Lu H, Liang Z, and Chen W, Low-dose computed tomography image restoration using previous normal-dose scan, Medical physics, 38 (2011), pp. 5713–5731. [DOI] [PMC free article] [PubMed] [Google Scholar]
- [34].Mangold S, Thomas C, Fenchel M, Vuust M, Krauss B, Ketelsen D, Tsiflikas I, Claussen CD, and Heuschmid M, Virtual nonenhanced dual-energy ct urography with tin-filter technology: determinants of detection of urinary calculi in the renal collecting system, Radiology, 264 (2012), pp. 119–125. [DOI] [PubMed] [Google Scholar]
- [35].Masatoshi G, Potential of dual-energy subtraction for converting ct numbers to electron den sity based on a single linear relationship, Medical Physics, 39 (2012), pp. 2021–2030. [DOI] [PubMed] [Google Scholar]
- [36].McCollough CH, Leng S, Yu L, and Fletcher JG, Dual-and multi-energy ct: principles, technical approaches, and clinical applications, Radiology, 276 (2015), pp. 637–653. [DOI] [PMC free article] [PubMed] [Google Scholar]
- [37].McCullough EC, Hillier J Baker L, Houser OW, and Reese DF, An evaluation of the quantitative and radiation features of a scanning x-ray transverse axial tomograph: The emi scanner, Radiology, 111 (1974), pp. 709–715, doi:10.1148/111.3.709 , 10.1148/111.3.709 10.1148/111.3.709, https://doi.org/10.1148/111.3.709 . PMID: . [DOI] [PubMed] [Google Scholar]
- [38].Metzler CA, Maleki A, and Baraniuk RG, From denoising to compressed sensing, IEEE Transactions on Information Theory, 62 (2016), pp. 5117–5144. [Google Scholar]
- [39].Peyré G, Bougleux S, and Cohen L, Non-local regularization of inverse problems, Computer Vision–ECCV 2008, (2008), pp. 57–68. [Google Scholar]
- [40].Poludniowski G, Landry G, DeBlois F, Evans P, and Verhaegen F, Spekcalc: a program to calculate photon spectra from tungsten anode x-ray tubes, Physics in medicine and biology, 54 (2009), p. N433. [DOI] [PubMed] [Google Scholar]
- [41].Pomerantz SR, Kamalian S, Zhang D, Gupta R, Rapalino O, Sahani DV, and Lev MH, Virtual monochromatic reconstruction of dual-energy unenhanced head ct at 65–75 kev maximizes image quality compared with conventional polychromatic ct, Radiol ogy, 266 (2013), pp. 318–325. [DOI] [PubMed] [Google Scholar]
- [42].Qu M, Jaramillo-Alvarez G, Ramirez-Giraldo JC, Liu Y, Duan X, Wang J, Vrtiska TJ, Krambeck AE, Lieske J, and McCollough CH, Urinary stone differentiation in patients with large body size using dual-energy dual-source computed tomography, European radiology, 23 (2013), pp. 1408–1414. [DOI] [PMC free article] [PubMed] [Google Scholar]
- [43].Rond A, Giryes R, and Elad M, Poisson inverse problems by the plug-and-play scheme, Journal of Visual Communication and Image Representation, 41 (2016), pp. 96–108. [Google Scholar]
- [44].Sastry K, Mudry K, and Passalaqua AM, Map image reconstruction methods using adaptive parameter selection, in Computer-Based Medical Systems, 1994., Proceedings 1994. IEEE Seventh Symposium on, IEEE, 1994, pp. 317–322. [Google Scholar]
- [45].Schneider U, Pedroni E, and Lomax A, The calibration of ct hounsfield units for radio-therapy treatment planning, Physics in medicine and biology, 41 (1996), p. 111. [DOI] [PubMed] [Google Scholar]
- [46].Segars WP, Lalush DS, and Tsui BM, A realistic spline-based dynamic heart phantom, IEEE Transactions on Nuclear Science, 46 (1999), pp. 503–506. [Google Scholar]
- [47].Siddon RL, Fast calculation of the exact radiological path for a three-dimensional ct array, Medical physics, 12 (1985), pp. 252–255. [DOI] [PubMed] [Google Scholar]
- [48].Singer A, Shkolnisky Y, and Nadler B, Di usion interpretation of nonlocal neighborhood filters for signal denoising, SIAM Journal on Imaging Sciences, 2 (2009), pp. 118–139. [Google Scholar]
- [49].Taasti VT, Petersen JB, Muren LP, Thygesen J, and Hansen DC, A robust empirical parametrization of proton stopping power using dual energy ct, Medical Physics, 43 (2016), pp. 5547–5560. [DOI] [PubMed] [Google Scholar]
- [50].Taguchi K and Iwanczyk JS, Vision 20/20: Single photon counting x-ray detectors in medical imaging, Medical physics, 40 (2013). [DOI] [PMC free article] [PubMed] [Google Scholar]
- [51].Tian Z, Jia X, Dong B, Lou Y, and Jiang SB, Low-dose 4dct reconstruction via temporal nonlocal means), Medical physics, 38 (2011), pp. 1359–1365. [DOI] [PubMed] [Google Scholar]
- [52].Tian Z, Jia X, Yuan K, Pan T, and Jiang SB, Low-dose ct reconstruction via edge-preserving total variation regularization, Physics in medicine and biology, 56 (2011), p. 5949. [DOI] [PMC free article] [PubMed] [Google Scholar]
- [53].Uotani K, Watanabe Y, Higashi M, Nakazawa T, Kono AK, Hori Y, Fukuda T, Kanzaki S, Yamada N, Itoh T, et al. , Dual-energy ct head bone and hard plaque removal for quantification of calcified carotid stenosis: utility and comparison with digital subtraction angiography, European radiology, 19 (2009), pp. 2060–2065. [DOI] [PubMed] [Google Scholar]
- [54].Venkatakrishnan SV, Bouman CA, and Wohlberg B, Plug-and-play priors for model based reconstruction, in Global Conference on Signal and Information Processing (Global-SIP), 2013 IEEE, IEEE, 2013, pp. 945–948. [Google Scholar]
- [55].Wang G, Yu H, and De Man B, An outlook on x-ray ct research and development, Medical physics, 35 (2008), pp. 1051–1064. [DOI] [PubMed] [Google Scholar]
- [56].Wang J, Guan H, and Solberg T, Inverse determination of the penalty parameter in penalized weighted least-squares algorithm for noise reduction of low-dose cbct, Medical physics, 38 (2011), pp. 4066–4072. [DOI] [PubMed] [Google Scholar]
- [57].Wang Z, Bovik AC, Sheikh HR, and Simoncelli EP, Image quality assessment: from error visibility to structural similarity, IEEE transactions on image processing, 13 (2004), pp. 600–612. [DOI] [PubMed] [Google Scholar]
- [58].Yang M, Virshup G, Clayton J, Zhu X, Mohan R, and Dong L, Theoretical variance analysis of single-and dual-energy computed tomography methods for calculating proton stopping power ratios of biological tissues, Physics in medicine and biology, 55 (2010), p. 1343. [DOI] [PubMed] [Google Scholar]
- [59].Yang Z and Jacob M, Nonlocal regularization of inverse problems: a unified variational framework, IEEE Transactions on Image Processing, 22 (2013), pp. 3192–3203. [DOI] [PMC free article] [PubMed] [Google Scholar]
- [60].Yu DF and Fessler JA, Edge-preserving tomographic reconstruction with nonlocal regularization, IEEE transactions on medical imaging, 21 (2002), pp. 159–173. [DOI] [PubMed] [Google Scholar]
- [61].Zhang H, Ma J, Wang J, Liu Y, Han H, Lu H, Moore W, and Liang Z, Statistical image reconstruction for low-dose ct using nonlocal means-based regularization. part ii: An adaptive approach, Computerized Medical Imaging and Graphics, 43 (2015), pp. 26–35. [DOI] [PMC free article] [PubMed] [Google Scholar]
- [62].Zhang H, Ma J, Wang J, Liu Y, Lu H, and Liang Z, Statistical image reconstruction for low-dose ct using nonlocal means-based regularization, Computerized Medical Imaging and Graphics, 38 (2014), pp. 423–435. [DOI] [PMC free article] [PubMed] [Google Scholar]
- [63].Zhang L, Zhang L, Mou X, and Zhang D, Fsim: A feature similarity index for image quality assessment, IEEE transactions on Image Processing, 20 (2011), pp. 2378–2386. [DOI] [PubMed] [Google Scholar]
- [64].Zhang X, Burger M, Bresson X, and Osher S, Bregmanized nonlocal regularization for deconvolution and sparse reconstruction, SIAM Journal on Imaging Sciences, 3 (2010), pp. 253–276. [Google Scholar]
- [65].Zhen X, Gu X, Yan H, Zhou L, Jia X, and Jiang SB, Ct to cone-beam ct deformable registration with simultaneous intensity correction, Physics in medicine and biology, 57 (2012), p. 6807. [DOI] [PMC free article] [PubMed] [Google Scholar]


