Abstract
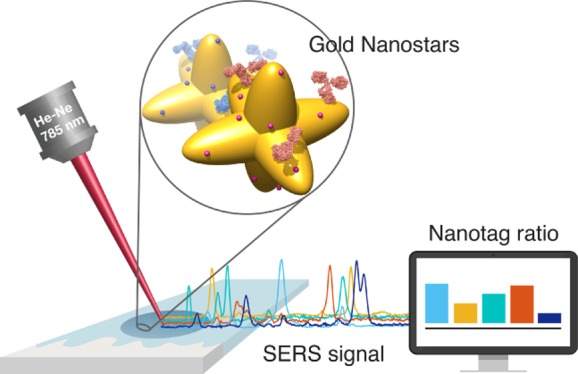
We report a quantitative evaluation of the choice of reporters for multiplexed surface-enhanced Raman spectroscopy (SERS). An initial library consisted of 15 reporter molecules that included commonly used Raman dyes, thiolated reporters, and other small molecules. We used a correlation matrix to downselect Raman reporters from the library to choose five candidates: 1,2-bis(4-pyridyl)ethylene, 4-mercaptobenzoic acid, 3,5-dichlorobenzenthiol, pentachlorothiophenol, and 5,5′-dithiobis(2-nitrobenzoic acid). We evaluated the ability to distinguish the five SERS reporters in a dipstick immunoassay for the biomarker human IgG. Raman nanotags, or gold nanostars conjugated to the five reporters and anti-human IgG polyclonal antibodies were constructed. A linear discriminant analysis approach was used to evaluate the separation of the nanotag spectra in mixtures of fixed ratios.
Introduction
Surface-enhanced Raman spectroscopy (SERS) has become attractive for sensing and detection applications because of its high sensitivity and multiplexing capabilities. Raman spectra can serve as a unique signal, or fingerprint, that can be leveraged for specific and sensitive detection of analytes. Even though Raman scattering is weak, the Raman signal of a molecule can be greatly enhanced by being in proximity to a roughened metal surface or a nanoparticle by several orders of magnitude, as high as 109.1−3 Consequently, SERS has become a powerful technique because of its high sensitivity to detect analytes,4 sometimes down to attomol levels.
In particular, using SERS enhancement in the nanotag conformation has been useful for expanding the capabilities of biological sensing, imaging, and detection. Typically, a reporter molecule is conjugated to the surface of a nanoparticle,5−7 which provides the SERS signal. The nanoparticle is attached to a species that can bind to a biomolecule with specificity, such as an antibody, peptide, targeting ligand, or aptamer, thus enabling measurement of the presence of a biomolecule via the Raman signal of the reporter on the NP surface. This approach has been applied successfully for cell imaging,8−10 paper-based immunoassays,11−13 bead assays,14 and other biological applications.15,16 In addition, the ability to excite the Raman reporters in the tissue window facilitates in vivo detection and imaging.17
SERS becomes more powerful when it is highly multiplexed, and thus approaches to expand the number of nanotags in an experiment have been pursued for techniques such as screening peptide libraries,14 sorting cell-binding species, multiplexed imaging, and many others.18,19 Fortunately, there is a multitude of Raman reporters that can be found in the literature, such as Raman dyes [e.g., malachite green (MG), methylene blue (MB), and crystal violet (CV)]20 which are widely used in cell imaging because of their intense signals. Thiolated molecules21 (e.g., 4-mercaptobenzoic acid (MBA), 4-methoxythiophenol) are commonly used because of their ability to conjugate directly to gold surfaces.22 In addition to these classes of molecules, there are a many other small molecules with characteristic Raman spectral features [e.g., 1,2-bis(4-pyridyl)ethylene (BPE)] that has made them well suited for SERS.23 Others have demonstrated multicolor SERS detection with combinations of a large number of reporters in bar coding approaches and have been able to successfully deconvolute the spectra of multiple reporters.24,25 Furthermore, strategies such as multiplexing with orthogonal measurement techniques such as fluorescence spectroscopy can introduce an even higher degree of diversity.16
However, the performance of a SERS multiplexed assay relies on the ability to deconvolute the signals from each of the reporters. Spectral overlap between reporter makes deconvolution more difficult, and thus reporters are chosen to have minimal overlap. Selecting these molecules is typically straightforward for situations which require only one or two nanotags, as it is easy to find two reporters with minimally overlapping spectra, especially if they are small molecules.26 Unfortunately, achieving minimal spectral overlap becomes increasingly difficult when a large number of reporters are required. While this is straightforward for two reporters, this rapidly becomes more challenging as the number of required reporters increases. This is further complicated by the use of larger molecules such as Raman dyes which have complicated spectra. The choice of Raman reporters can be a major limiting factor in multiplex design, and suboptimal reporter choice can compromise deconvolution and ultimately multiplexing capability.
While multiplexed SERS has been achieved previously, a quantitative method for selecting a set of reporter molecules has not yet been detailed, and there is no generally accepted approach. Typically reporters are selected based on the separation of their most prominent peaks, and are often eyeballed, which is not feasible for highly multiplexed assays. Thus, there is a need for a method for choosing and also evaluating an optimal set of reporters for their proper deconvolution. Furthermore, ratiometric information between analytes is often necessary for clinical assays, so the ability to quantify the contributions of the different reporter molecules is desirable.27
Here, we investigate a protocol for selecting a set of optimal reporters for a multiplexed SERS assay and their relative quantification that could serve as a method to provide differential diagnosis among diseases presenting distinct levels of the same biomarkers. This method is based on the use of a correlation matrix as a first pass screen to select a group of reporters with minimal overlap, and then the use of linear discriminant analysis (LDA) to train the system to be able to associate different ratios to a certain disease, with an efficiency of up to 88% for a 5-plexed mixture. We applied this procedure to a SERS-based multiplexed dipstick sandwich immunoassays using human IgG as a model analyte because its promising use as a biomarker in point-of-care devices for detection of infectious diseases.
Results and Discussion
Optimization of Reporter Selection
We first generated a list of compounds for Raman reporters drawn from the literature, which consisted of commonly used reporters, from Raman dyes (brilliant blue, cresyl violet, etc.), to thiolated molecules (e.g., 4-MBA) and other small molecules known to have a characteristic Raman spectrum (e.g., BPE).
To distinguish the different Raman reporters in a multiplexed signal, it is desirable to use molecules whose Raman signature overlaps the least with each other so as to preserve their most salient spectral features in the multiplexed signal. In this context, developing metrics to assess the degree of overlap between Raman reporters might aid the choice of a least-overlapping set of species within the library. Here, we propose to use the correlation between the spectra of each reporter as a measure of overlap. Given two discrete Raman spectra Si and Sj, their correlation is given by
| 1 |
where wmin and wmax are the minimum and maximum wavelength of
the spectra, respectively. As the intensity of these spectra is non-negative
for any wavelength, we have that each term of the sum above will be
non-negative, and thus the correlation value Ci,j will be bounded below
by 0. If the spectra are normalized by their squared norm, that is,  , and
then the correlation value is also
bounded above by 1. The presence of these two bounds yields an overlap
metric that is easily interpretable. When the spectra Si and Sj have no overlap at all, their correlation is 0.
As the degree of overlap increases, their correlation Ci,j also increases until
reaching Ci,j = 1, which is only the case when the spectra Si = Sj.
First, we evaluated the overlap of 15 Raman reporters using a correlation matrix calculated from their SERS spectra. Star-shaped gold nanoparticles, gold nanostars (GNSs), were synthesized as previously described because of their strong Raman enhancement properties,28 using a HAuCl4 reduction in N-(2-hydroxyethyl)piperazine-N′-(2-ethanesulfonic acid) (HEPES).29−31 Their hydrodynamic diameter (DH) measured by dynamic light scattering was 38.49 ± 10.45 nm and the zeta potential −39.17 ± 1.13 mV. They exhibited a surface plasmon resonance (SPR) at 754 nm, confirming absorption in the near-infrared (Figure 1a). Transmission electron microscopy (TEM) imaging confirmed star-shaped particles with a core size of ∼20 nm and arm lengths of ∼30 nm (Figure 1b), consistent with previous results.28,32
Figure 1.
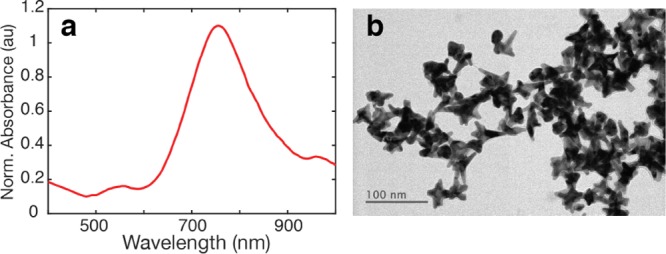
Characterization of plain GNS. (a) Optical absorption of plain GNS. (b) TEM images of plain GNSs (scale bar = 100 nm).
GNS were conjugated to the different reporter molecules in solution (GNS–Rep). The incubation ratio was chosen such that the reporter was high enough to be in excess of 1 monolayer on the GNS, based on calculated values of GNS surface areas.31 The final amount of reporter was adjusted afterward so that they showed similar intensities in their SERS signal. After conjugation to reporters, GNS–Rep were coated with thiolated PEG to enhance their colloidal stability (Supporting Information Figure S1), and their SERS spectra were measured (Figure 2a). The correlation for the 15 reporters was then calculated and a correlation matrix was constructed by taking the normalized SERS spectrum of each reporter and computing the correlations as explained above using wmin = 400 cm–1 and wmax = 1800 cm–1 (Figure 2b). Color in the matrix indicates the value of the correlation, with yellow showing high degree of overlap between pairs of spectra and blue showing a low degree.
Figure 2.
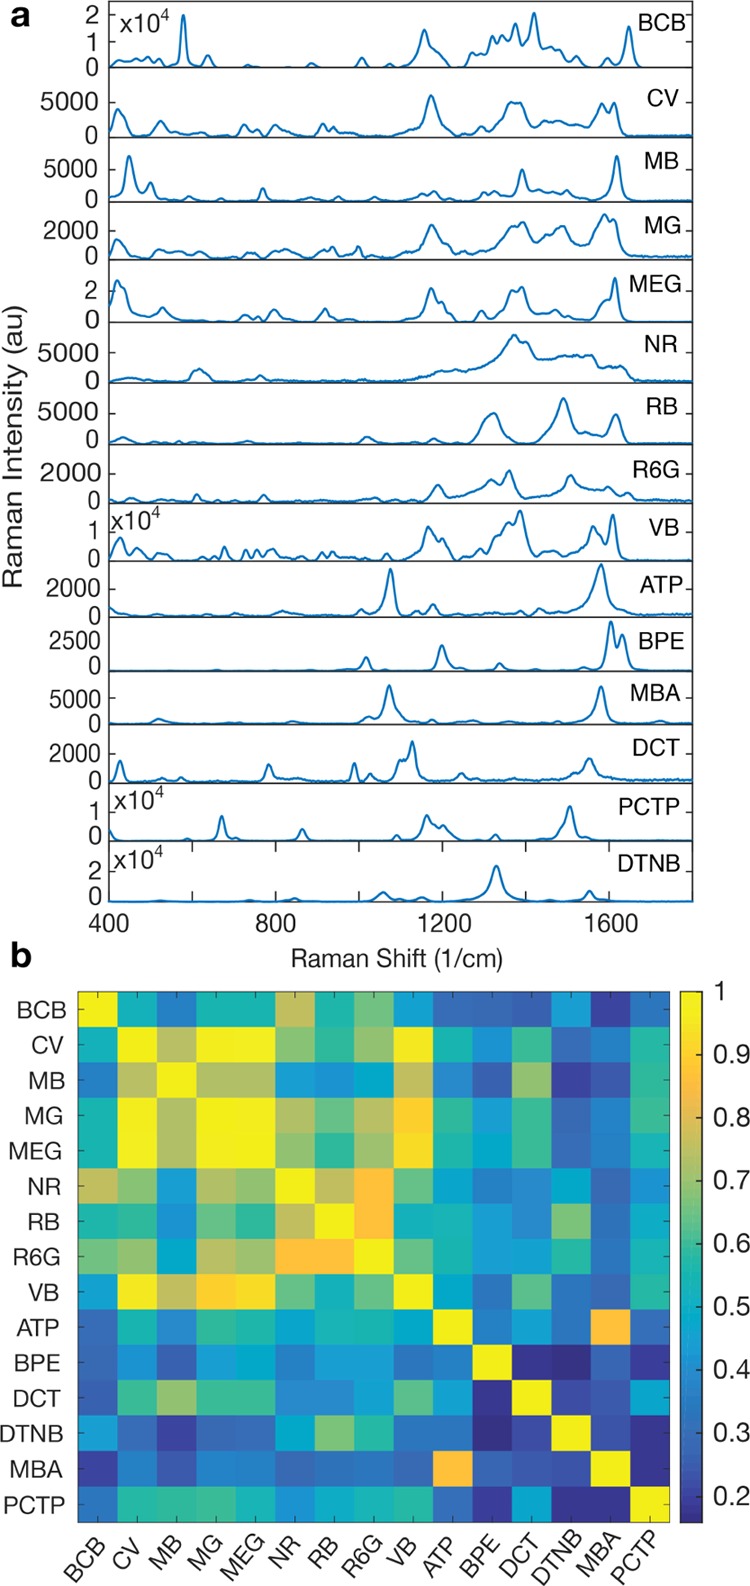
SERS signal of selected reporters on GNS. (a) SERS spectra of the 15 selected Raman reporters. (b) Correlation matrix built from the SERS spectra. The color bar indicates the level of overlapping signals, where 1 (yellow) means 100% overlap and 0 (dark blue) means 0% overlap. Name legend: brilliant cresyl blue (BCB), crystal violet (CV), methylene blue (MB), malachite green isocyanate (MG), methylene green (MEG), neutral red (NR), rose bengal (RB), rhodamine 6G (R6G), victoria blue (VB), 4-aminothiophenol (ATP), BPE, MBA, 3,5-dichlorobenzenthiol (DCT), pentachlorothiophenol (PCTP), and 5,5′-dithiobis(2-nitrobenzoic acid) (DTNB).
The reporters exhibited different amounts of overlap with one another. In general, Raman dyes are larger and consequently have more complex spectra, with a higher number of peaks and therefore higher degree of overlap, as evidenced by the yellow off-diagonal regions in the upper left area of the matrix. For example, CV, MG, and MEG all present high overlap with each otherwith correlation values close to 1 (yellow) in their intersections in the matrix. In contrast, smaller molecules possess simpler spectra with sparser peaks, which leads to less overlap across reporters, as shown by the reduced off-diagonal signal in the lower right corner of the correlation matrix. For instance, BPE had low overlap with most of the small molecules, such as DCT and DTNB. On the basis of these criteria, we selected five reporters with the lowest overlap amongst each other for the multiplexed experiments: BPE, MBA, DCT, PCTP, and DTNB.
Nanotag Synthesis and Characterization
The selected reporter molecules were then tested in a multiplexed sandwich immunoassay, as they are used widely in lateral flow or dipstick tests for point of care diagnostics. Furthermore, SERS has been promising in enhancing the sensitivity of lateral flow immunoassays (LFAs).14,28 When using SERS for a multiplexed sandwich immunoassay, the five nanoparticle–reporter conjugates would be conjugated to five different antibodies specific for their respective biomarkers, resulting in five nanotags. However, to investigate the presented approach for optimal reporter selection, we used the same antibody–antigen for all five nanotags, which would allow us to compare SERS signals without the complication of varying antibody–antigen affinities across the nanotags. The model antigen–antibody used in this approach was human IgG (antigen) and anti-human IgG (antibody), as its detection is often used as a biomarker for infectious diseases based on a patient immune response to an infection.
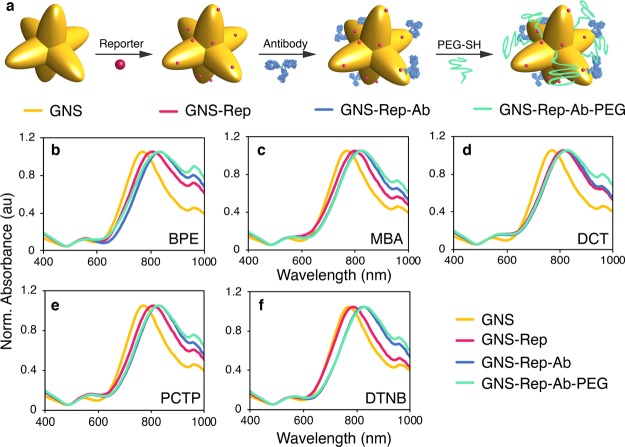
GNS were first coated with each Raman reporter, followed by the conjugation to polyclonal anti-human IgG antibodies via adsorption for use in the paper dipstick immunoassays. Ab conjugation was achieved by incubation of the GNS–Rep with the Abs at a molar ratio of 400:1 Ab–GNS. Afterward, thiolated PEG (5 kDa) was added as a backfill for the remaining bare gold surface to reduce nonspecific interactions (Figure 3a).
Figure 3.
(a) Preparation of SERS-encoded conjugates (“nanotags”). Normalized optical spectra of plain nanostars (GNS; yellow), after encoding with Raman reporter (GNS–Rep; pink), after antibody conjugation (GNS–Rep–Ab; blue) and after PEG backfill addition (GNS–Rep–Ab–PEG; green) for (b) BPE, (c) MBA, (d) DCT, (e) PCTP, and (f) DTNB.
Reporter and Ab-conjugation was confirmed by a red shift of the SPR peak of ∼30 nm for all conjugated samples after reporter addition and ∼25 nm after antibody conjugation and PEG addition, which can be attributed to changes in the refractive index surrounding the GNS with the reporter, protein, and PEG layers.33 A slight broadening of the SPR peak can be due to some extent to GNS aggregation (Figure 3b–f). GNS aggregation is undesirable and depending on the application should be eliminated or minimized; however, for the dipstick assays, the extent of aggregation did not impact immunoassay function. The aggregation index of the conjugates was calculated to quantify their colloidal stability, showing a slight increase for GNS–Rep–Ab–PEG as compared to plain GNS (Supporting Information Figure S2).34
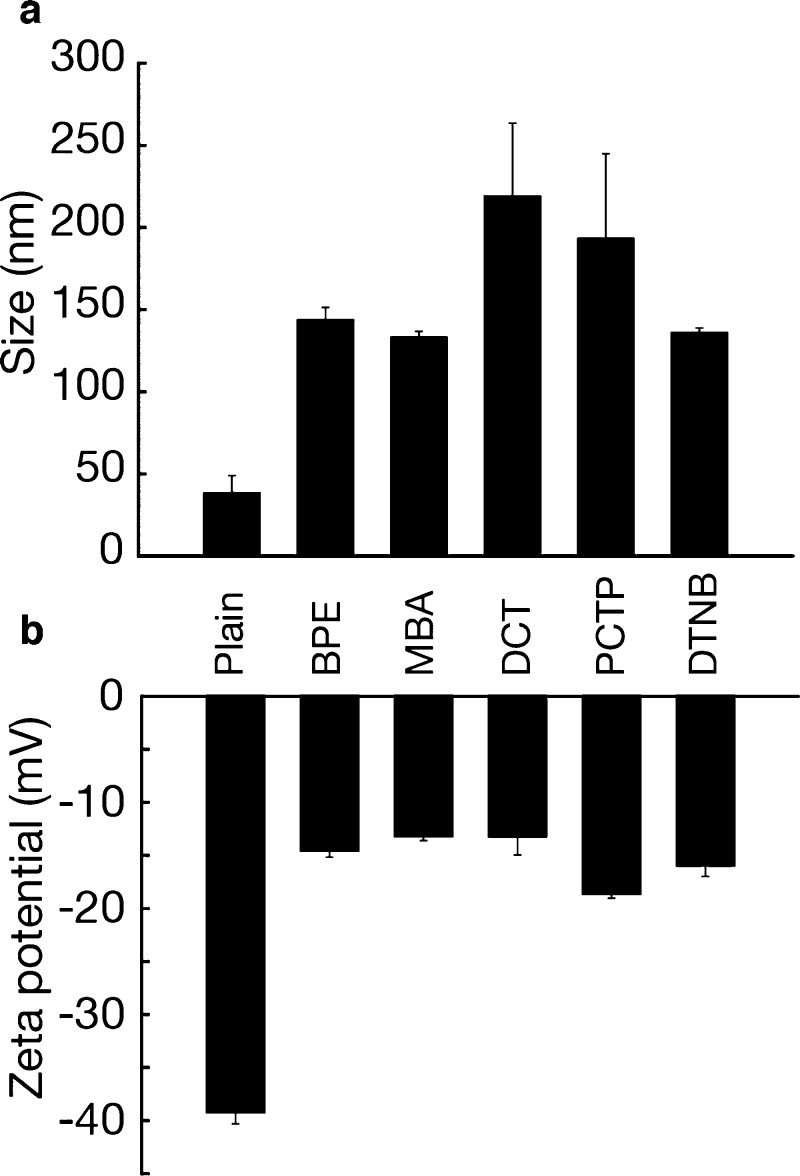
Additionally, antibody conjugation to the GNS was confirmed by an increase in DH values between 90 and 180 nm relative to bare GNS (Figure 4a), as well as a decrease in zeta potential of ∼25 mV for all five samples, showing a change in the GNS surface due to the antibody attachment (Figure 4b). The increase in DH could be attributed to the adsorption of the Raman reporters, a multilayer of Abs on the GNS, and the PEG backfill.
Figure 4.
Characterization of antibody-conjugated GNS. (a) DH and (b) zeta potential of anti-IgG-conjugated GNS (error bars are measurements of n = 5 ± standard deviation).
The antibody surface density on the GNS, or coverage, was quantified using the bicinchoninic acid quantification assay (BCA assay) (Supporting Information Figure S3) in combination with the GNS concentration obtained by UV–vis spectroscopy. Coverages were determined to be ≈58, 58, 66, 37, and 53 Ab–GNS33,35 for BPE, MBA, DCT, PCTP, and DTNB nanotags, respectively. Assuming a footprint of 81.3 nm236 for a typical IgG antibody and that synthesized GNSs have an average surface area of 3.6 × 10³ nm2,31,36 the results suggest a multilayer coverage for most of the nanotags.
Dipstick Immunoassays
Immunoassays were run in a dipstick conformation consisting of a nitrocellulose strip onto which anti-human IgG was immobilized on the test line and a control antibody (anti-Fc) on the control line (Figure 5a). To run the assay, the nitrocellulose strips were partially immersed in a buffered solution of Tween-20 1%, sucrose 50%, and bovine serum albumin (BSA) 10% (w/v), which contained nanotags at 0.6 nM and human IgG at a concentration of 40 μg/mL, which is below typical biomarker patient levels in sera for diseases such as malaria.37 Additionally, these levels of IgG ensured excess of antigen, so that all nanotags could bind to IgG and form the sandwich on the test line in equal conditions when they were all mixed together in the multiplex assay. Upon contact with the nitrocellulose, the fluid migrated up the strip by capillary action to an absorbent pad attached at the top of the strip to serve as a fluid sink. If human IgG was present, the assay resulted in a visible spot appearing at the test line, indicating the accumulation of GNS because of binding of IgG to both the Ab on the nanotag and the immobilized Ab on the strip (sandwich formation). A spot should appear on the control line, even for negative tests (no IgG present), indicating the binding of the anti-Fc antibodies to the Ab on the nanotag. This showed that sample flow through the strip was complete.
Figure 5.
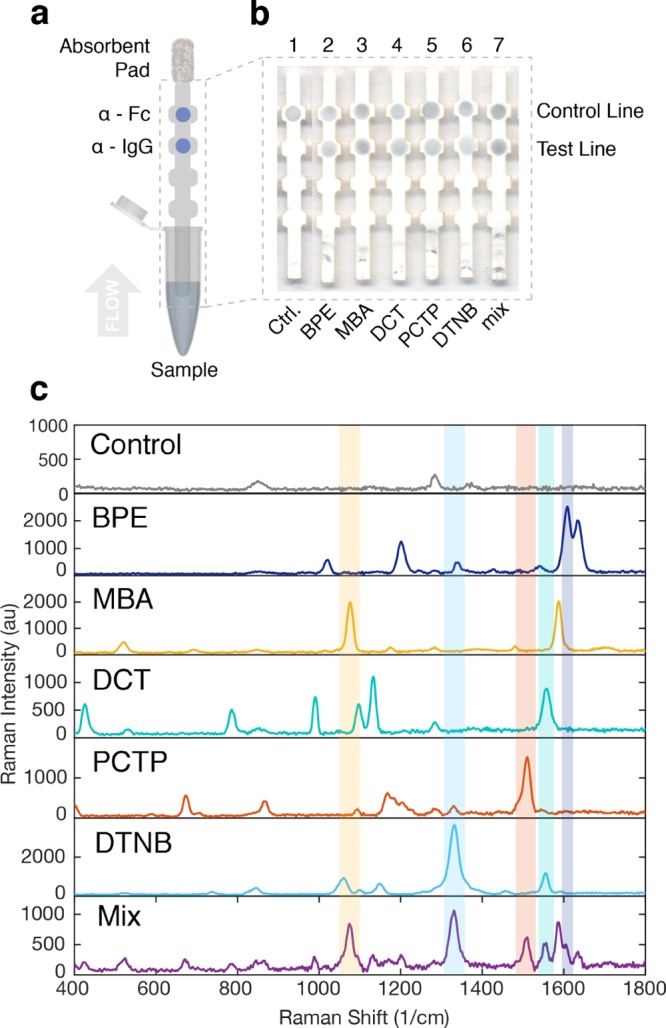
Use of nanotags in a sandwich immunoassay for IgG. (a) Dipstick flow immunoassay scheme. (b) Resulting strips from running individual nanotags with the five reporters (strips 2–6) and strip from the mixture of all nanotags (strip 7). Strip 1 is the negative control. (c) SERS spectra of the negative control, the five nanotags and the mixture (mix).
Positive tests resulted for all five nanotags run individually (strips 2–6, Figure 5b). When IgG was not present, the assay did not produce a visible spot at the test line but still resulted in a spot at the control line (strip 1), which was indicative of a negative test (Supporting Information, Figure S4a). This confirmed that the sandwich formed only when IgG was present but that the control line antibodies could still bind to the nanotag. In a colorimetric analysis, the test areas had the same appearance for all of the nanotags, as they were synthesized with the same GNS. Even when running a multiplex assay mixing the five nanotags, the color of the spot on the test line was the same with higher intensity (strip 7, Figure 5b). Increasing the nanotag concentration (Supporting Information, Figure S5) and antigen concentration (Supporting Information Figure S6) resulted in a higher SERS intensity.
To be able to distinguish between nanotags on the test line and therefore between biomarkers, the SERS signal on the test line was measured with a confocal Raman microscope. The SERS spectrum (400–1800 cm–1) was acquired from the entire test area using a Raman confocal microscope and averaged over multiple (30) locations in the test area. Test areas exhibited spectra characteristic of each reporter used in the different nanotags, confirming their presence at the test line (Figure 5c). Even though the nanoparticle concentration was the same for each of the individual nanotags, the SERS signal of each sample can still differ because of other factors32 such as inherent reporter Raman intensity and reporter concentration on the GNS, as well as the antibody surface density (coverage) on the nanoparticle.38 SERS measurements of the test area for a strip run with a mixture of all of the nanotags (mix, purple line) resulted in a spectrum exhibiting the different features of each individual reporter, which could be distinguished in the spectrum. SERS measurements of the test areas for tests run with no IgG present showed spectra characteristic of nitrocellulose, with no spectral contributions of the Raman reporters, confirming the negative control (Supporting Information, Figure S4b).
Multiplexed Immunoassay
To test the separability of the different nanotags in a dipstick immunoassay, we used the five nanotags in a multiplexed assay with the goal of evaluating the ability to deconvolute the spectra into nanotag contributions. First, we investigated the nanotags individually, when only a single reporter was present. Each nanotag was run in a dipstick immunoassay and 30 Raman spectra were recorded for each of the experiments. Their relative contributions were estimated from the SERS spectra by measuring the presence of each nanotag in the test using a non-negative least squares (LS) algorithm on a basis of a separate set of individually run strips (Supporting Information Figure S7).32 A representative result of the LS estimation is shown in Figure 6, where the detected presence of each of the reporters is shown for each of the 30 spectra recorded for the MBA sample. The LS algorithm was able to reliably estimate the presence of MBA, while keeping the contribution of the rest of reporters close to 0. The results for the other 4 nanotags are shown in Supporting Information Figure S8.
Figure 6.
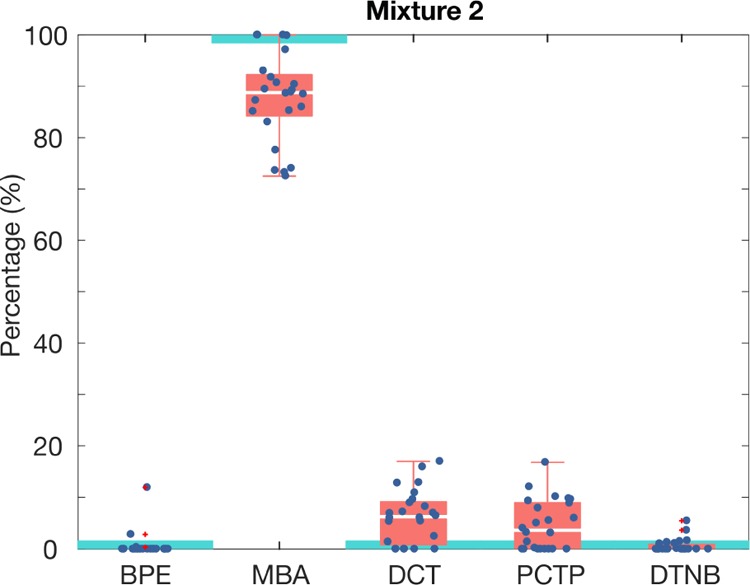
Nanotag ratio estimation for an assay run with an individual nanotag using the LS algorithm where MBA was present at 100% and all other reporters were at 0% (mixture 2). Each data point represents the individual SERS intensities for a region of the test area. Red boxes show 50% of the data between the second (lower limit) and the third quartile (upper limit), and the median (white line). Whiskers indicate the value of the maximum and the minimum. SERS intensities were measured for 30 regions in a test area. Light blue boxes represent the real ratio of reporter in the mixture.
In many cases, the multiplexed assay is designed to detect a particular condition between a set of candidates. If so, it might be of interest for the detection platform to be able to translate the estimated presence ratio of each nanotag into one of the candidate conditions to be detected. For that end, we train an LDA classifier whose input is the nanotag ratio estimated by the LS algorithm and whose output is an integer label, from 1 to 5, that indicates which one of the reporters was present in the experiment.
The LDA classifier was trained with a Monte-Carlo cross-validation scheme as follows. In each iteration, five Raman spectra per experiment were selected at random and saved as a test set and the rest was used as the classifier training set. The LDA classifier was trained using the training set of all experiments and then tested with the test sets, leading to five classification results per experiment. This procedure was repeated 200 times to ensure that the random partition of the spectra sets would cover a wide enough range of partitions, leading to 1000 classification results per experiment. The aggregated results of the classification are shown in the confusion matrix in Figure 7.
Figure 7.
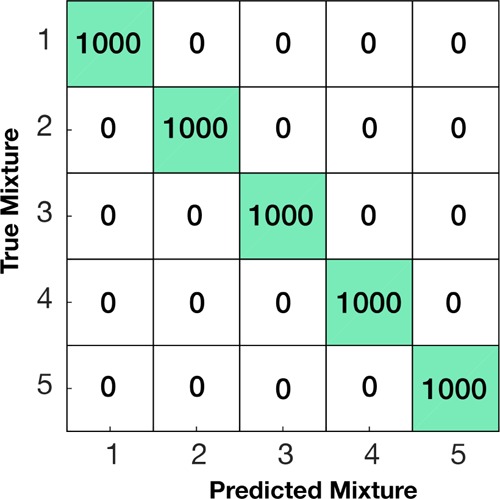
Confusion matrix of the individual tests using the LDA classifier.
For each cell in the matrix, the row index indicates the true presence of that sample, while the column index indicates the estimated label, that is, the value in row 2 and column 5 indicates how many samples from the second nanotag mixture were classified as coming from mixture 5. It follows that correct estimations will accumulate in the diagonal of the confusion matrix, whereas misclassifications will be located in the off-diagonals. Each row in the matrix adds up to a 1000, as the classifier was tested with five samples per experiment. The LDA classifier was able to correctly classify all the samples, with 0 misclassifications out of the 5000 tests (Figure 6).
We then tested the ability to distinguish between nanotags when present in a mixture, and the ability to quantify their relative ratios. Ratios of biomarkers can be used to provide a diagnosis, where IgG/IgM ratios can be used to detect dengue27 or percentages of IgG, IgA, and IgM can provide information regarding the type of malaria.37 Therefore, being able to identify biomarker’s levels within a common set of biomarkers could help in the differentiation among different conditions (Figure 8).
Figure 8.
Diagram of the approach followed to identify the mixture present in a sample based on the nanotag ratio.
To quantitatively estimate the nanotag contribution in a mixture and be able to distinguish between different mixtures showing the same set of biomarkers, we made 12 different unique mixtures of the five nanotags at varying contributions, as a sampling of the infinite possible mixtures that could exist. These mixtures were then analyzed using the LS estimation and the LDA classifier. For each mixture, the five nanotags (BPE, MBA, DCT, PCTP, and DTNB–nanotag) were mixed at predefined ratios of the different nanotags (Table 1). A dipstick immunoassay was run for each of these samples, and the spectra were taken for each of the mixtures (Supporting Information, Figure S9). To minimize competition between nanotags, the strip was run with excess IgG, and the mixture of nanotags was prepared separately and then added to the IgG.
Table 1. Nanotag Ratios in Each of the Mixturesa.
| mixture | BPE | MBA | DCT | PCTP | DTNB |
|---|---|---|---|---|---|
| 1 | 33 | 33 | 0 | 33 | 0 |
| 2 | 0 | 0 | 33 | 33 | 33 |
| 3 | 17 | 17 | 33 | 17 | 17 |
| 4 | 33 | 0 | 33 | 33 | 0 |
| 5 | 20 | 39 | 20 | 12 | 10 |
| 6 | 33 | 17 | 17 | 17 | 17 |
| 7 | 17 | 17 | 17 | 33 | 17 |
| 8 | 17 | 17 | 17 | 17 | 33 |
| 9 | 0 | 25 | 0 | 50 | 25 |
| 10 | 40 | 0 | 20 | 0 | 40 |
| 11 | 0 | 33 | 17 | 33 | 17 |
| 12 | 0 | 20 | 40 | 40 | 0 |
Values expressed in percentage (%).
The nanotag contributions for each of the spectra were estimated using the NNLS algorithm (Supporting Information, Figure S10). Figure 9 shows a representative case of the LS ratio estimation for one of the mixtures, mixture 5, which had BPE 20%, MBA 39%, DCT 20%, PCTP 12%, and DTNB 10%, where the light blue boxes indicate the true ratio. Compared with our previous experiment with single reporters, it is clear that the estimation exhibits more variance and a systematic bias in the mean. These biases might be caused by the simultaneous presence of different nanotags at comparable concentrations in the strip.
Figure 9.
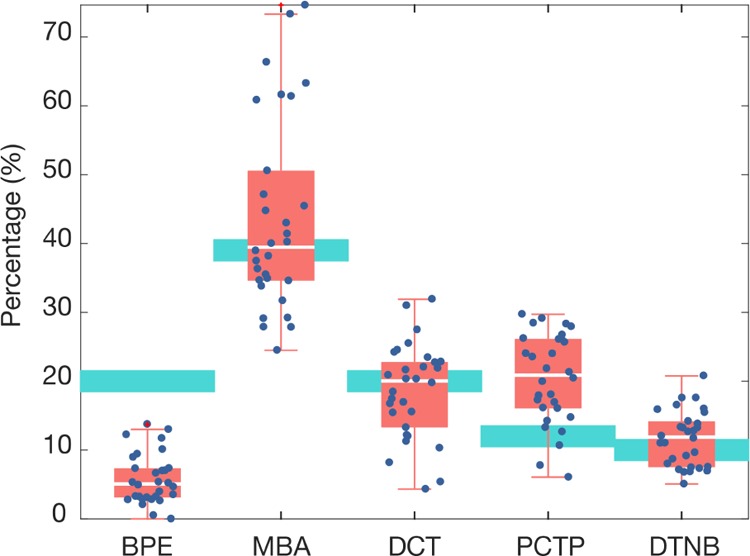
Nanotag ratio estimation using LS algorithm for mixture 5 which had BPE 20%, MBA 39%, DCT 20%, PCTP 12%, and DTNB 10%. Each data point represents the individual SERS intensities for a region of the test area. Red boxes show 50% of the data between the second (lower limit) and the third quartile (upper limit), and the median (white line). Whiskers indicate the value of the maximum and the minimum. SERS intensities were measured for 30 regions in a test area. Light blue boxes represent the real ratio of reporter in the mixture.
Certain reporters were consistently under- or over-estimated in the experiments. In general, the concentration of BPE–nanotags was underestimated in all of the mixtures where it was present, whereas the PCTP–nanotag contribution was always overestimated in the mixtures where it was present. MBA–nanotag concentrations were misestimated in some samples (mixtures 6, 8, and 9), but it generally was comparable to the real ratio. In the case of DCT–nanotags, its predicted contribution was fairly accurate, though slightly below the real value in some samples (mixtures 7, 11, and 12). Last, DTNB–nanotags were both underestimated (mixtures 7, 9, and 11) and overestimated in some cases (mixtures 8 and 10). Contributions of the nanotags that were not present in the mixtures were all low, at values <3%.
Despite the presence of these estimation biases, we can still perform an accurate classification of the different pre-defined mixtures if the trained classifier is aware of them. As in the previous experiment, an LDA classifier is trained with the ratios estimated by the LS algorithm using the same training procedure. The cross-validation scheme led to 1000 classification tasks per mixture, and these results are shown in the confusion matrix (Figure 10).
Figure 10.
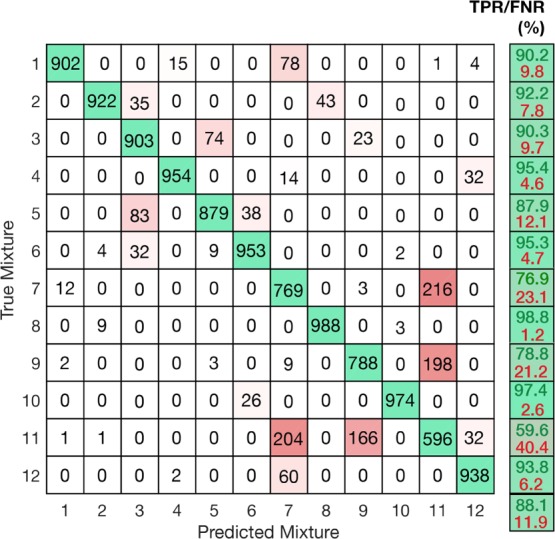
Confusion matrix of the 12 mixtures tested as defined by Table 1 using LDA classifier.
The presented classifier achieved an average true positive rate (TPR) of 88%, with 8 of the 12 mixtures exhibiting an accuracy >90%. Interestingly, more than half of the misclassification instances occurred between mixtures 7, 9, and 11, showing TPR between 60 and 79%. While the ratios in these mixtures are only moderately similar to one another (Table 1), the estimated ratios for each of them exhibit a significant resemblance, because of the consistent bias of the reporters’ presence estimation (Supporting Information, Figure S10). The fact that these misclassifications arise from the combination of particular mixture ratios and particular estimation biases shows that not only the choice of Raman reporters is important when designing a sensing system, but also that the way in which each reporter is assigned to each biomarker can make an impact on the platform’s capabilities.
Regarding these biases, the discrepancy between the real and predicted ratios by the classifier could be due to several factors. As previously discussed, all nanotags used had the same antibody conjugate and the test areas had the same antibody immobilized on the paper strip, so relative antibody–antigen affinities cannot account for the discrepancy. However, different Ab coverage between nanotags can distort the estimated presence of each reporter and while these differences are irrelevant when running the nanotags individually, they are a key factor when mixed together, suggesting a collective effect. In addition, we know that signal throughout the test line is not uniform, where the bottom of the test area has a much higher signal than the rest of the spot.32 Aggregation of nanotags at the test area can further increase the signal because of creation of hot spots. If nanotags do not migrate uniformly through the spot, and reporter coverages on the GNS differ, then their signal could be enhanced differently.
We also analyzed the separability of GNS–Rep–PEG with no antibodies mixed in the same ratios as shown in Table 1 and spotted onto the nitrocellulose support without running the dipstick assay. Spectra of the GNS–Rep–PEG were similar to the Ab-conjugated nanotags (Supporting Information, Figure S11), although the SERS signal from the immunoassay test line showed higher peak resolution and thus provided more information regarding the content of the mixture. LS estimation for spotted samples (Supporting Information Figure S12) showed higher deviation of the values caused by the lower homogeneity of the spotted samples as compared to the test line (dipstick test), and hence the LDA classifier showed a poor performance in distinguishing among different mixtures (Supporting Information Figure S13).
Conclusions
The application of SERS for multiplexed bioassays is rapidly growing, with examples in cell imaging, biomarker detection, and so forth. We report an approach for choosing multiple reporters in an optimal manner and a means to quantitatively evaluate their levels with an accuracy of 88%, which could be particularly interesting for the detection of nonspecific biomarkers present in diverse clinical conditions. Certain reporter molecules such as PCTP tend to be overestimated in their spectral contribution, so the approach could aid in the choice of reporters. The nanotag set here described could be further expanded by the presented approach to increase the degree of multiplexing. This work could aid in the choice of reporters for other types of nanotags made of materials beyond Au, and for other sensing and imaging applications beyond paper-based immunoassays. Thus, a general approach for quantitatively evaluating a set of chosen reporters would facilitate the design of Raman nanotags.
There are some drawbacks to the use of the correlation matrix for evaluating the spectral overlap of Raman reporters. The value of the correlation depends on the spectra region of interest and is calculated based on normalized spectra. In theory, there may be cases where two spectra have nearly identical spectra but possess two highly prominent peaks that are distinct, making it easy to distinguish one another. In this case, the correlation value could be overestimated. Nevertheless, the correlation value provides a quantitative measure of overlap, providing an improvement over typical approaches, which often involve estimation by eye, which is difficult to scale up to more than 2 or 3 reporters. Thus, while it is not optimal, it can still be used as a guide and/or initial screen for choosing reporters.
Other areas of improvement could be in the stability of GNS, which are sometimes observed to reshape over time under certain conditions. However, GNS stability is improved by surface functionalization and biomolecular conjugation.19 Furthermore, using a full LFA format could also aid GNS stability where the nanotags would be dried down into a conjugate pad along with stabilization molecules.
Materials and Methods
Reagents
Gold chloride trihydrate (CAS: 16961-25-4), HEPES (CAS: 7365-45-9), sucrose (CAS: 57-50-1), BSA (CAS: 9048-46-8), DTNB (CAS: 69-78-3), Tween-20 (CAS: 9005-64-5), IgG from human serum, anti-human IgG (whole molecule), and anti-goat IgG (Fc specific) were purchased from Sigma-Aldrich. Reporter molecules purchased from Sigma-Aldrich were BCB ALD (CAS: 81029-05-2), CV (CAS: 548-62-9), MB (CAS: 122965-43-9), MG chloride (CAS: 569-64-2), MEG zinc chloride double salt (CAS: 224967-52-6), NR (CAS: 553-24-2), RB (CAS: 632-69-9), R6G (CAS: 989-38-8), VB R (CAS: 2185-86-6), ATP (CAS: 1193-02-8), BPE (CAS: 3362-78-2), MBA (CAS: 1074-36-8), and DTNB (CAS: 69-78-3). DCT (CAS: 17231-94-6) was purchased from TCI America and PCTP (CAS: 133-49-3) from Santa Cruz Biotechnology. Thiolated mPEG (5 kDa ) was purchased from Nanocs. Phosphate-buffered saline (PBS) pH 7.4 was from Gibco (CAT: 10010-049). Micro BCA Protein Assay Kit was purchased from Thermo Fisher. Nitrocellulose sheets with backing were purchased from Millipore.
Synthesis and Conjugation of Nanostars
GNS were synthesized using a previously described method.31 Briefly, 9 mL of 140 mM HEPES (pH 7.4) was mixed with 1 mL of 18 MΩ deionized (Milli-Q) water, followed by the addition of 80 μL of 10 mg/mL HAuCl4·3H2O and further vortexing. The solution sat undisturbed for 1 h for the nanostar formation. Afterward, GNSs were separated from excess reagents by centrifugation at 4000 rcf for 20 min. The supernatant was then removed, and the nanostar pellet was resuspended in 5 mL of Milli-Q water. Then, the solution was divided into five equal parts of 1 mL, one for each Raman reporter. The Raman reporter molecule of interest was added and vortexed, 2.15 μL of BPE, 20 μL of MBA, 15 μL DCT, 30 μL PCTP, and 2.5 μL DTNB, to have approximately a reporter monolayer on the nanostars’ surface, assuming a maximal footprint of 70.18, 49.89, 38.52, 47.09, and 73.75 Å2 for each reporter, respectively, calculated with MarvinSketch, and so, that they have similar SERS intensity. The solution was left undisturbed for 30 min and was further centrifuged for 20 min at 4000 rcf for 20 min and then resuspended in 1 mL Milli-Q water. For antibody conjugation, 10 μL of 4.4 mg/mL Ab was added to each nanostars’ solution previously prepared, and the resulting solution was vortexed and further shaken overnight at room temperature. Afterward, 100 μL of 10–5 M mPEG 5 kDa was added to each sample, vortexed and further shaken for 30 min. Last, the solutions were centrifuged at 4000 rcf for 20 min to remove excess reagents and were then ready for use.
GNS Characterization
Optical absorption spectra of the GNPs were obtained on a SpectraMax M5 plate reader (Molecular Devices). Morphology of the GNS was characterized with a FEI Tecnai G2 TEM at 120 kV. ImageJ was used to process TEM images and measure the dimensions of the GNS. In addition, a Zetasizer Nano ZS from Malvern Instruments was used to measure the hydrodynamic diameter (DH) and the ζ of plain GNS and their Ab conjugates. A micro BCA test was performed to quantify the antibody attached to GNS and was used to quantify the amount of antibody bound per nanoparticle. Briefly, 150 μL of sample were mixed with 150 μL of BCA reagent (prepared as stated in Thermo Fisher micro BCA protocol) in a 96-well plate. The standard curve was performed with initial concentrations of 50 μg/mL of BSA with subsequent twofold dilutions to obtain 7 points. Both samples and standards were incubated at 37 °C for 2 h. Absorbance at 562 nm was read in a plate reader.
Raman Spectroscopy
Raman and SERS spectra were acquired using a Raman Senterra II microscope (Bruker Optiks GmbH, Germany). A Ne laser with a power of 1 mW operating at λ = 785 nm was utilized as the excitation source. A thermoelectrically cooled CCD detector was coupled to a spectrograph. SERS measurements across the test area were obtained using a point-by-point mapping mode. A computer-controlled translational stage was used to scan an area of 2 × 2 mm in 130 μm × 130 μm steps with a 20× objective lens. The data integration time at each point was 5 s with five co-additions. The numerical aperture of the objective lens used was 50 × 1000 μm. The spectra acquired for each spot were decoded using OPUS software v 7.0 (Bruker Optiks GmbH, Germany). The baselines of each spectra were corrected by concave Rubberband correction method using 15 iterations and 64 baseline points. Mathematical calculations on the spectra such as spectra averaging, intensity, area, or peak shift measurements were performed in Matlab.
Dipstick Assay
Dipstick assays consisted of nitrocellulose strip with immobilized antibodies attached to an absorbent pad as a wick. Antibodies were immobilized on the nitrocellulose strip by manually pipetting 0.3 μL of a 2 mg/mL solution of antibody onto the nitrocellulose paper and further allowed to dry for at least 30 min. In the test area, polyclonal anti-human IgG antibodies were immobilized. The control line was spotted with goat antibody that could bind to the Fc fragment of the mouse IgG antibodies on the GNS. To run the test, the strip was submerged at its lower end in the test solution containing 4 μL of 50 w/v % sucrose in water, 8 μL of 1 v/v % Tween 80 in PBS, 1 μL of the GNS–Ab conjugates, BSA, and the analyte (IgG), rendering a total volume of 45 μL. Then, the solution migrated through the strip upward via capillary action to the absorbent pad attached to the upper end of the strip. When all of the solution had been absorbed, the strip was washed with 80 μL of 0.1 v/v % Tween 80 in PBS through the same procedure to eliminate unbound conjugates and allowed to dry. Wash or diluent steps are commonly used in commercially available LFAs.39
Machine Learning
NNLS finds the weights of the linear combination of spectra from the pure components contained in the sample that minimizes the squared difference with the spectrum of the sample. For individual samples with just one nanotag, the SERS signal was considered to have 6 components: BPE, MBA, DCT, PCTP, DTNB, and nitrocellulose. NNLS of the six components from 800 to 1800 cm–1 was performed in Matlab. For each strip, the NNLS analysis was carried out to estimate the contribution of the reporters in each scanning measurement. The detection capabilities of the approach were assessed by using a LDA classifier with a Monte Carlo cross-validation scheme. To train the classifier, 15 spectra of each sample were used. Then, to test the classifier, five spectra from each sample were randomly picked, a process that was repeated 200 times and the results of each iteration were aggregated. For mixtures with more than one nanotag, nitrocellulose contribution was neglected in the LS algorithm, as GNS concentration is higher on the strip and thus nitrocellulose signal was not detected. A separate classifier was used for these mixtures, and its training and testing was performed as aforementioned.
The confusion matrix was calculated using Matlab Neural Network toolbox, which provides the accuracy or TPR (%) and the negative false rate (%) for each sample and for the overall performance classifying the 12 mixtures. The TPR or accuracy for each sample equals to the sum of positively classified elements divided by the total number of events (1000 each sample), whereas the FNR is the percentage of the wrongly classified elements from the total. Similarly, the overall accuracy is equal to the sum of the diagonal elements (correctly classified cases) divided by the total number of cases (diagonals + off-diagonals).40
Acknowledgments
We thank the CMSE at MIT for the use of TEM facilities and the Center for Personalized Cancer Therapy (CPCT) at UMass Boston for use of the Raman microscope.
Glossary
Abbreviations
- Ab
antibody
- ATP
4-aminothiophenol
- BCB
brilliant cresyl blue
- BPE
1,2-bis(4-pyridyl)ethylene
- BPE–nanotag
GNS–BPE–anti-IgG
- BSA
bovine albumin serum
- CV
crystal violet
- DCT
3,5-dichlorobenzenthiol
- DCT–nanotag
GNS–DCT–anti-IgG
- DLS
dynamic light scattering
- DTNB
5,5′-dithiobis(2-nitrobenzoic acid)
- DTNB–nanotag
GNS–DTNB–anti-IgG
- FNR
false negative rate
- GNS
gold nanostar
- LDA
linear discriminant analysis
- LFA
lateral flow assay
- LS
least squares
- MBA
4-mercaptobenzoic acid
- MBA–nanotag
GNS–MBA–anti-IgG
- MB
methylene blue
- MEG
methylene green
- MG
malachite green chloride
- NNLS
non-negative least squares
- NR
neutral red
- NT
nanotag
- PCTP
pentachlorothiophenol
- PCTP–nanotag
GNS–PCTP–anti-IgG
- PEG
polyethylene glycol
- POC
point-of-care
- RB
rose bengal
- R6G
rhodamine 6G
- SERS
surface-enhanced Raman spectroscopy
- TEM
transmission electron microscopy
- TPR
true positive rate
- VB
victoria blue
Supporting Information Available
The Supporting Information is available free of charge on the ACS Publications website at DOI: 10.1021/acsomega.8b01499.
Aggregation indices of the nanotags, protein coverage quantification, SERS of immunoassay negative controls, immunoassays varying nanotag and antigen concentrations, individual nanotag tests and mixtures, and nanotag ratio estimation are in the Supporting Information (PDF)
Author Contributions
∇ These authors contributed equally.
Author Contributions
The manuscript was written through contributions of all authors. All authors have given approval to the final version of the manuscript.
C.R.-Q. was supported by a Rafael del Pino Fellowship and B.M.L. was supported by a fellowship from Ronald E. McNair grant P217A170241 to the University of Massachusetts Boston.
The authors declare no competing financial interest.
Supplementary Material
References
- Lu X.; Rycenga M.; Skrabalak S. E.; Wiley B.; Xia Y. Chemical Synthesis of Novel Plasmonic Nanoparticles. Annu. Rev. Phys. Chem. 2009, 60, 167–192. 10.1146/annurev.physchem.040808.090434. [DOI] [PubMed] [Google Scholar]
- Zeman E. J.; Schatz G. C. An Accurate Electromagnetic Theory Study of Surface Enhancement Factors for Silver, Gold, Copper, Lithium, Sodium, Aluminum, Gallium, Indium, Zinc, and Cadmium. J. Phys. Chem. 1987, 91, 634–643. 10.1021/j100287a028. [DOI] [Google Scholar]
- Reguera J.; Langer J.; de Aberasturi D. J.; Liz-Marzán L. M. Anisotropic Metal Nanoparticles for Surface Enhanced Raman Scattering. Chem. Soc. Rev. 2017, 46, 3866–3885. 10.1039/c7cs00158d. [DOI] [PubMed] [Google Scholar]
- Fabris L. Gold-Based Sers Tags for Biomedical Imaging. J. Opt. 2015, 17, 114002. 10.1088/2040-8978/17/11/114002. [DOI] [Google Scholar]
- Vo-Dinh T.; Liu Y.; Fales A. M.; Ngo H.; Wang H.-N.; Register J. K.; Yuan H.; Norton S. J.; Griffin G. D. Sers Nanosensors and Nanoreporters: Golden Opportunities in Biomedical Applications. Wiley Interdiscip. Rev.: Nanomed. Nanobiotechnol. 2014, 7, 17–33. 10.1002/wnan.1283. [DOI] [PubMed] [Google Scholar]
- Cao Y. C.; Jin R.; Nam J.-M.; Thaxton C. S.; Mirkin C. A. Raman Dye-Labeled Nanoparticle Probes for Proteins. J. Am. Chem. Soc. 2003, 125, 14676–14677. 10.1021/ja0366235. [DOI] [PubMed] [Google Scholar]
- Porter M. D.; Lipert R. J.; Siperko L. M.; Wang G.; Narayanan R. Sers as a Bioassay Platform: Fundamentals, Design, and Applications. Chem. Soc. Rev. 2008, 37, 1001–1011. 10.1039/b708461g. [DOI] [PubMed] [Google Scholar]
- Gao J.; Sánchez-Purrà M.; Huang H.; Wang S.; Chen Y.; Yu X.; Luo Q.; Hamad-Schifferli K.; Liu S. Synthesis of Different-Sized Gold Nanostars for Raman Bioimaging and Photothermal Therapy in Cancer Nanotheranostics. Sci. China: Chem. 2017, 60, 1219. 10.1007/s11426-017-9088-x. [DOI] [Google Scholar]
- Bodelón G.; Montes-García V.; Fernández-López C.; Pastoriza-Santos I.; Pérez-Juste J.; Liz-Marzán L. M. Au@Pnipam Serrs Tags for Multiplex Immunophenotyping Cellular Receptors and Imaging Tumor Cells. Small 2015, 11, 4149–4157. 10.1002/smll.201500269. [DOI] [PubMed] [Google Scholar]
- Jokerst J. V.; Miao Z.; Zavaleta C.; Cheng Z.; Gambhir S. S. Affibody-Functionalized Gold-Silica Nanoparticles for Raman Molecular Imaging of the Epidermal Growth Factor Receptor. Small 2011, 7, 625–633. 10.1002/smll.201002291. [DOI] [PMC free article] [PubMed] [Google Scholar]
- Wang R.; Kim K.; Choi N.; Wang X.; Lee J.; Jeon J. H.; Rhie G.-e.; Choo J. Highly Sensitive Detection of High-Risk Bacterial Pathogens Using Sers-Based Lateral Flow Assay Strips. Sens. Actuators, B 2018, 270, 72–79. 10.1016/j.snb.2018.04.162. [DOI] [Google Scholar]
- He S.; Chua J.; Tan E. K. M.; Kah J. C. Y. Optimizing the Sers Enhancement of a Facile Gold Nanostar Immobilized Paper-Based Sers Substrate. RSC Adv. 2017, 7, 16264–16272. 10.1039/c6ra28450g. [DOI] [Google Scholar]
- Hwang J.; Lee S.; Choo J. Application of a Sers-Based Lateral Flow Immunoassay Strip for the Rapid and Sensitive Detection of Staphylococcal Enterotoxin B. Nanoscale 2016, 8, 11418–11425. 10.1039/c5nr07243c. [DOI] [PubMed] [Google Scholar]
- Kang H.; Jeong S.; Koh Y.; Cha M. G.; Yang J.-K.; Kyeong S.; Kim J.; Kwak S.-Y.; Chang H.-J.; Lee H.; Jeong C.; Kim J.-H.; Jun B.-H.; Kim Y.-K.; Jeong D. H.; Lee Y.-S. Direct Identification of on-Bead Peptides Using Surface-Enhanced Raman Spectroscopic Barcoding System for High-Throughput Bioanalysis. Sci. Rep. 2015, 5, 10144. 10.1038/srep10144. [DOI] [PMC free article] [PubMed] [Google Scholar]
- Faulds K.; Smith W. E.; Graham D. Evaluation of Surface-Enhanced Resonance Raman Scattering for Quantitative DNA Analysis. Anal. Chem. 2004, 76, 412–417. 10.1021/ac035060c. [DOI] [PubMed] [Google Scholar]
- Lai Y.; Sun S.; He T.; Schlücker S.; Wang Y. Raman-Encoded Microbeads for Spectral Multiplexing with Sers Detection. RSC Adv. 2015, 5, 13762–13767. 10.1039/c4ra16163g. [DOI] [Google Scholar]
- Qian X.-M.; Nie S. M. Single-Molecule and Single-Nanoparticle Sers: From Fundamental Mechanisms to Biomedical Applications. Chem. Soc. Rev. 2008, 37, 912–920. 10.1039/b708839f. [DOI] [PubMed] [Google Scholar]
- Guerrini L.; Pazos-Perez N.; Garcia-Rico E.; Alvarez-Puebla R. Cancer Characterization and Diagnosis with Sers-Encoded Particles. Cancer Nanotechnol. 2017, 8, 5. 10.1186/s12645-017-0031-3. [DOI] [Google Scholar]
- de Aberasturi D. J.; Serrano-Montes A. B.; Langer J.; Henriksen-Lacey M.; Parak W. J.; Liz-Marzán L. M. Surface Enhanced Raman Scattering Encoded Gold Nanostars for Multiplexed Cell Discrimination. Chem. Mater. 2016, 28, 6779–6790. 10.1021/acs.chemmater.6b03349. [DOI] [Google Scholar]
- Cao Y. C.; Jin R.; Mirkin C. A. Nanoparticles with Raman Spectroscopic Fingerprints for DNA and Rna Detection. Science 2002, 297, 1536–1540. 10.1126/science.297.5586.1536. [DOI] [PubMed] [Google Scholar]
- Xia X.; Li W.; Zhang Y.; Xia Y. Silica-Coated Dimers of Silver Nanospheres as Surface-Enhanced Raman Scattering Tags for Imaging Cancer Cells. Interface Focus 2013, 3, 20120092. 10.1098/rsfs.2012.0092. [DOI] [PMC free article] [PubMed] [Google Scholar]
- Osinkina L.; Lohmüller T.; Jäckel F.; Feldmann J. Synthesis of Gold Nanostar Arrays as Reliable, Large-Scale, Homogeneous Substrates for Surface-Enhanced Raman Scattering Imaging and Spectroscopy. J. Phys. Chem. C 2013, 117, 22198–22202. 10.1021/jp312149d. [DOI] [Google Scholar]
- Kearns H.; Shand N. C.; Smith W. E.; Faulds K.; Graham D. 1064 Nm Sers of Nir Active Hollow Gold Nanotags. Phys. Chem. Chem. Phys. 2015, 17, 1980–1986. 10.1039/c4cp04281f. [DOI] [PubMed] [Google Scholar]
- Lutz B. R.; Dentinger C. E.; Nguyen L. N.; Sun L.; Zhang J.; Allen A. N.; Chan S.; Knudsen B. S. Spectral Analysis of Multiplex Raman Probe Signatures. ACS Nano 2008, 2, 2306–2314. 10.1021/nn800243g. [DOI] [PMC free article] [PubMed] [Google Scholar]
- Mir-Simon B.; Reche-Perez I.; Guerrini L.; Pazos-Perez N.; Alvarez-Puebla R. A. Universal One-Pot and Scalable Synthesis of Sers Encoded Nanoparticles. Chem. Mater. 2015, 27, 950–958. 10.1021/cm504251h. [DOI] [Google Scholar]
- Zavaleta C. L.; Smith B. R.; Walton I.; Doering W.; Davis G.; Shojaei B.; Natan M. J.; Gambhir S. S. Multiplexed Imaging of Surface Enhanced Raman Scattering Nanotags in Living Mice Using Noninvasive Raman Spectroscopy. Proc. Natl. Acad. Sci. U.S.A. 2009, 106, 13511–13516. 10.1073/pnas.0813327106. [DOI] [PMC free article] [PubMed] [Google Scholar]
- Innis B. L.; Suntayakorn S.; Nimmannitya S.; Hoke C. H.; Chongswasdi V.; Puttisri P.; Nisalak A.; Kusalerdchariya S. An Enzyme-Linked Immunosorbent Assay to Characterize Dengue Infections Where Dengue and Japanese Encephalitis Co-Circulate. Am. J. Trop. Med. Hyg. 1989, 40, 418–427. 10.4269/ajtmh.1989.40.418. [DOI] [PubMed] [Google Scholar]
- Sánchez-Purrà M.; Carré-Camps M.; de Puig H.; Bosch I.; Gehrke L.; Hamad-Schifferli K. Surface-Enhanced Raman Spectroscopy-Based Sandwich Immunoassays for Multiplexed Detection of Zika and Dengue Viral Biomarkers. ACS Infect. Dis. 2017, 3, 767–776. 10.1021/acsinfecdis.7b00110. [DOI] [PMC free article] [PubMed] [Google Scholar]
- Dam D. H. M.; Lee J. H.; Sisco P. N.; Co D. T.; Zhang M.; Wasielewski M. R.; Odom T. W. Direct Observation of Nanoparticle-Cancer Cell Nucleus Interactions. ACS Nano 2012, 6, 3318–3326. 10.1021/nn300296p. [DOI] [PMC free article] [PubMed] [Google Scholar]
- Xie J.; Zhang Q.; Lee J. Y.; Wang D. I. C. The Synthesis of Sers-Active Gold Nanoflower Tags for in Vivo Applications. ACS Nano 2008, 2, 2473–2480. 10.1021/nn800442q. [DOI] [PubMed] [Google Scholar]
- de Puig H.; Tam J. O.; Yen C.-W.; Gehrke L.; Hamad-Schifferli K. Extinction Coefficient of Gold Nanostars. J. Phys. Chem. C 2015, 119, 17408–17415. 10.1021/acs.jpcc.5b03624. [DOI] [PMC free article] [PubMed] [Google Scholar]
- Sánchez-Purrà M.; Roig-Solvas B.; Versiani A.; Rodriguez-Quijada C.; de Puig H.; Bosch I.; Gehrke L.; Hamad-Schifferli K. Design of Sers Nanotags for Multiplexed Lateral Flow Immunoassays. Mol. Syst. Des. Eng. 2017, 2, 401–409. 10.1039/c7me00052a. [DOI] [PMC free article] [PubMed] [Google Scholar]
- Kumar S.; Aaron J.; Sokolov K. Directional Conjugation of Antibodies to Nanoparticles for Synthesis of Multiplexed Optical Contrast Agents with Both Delivery and Targeting Moieties. Nat. Protoc. 2008, 3, 314–320. 10.1038/nprot.2008.1. [DOI] [PubMed] [Google Scholar]
- Kah J. C. Y.; Zubieta A.; Saavedra R. A.; Hamad-Schifferli K. Stability of Gold Nanorods Passivated with Amphiphilic Ligands. Langmuir 2012, 28, 8834–8844. 10.1021/la3000944. [DOI] [PubMed] [Google Scholar]
- de Puig H.; Bosch I.; Carré-Camps M.; Hamad-Schifferli K. Effect of the Protein Corona on Antibody-Antigen Binding in Nanoparticle Sandwich Immunoassays. Bioconjugate Chem. 2017, 28, 230–238. 10.1021/acs.bioconjchem.6b00523. [DOI] [PMC free article] [PubMed] [Google Scholar]
- Tan Y. H.; Liu M.; Nolting B.; Go J. G.; Gervay-Hague J.; Liu G.-y. A Nanoengineering Approach for Investigation and Regulation of Protein Immobilization. ACS Nano 2008, 2, 2374–2384. 10.1021/nn800508f. [DOI] [PMC free article] [PubMed] [Google Scholar]
- Tobie J. E.; Abele D. C.; Wolff S. M.; Contacos P. G.; Evans C. B. Serum Immunoglobulin Levels in Human Malaria and Their Relationship to Antibody Production. J. Immunol. 1966, 97, 498. [PubMed] [Google Scholar]
- de Puig H.; Bosch I.; Gehrke L.; Hamad-Schifferli K. Challenges of the Nano-Bio Interface in Lateral Flow and Dipstick Immunoassays. Trends Biotechnol. 2017, 35, 1169–1180. 10.1016/j.tibtech.2017.09.001. [DOI] [PMC free article] [PubMed] [Google Scholar]
- Lee S.; Kim G.; Moon J. Performance Improvement of the One-Dot Lateral Flow Immunoassay for Aflatoxin B1 by Using a Smartphone-Based Reading System. Sensors 2013, 13, 5109. 10.3390/s130405109. [DOI] [PMC free article] [PubMed] [Google Scholar]
- Foody G. M. Status of Land Cover Classification Accuracy Assessment. Remote Sens. Environ. 2002, 80, 185–201. 10.1016/s0034-4257(01)00295-4. [DOI] [Google Scholar]
Associated Data
This section collects any data citations, data availability statements, or supplementary materials included in this article.


